


Consolidation or Continuation? Silver’s Position after Channel Surge
Silver (XAGUSD) has confirmed a major structural shift by breaking out of its multi-decade ascending channel. The move followed years of compression and a well-formed cup-and-handle pattern that resolved above the key $60 resistance level.
This breakout triggered a sharp rally toward $120 before the price pulled back, signaling a potential short-term consolidation phase. Despite the retreat, silver remains elevated within the upper region of its long-term structure. At the same time, a breakdown in the M2-to-silver ratio confirms silver’s outperformance relative to fiat liquidity. This shift marks a broader revaluation phase driven by changing monetary dynamics and growing demand for hard assets.
Silver Breaks Out of Channel after Decade-Long Compression Phase
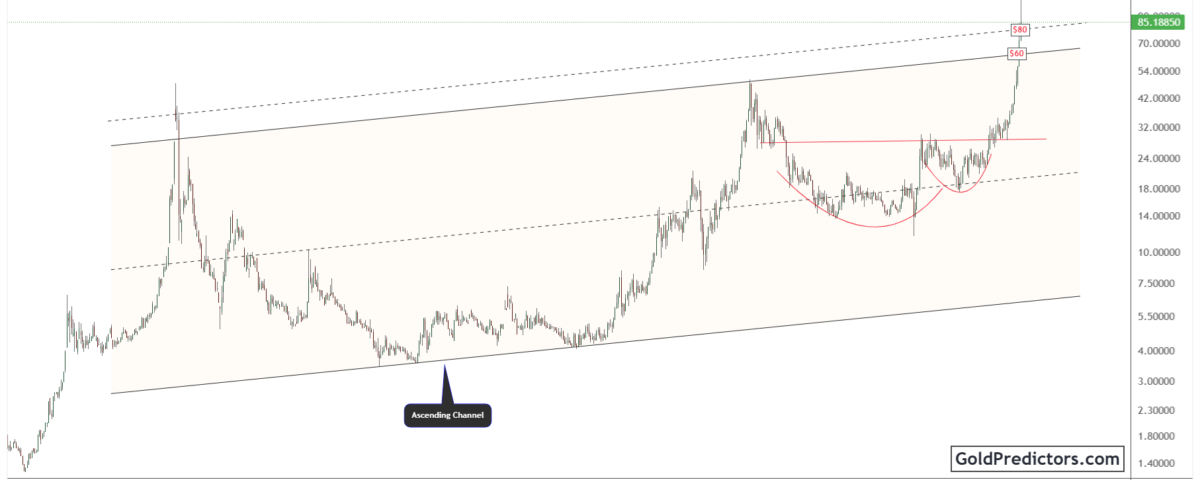
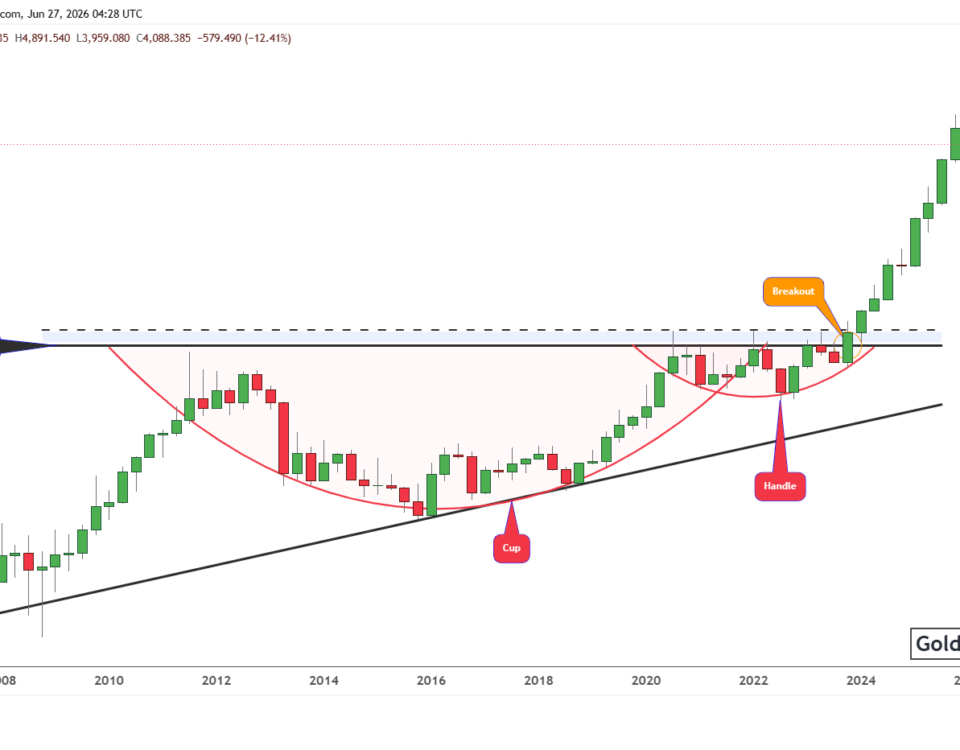
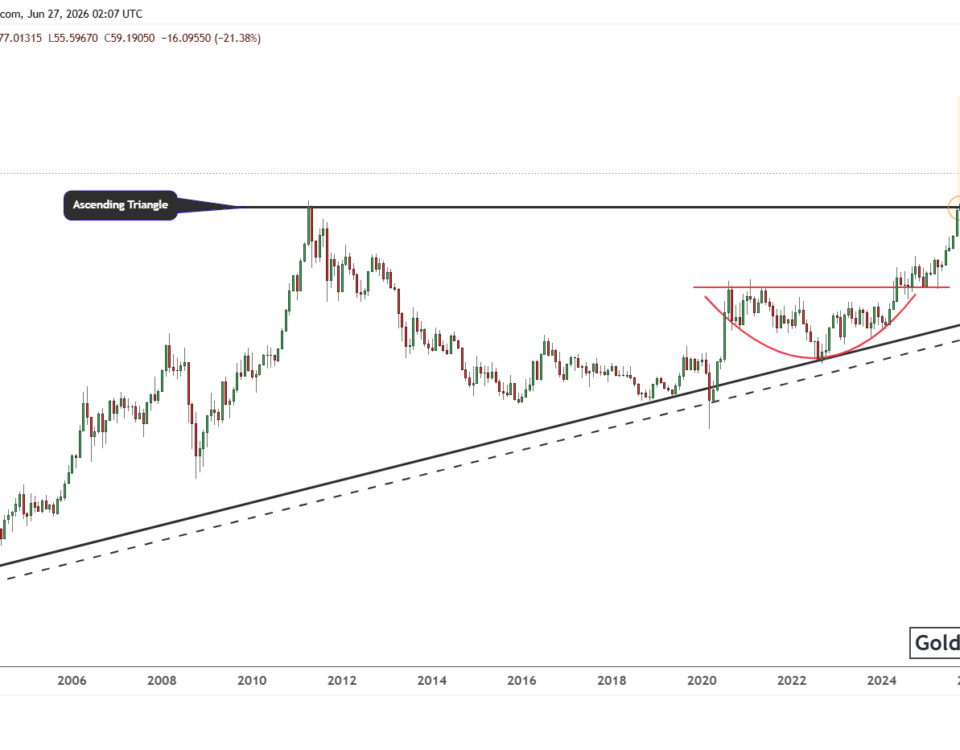
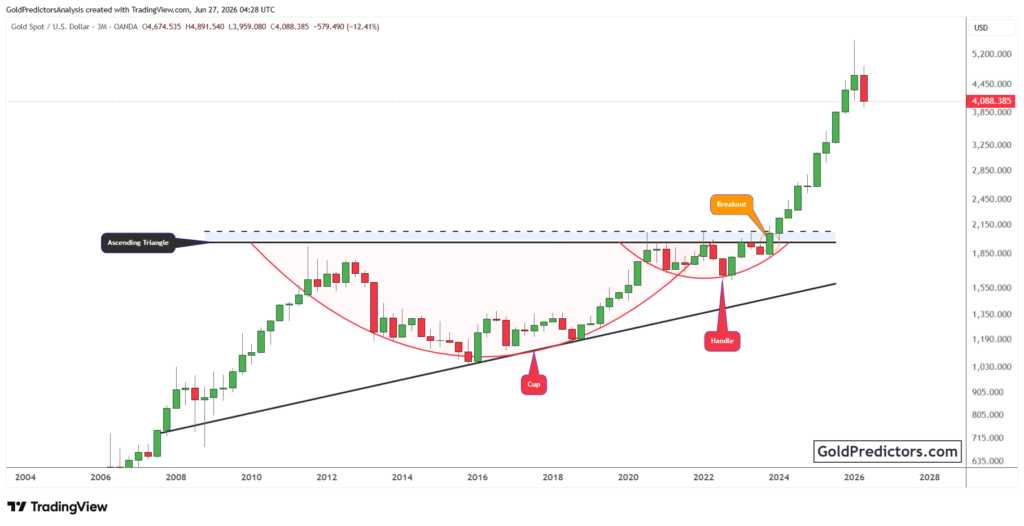
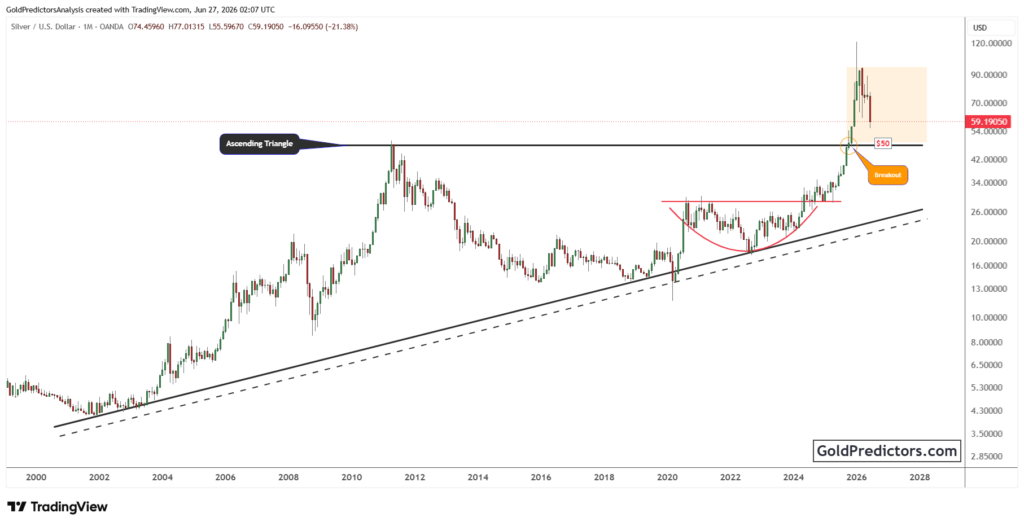
The silver chart below shows a decisive breakout from a multi-decade ascending channel that began in the early 1980s. The structure is defined by a rising lower boundary and a parallel resistance line, reflecting decades of upward compression. After a prolonged period of consolidation and multiple failed breakout attempts, silver formed a distinct cup-and-handle pattern between 2011 and 2024. Eventually, the pattern resolved with a decisive breakout above the $60 resistance zone, signaling a key technical turning point.
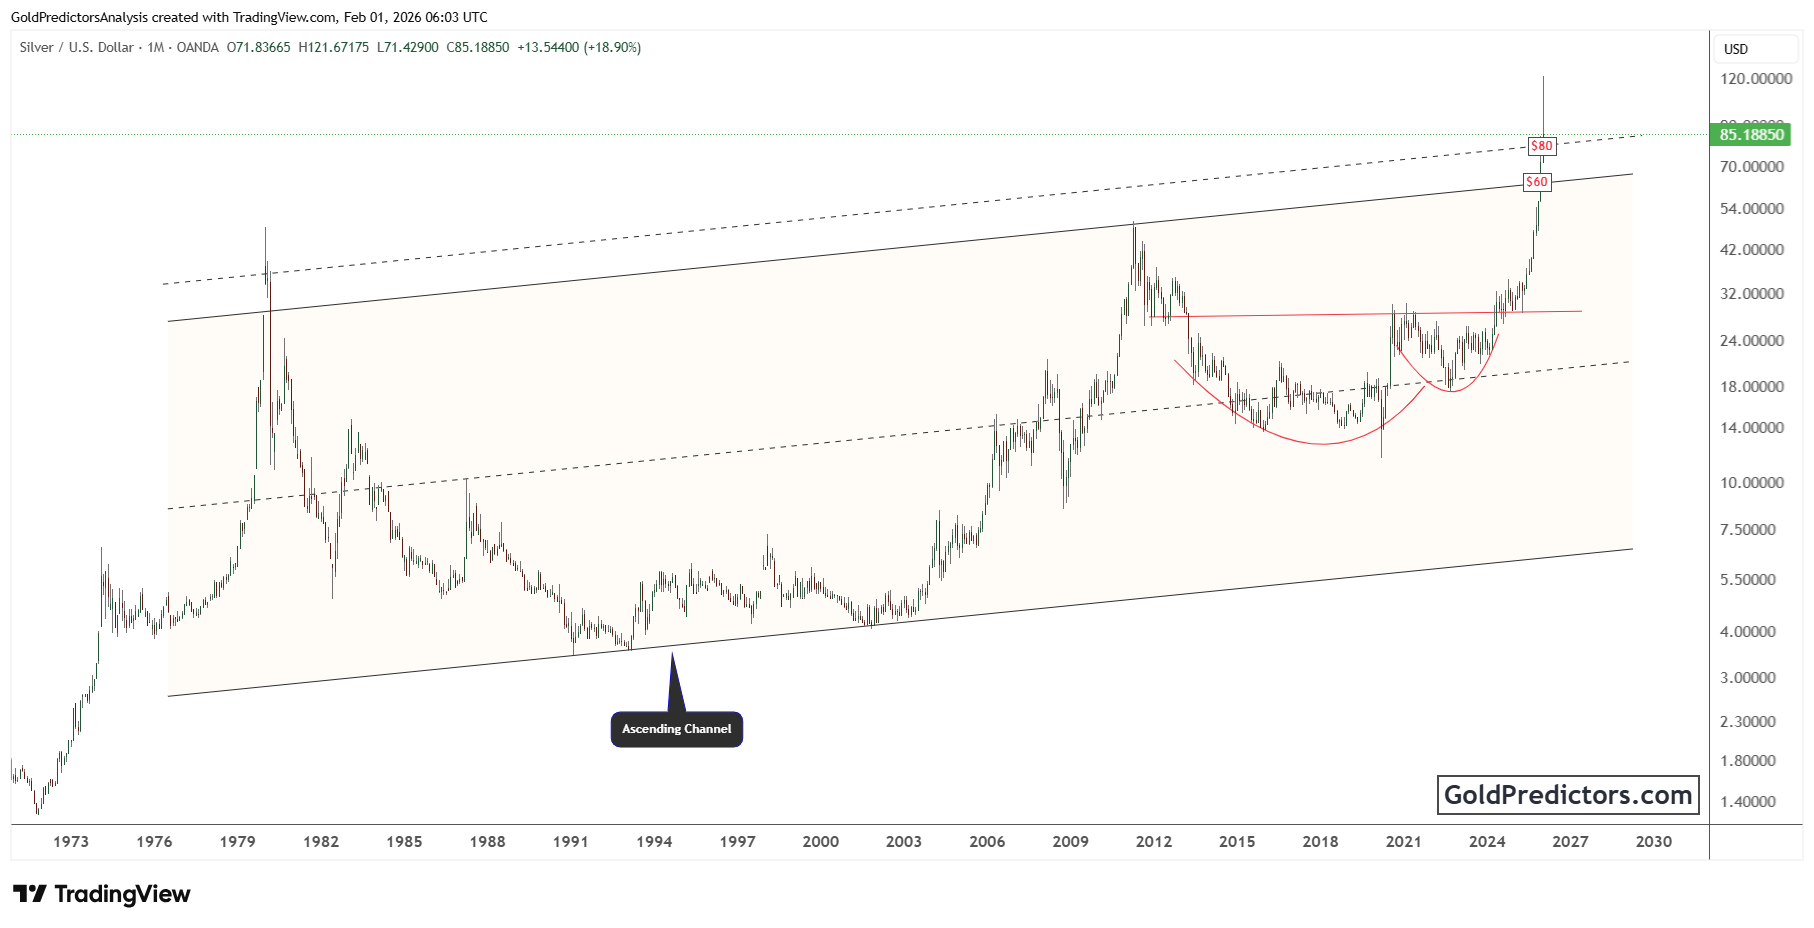
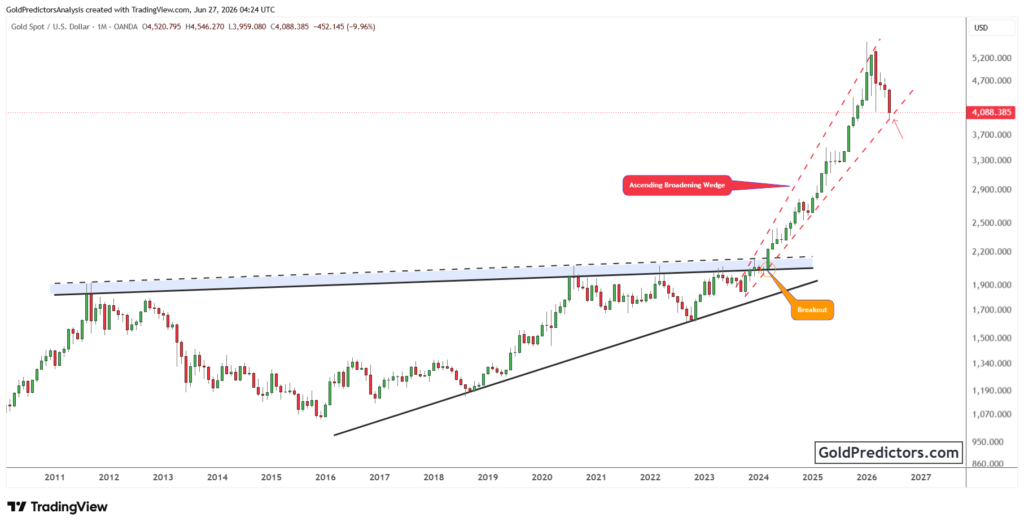
Silver’s breakout above the $60 level triggered a powerful surge, accelerating sharply once the price cleared this major resistance. The rally extended toward the $120 mark, briefly pushing silver beyond the upper boundary of its long-term ascending channel. However, after reaching this extreme, the price retreated sharply, signaling a potential pause in short-term momentum. Despite this correction, silver remains elevated and may now enter a short-term consolidation phase above prior breakout levels.
This advance also confirmed the breakout from the cup-and-handle formation, marking a structural shift and positioning silver within the upper band of its multi-decade channel. While the sharp pullback from recent highs introduces near-term uncertainty, the broader technical picture remains bullish. Measured projections based on both the cup-and-handle and the channel structure continue to suggest further upside potential. As long as silver holds above the $50–$60 zone, the technical setup remains constructive, and any consolidation in this range would likely form a base for the next leg higher in the long-term uptrend.
Silver Gains Ground as M2 Ratio Breaks Long-Term Support Line
The chart below shows a structural breakdown in the M2-to-silver ratio, highlighting the weakening position of money supply relative to silver. This long-term ratio reflects structural cycles and key support levels that have shaped price dynamics for decades. Since the early 1980s, it has followed a broad arc, marked by two major peaks that emerged during significant shifts in monetary conditions. Both peaks formed during periods of rapid monetary expansion and depressed silver prices, signaling major turning points in the metal’s long-term trend.
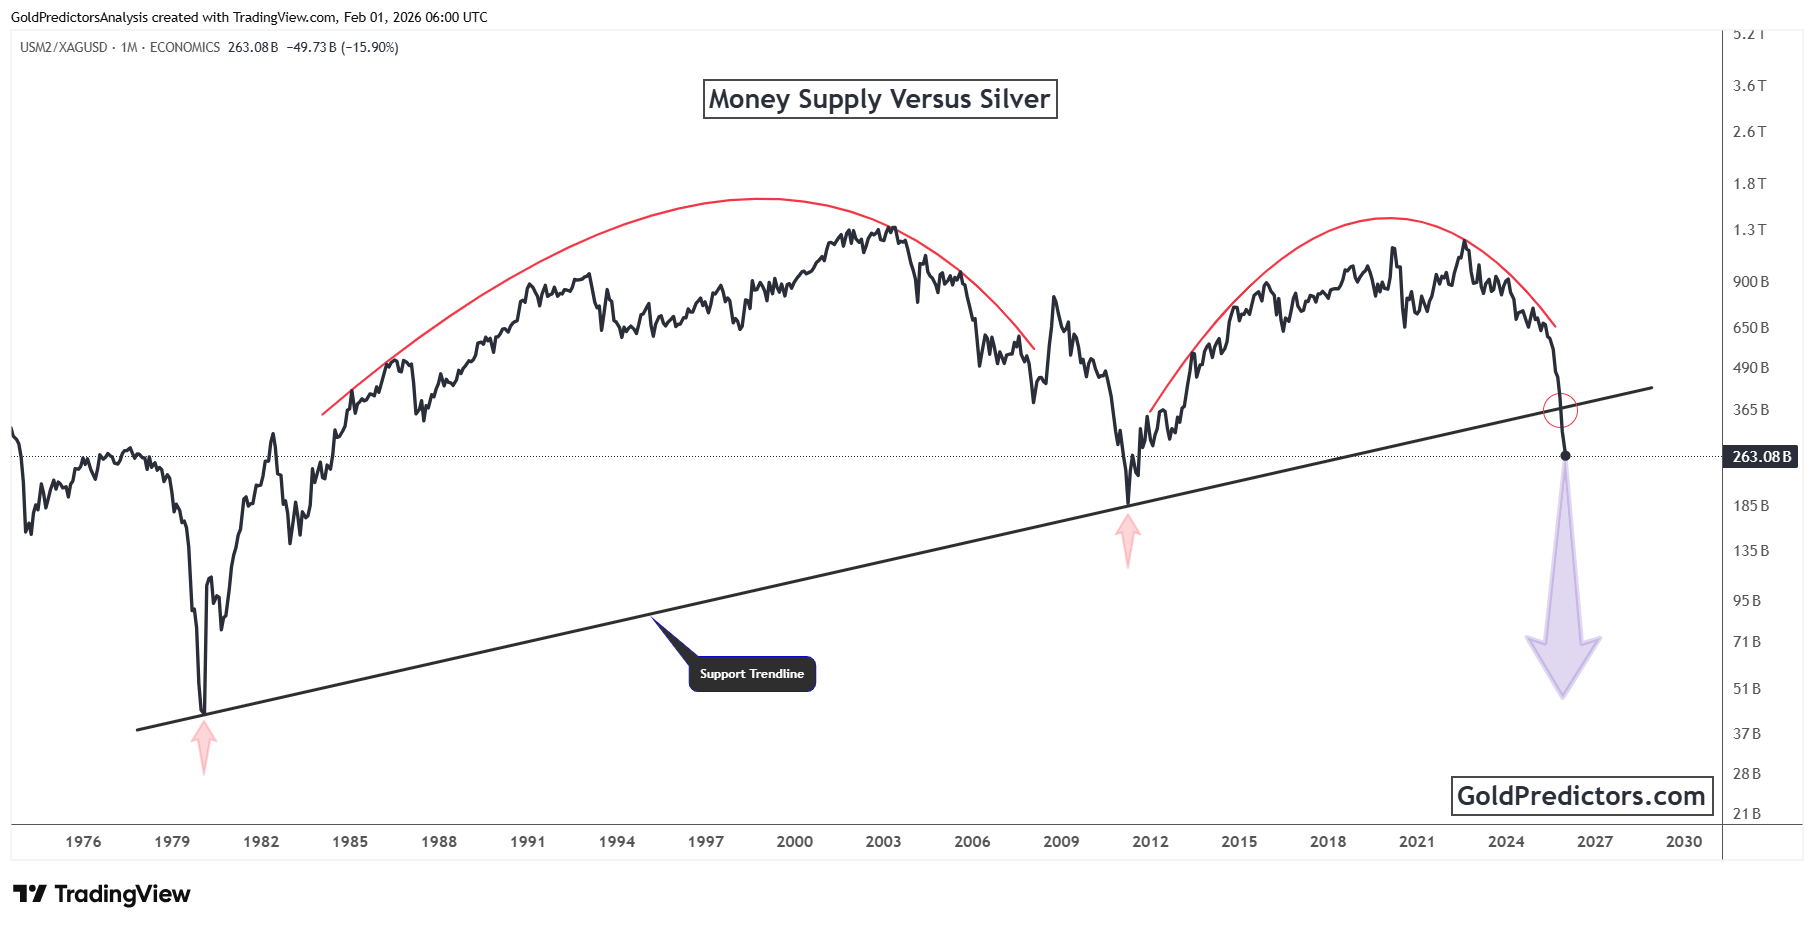
For decades, a rising trendline supported the M2-to-silver ratio, marking key inflection points in 1980 and 2011. In late 2025, the ratio broke decisively below this long-term support, signaling a structural revaluation of silver relative to fiat liquidity. This breakdown aligns with silver’s sharp price surge. It suggests that silver is undergoing a structural revaluation as investors seek stability in hard assets.
Furthermore, the breakdown in the M2-to-silver ratio carries deeper implications beyond technical structure. It marks a critical turning point in the metal’s long-term relationship with fiat liquidity. The loss of long-held support suggests the end of an era where monetary expansion consistently outpaced silver’s value. As money supply flattens or declines and silver continues to rise, the ratio may drop further. This shift supports the idea that silver is undergoing a revaluation in response to evolving monetary dynamics. It is increasingly regarded as a core asset for wealth preservation and systemic protection.
Final Thoughts: Silver Eyes Base Formation above $60 as Fiat Wanes
Silver has confirmed a decisive structural shift by breaking out of its multi-decade ascending channel. This move followed years of compression and a textbook cup-and-handle formation that resolved above $60. The breakout triggered a sharp rally toward $120 before encountering resistance and pulling back. Despite the correction, silver remains positioned in the upper region of its long-term structure, suggesting the broader uptrend remains intact.
At the same time, the M2-to-silver ratio has broken down through a key long-term support line. This breakdown confirms silver’s outperformance relative to fiat liquidity and marks a structural revaluation of the metal. As monetary expansion slows and hard assets gain favor, silver is increasingly emerging as a preferred store of value.
The combination of silver’s price breakout and the M2 ratio collapse highlights a deeper shift in its alignment with monetary trends. While long-term patterns still favor silver’s revaluation, the near-term outlook remains uncertain. As the price holds above $60, silver may enter a period of consolidation before a clearer directional move emerges.
Gold Predictors Premium Membership
Get exclusive short-term and swing trade ideas with precise entry levels, stop-loss, and target prices, including justification and analysis — all delivered directly via WhatsApp.
Our premium service includes deep technical analysis on gold and silver markets. We cover cycle analysis, price forecasting, and key timing levels.
Members also receive a weekly market letter with detailed analysis, commentary from our Chief Analyst, including actionable insights, trade timing, and direction forecasts for gold and silver.
Stay ahead of the market — join our premium community today.