

Gold Price Forecast: Can the Long-Term Triangle Breakout Hold?
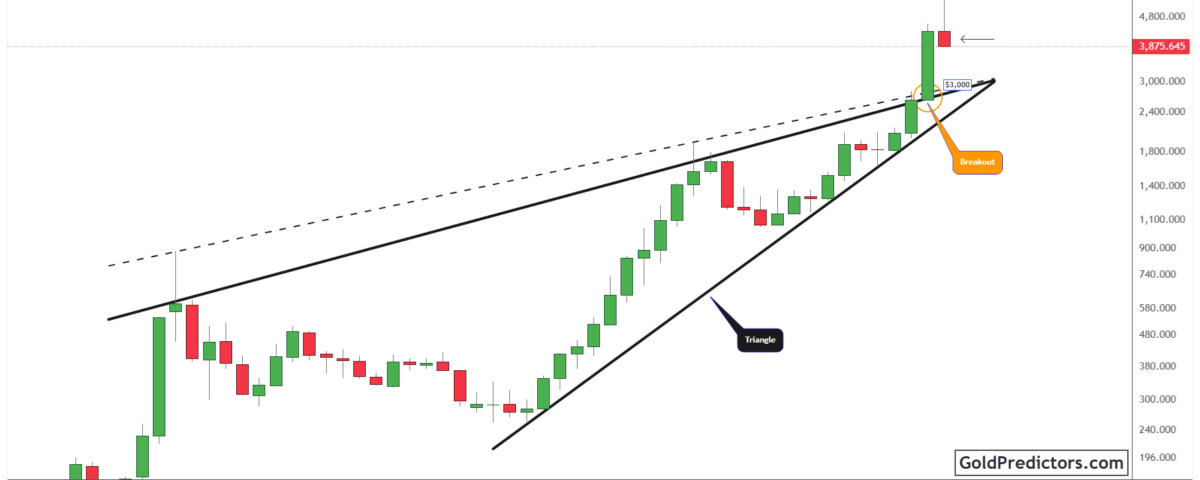
Gold (XAU/USD) enters November below $3,900 after a deep correction from its 2026 peak. Price remains above the major long-term breakout area around $3,000, but the latest decline keeps the outlook cautious. Meanwhile, the copper-to-gold ratio is recovering toward descending resistance. The next move depends on whether gold can stabilize and whether copper extends its relative recovery.
Gold Market Outlook: PCE Inflation Keeps Fed Rate Hike Risks in Focus
The Federal Reserve held interest rates at 3.75%–4.00% on 28 October, with two officials favoring a quarter-point increase. The split showed that further tightening remained a risk. Data released on 29 October added to that concern. The September PCE price index rose 0.5% from the previous month and 3.6% from a year earlier. The core index increased 0.3% monthly and 3.1% annually. The advance GDP estimate showed that the US economy expanded at a 3.4% annualized rate in the third quarter, up from 2.2% in the second. Persistent inflation and faster growth give the Fed room to keep policy tight. That could support bond yields and weigh on gold, which pays no interest.
Middle East developments add competing pressures. On 31 October, Iranian negotiators met Qatari mediators in Doha. US Secretary of State Marco Rubio said President Donald Trump had not decided on further strikes against Iran and preferred diplomacy. Renewed fighting could increase demand for gold as a defensive asset. However, disruption to oil supplies could lift energy prices and make inflation harder to control. That could sustain the risk of further rate increases and limit a gold recovery. Progress in talks could ease energy pressure while reducing defensive demand. Gold therefore faces a balance between geopolitical support and interest-rate pressure, making oil prices and bond yields key references.
Gold Technical Analysis: $3,000 Marks Major Long-Term Support
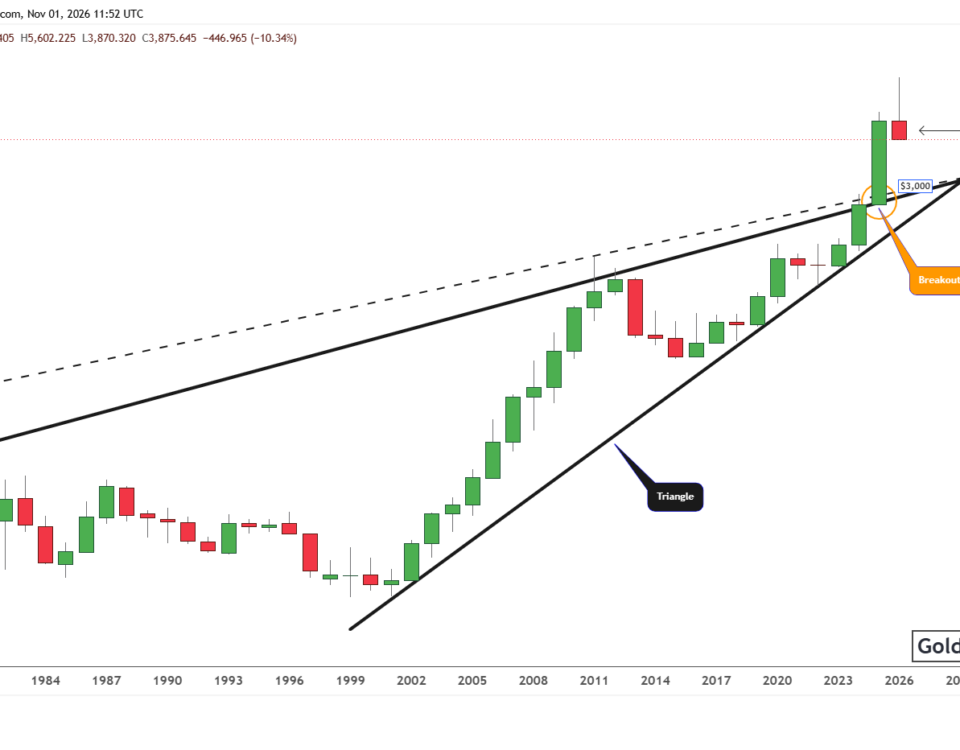
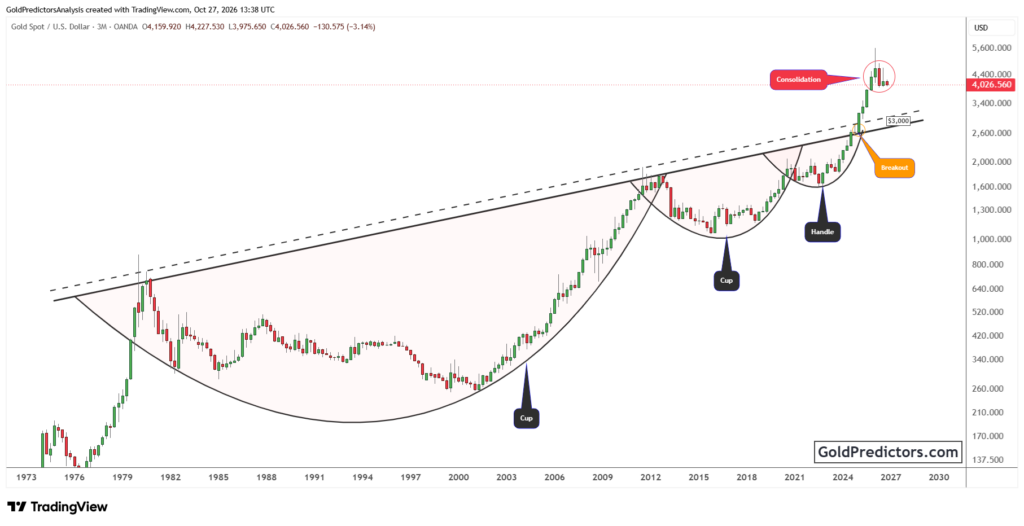
The gold chart below shows a breakout above the upper boundary of a multi-decade triangle. The marked $3,000 area provides a major structural reference around the former resistance region. Gold remains above this area despite its decline. The long-term breakout therefore remains in place, although it offers no assurance that the correction has ended.
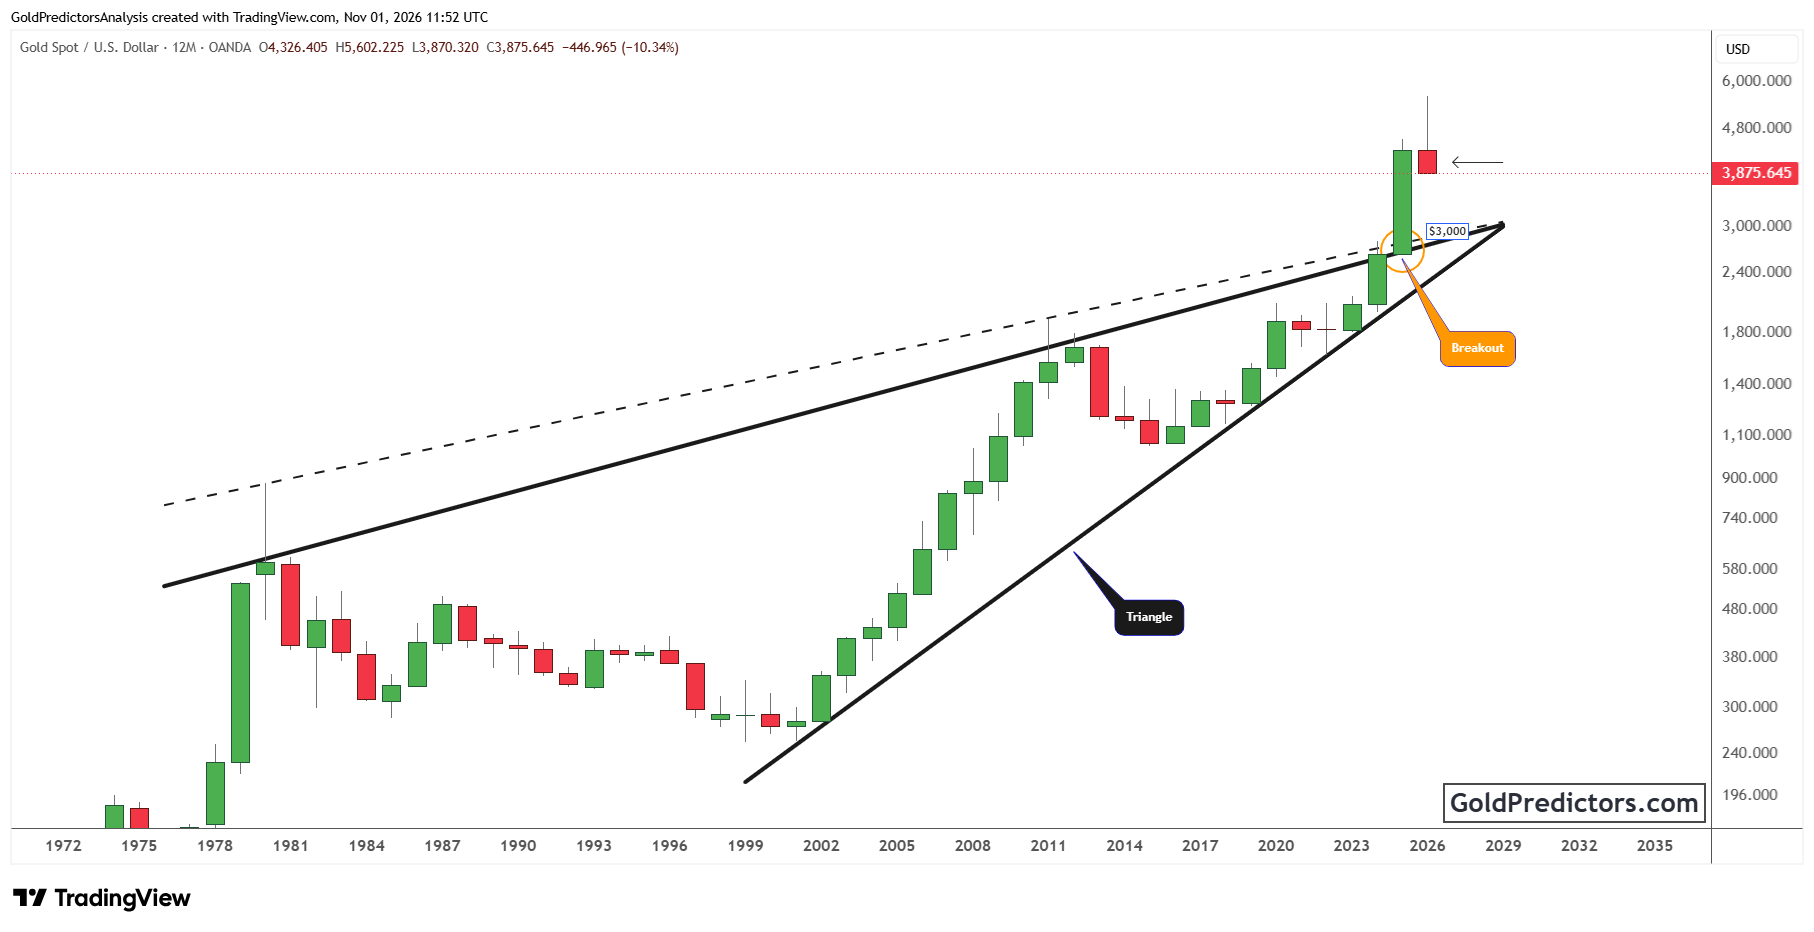
The unfinished 2026 candle records a high around $5,602 and a latest price near $3,876. Price sits close to the annual low around $3,870. The long upper wick shows the scale of the reversal from the peak. However, each candle covers a full year, so the current candle remains provisional until year-end.
A sustained recovery above $4,000 would help ease immediate pressure. If the price continues lower, the marked $3,000 region remains an important long-term support reference. Gold could find support before reaching this area. A sustained decline below the breakout region would weaken the long-term structure.
Copper-to-Gold Ratio Recovers toward Long-Term Wedge Resistance
The monthly copper-to-gold chart shows a descending wedge that has developed over decades. The ratio has recovered from the lower boundary around 0.0011–0.0012 to roughly 0.00170. Several earlier recoveries also began near the lower side of this structure. The latest advance brings the descending upper boundary back into focus, but the ratio remains below it.
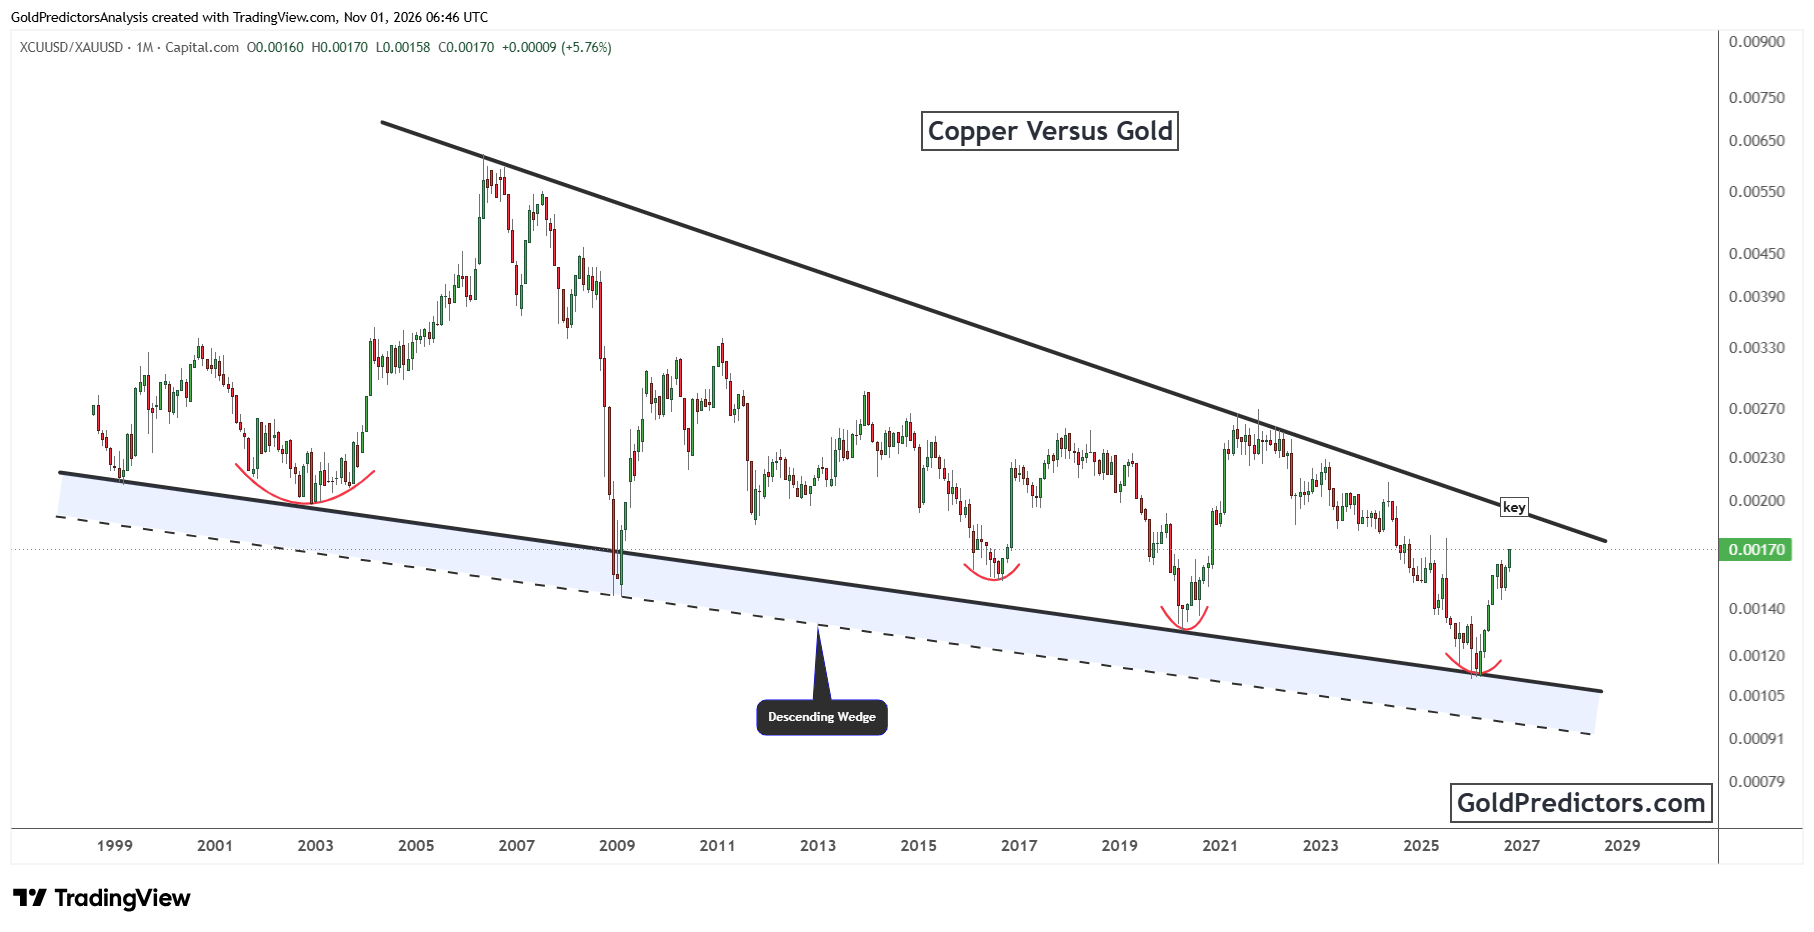
The rounded base near the lower boundary suggests that downward pressure on the ratio has eased. Similar bases previously led to recoveries toward wedge resistance. The current recovery could follow a similar path, with copper gaining ground relative to gold.
If the ratio moves above the upper boundary and stays above it, that would support a more durable shift toward copper outperformance. A decline from resistance would weaken the latest relative recovery and could favor gold over copper again. For now, the wedge remains intact. The next move at resistance will help clarify whether copper can maintain its recent advantage over gold.
Gold Price Outlook: Persistent Inflation Could Delay a Recovery
Gold faces a cautious outlook as persistent inflation and tight Fed policy could limit its recovery. The price remains above the major $3,000 breakout area, which keeps the long-term structure intact. A sustained move above $4,000 would ease immediate pressure. Bond yields and progress in Iran talks remain key influences. Meanwhile, a sustained break above wedge resistance in the copper-to-gold ratio would support further copper outperformance. A decline from that boundary could favor gold again.
Gold Predictors Premium Membership
Get exclusive short-term and swing trade ideas with precise entry levels, stop-loss, and target prices, including justification and analysis — all delivered directly via WhatsApp.
Our premium service includes deep technical analysis on gold and silver markets. We cover cycle analysis, price forecasting, and key timing levels.
Members also receive a weekly market letter with detailed analysis, commentary from our Chief Analyst, including actionable insights, trade timing, and direction forecasts for gold and silver.
Stay ahead of the market — join our premium community today.