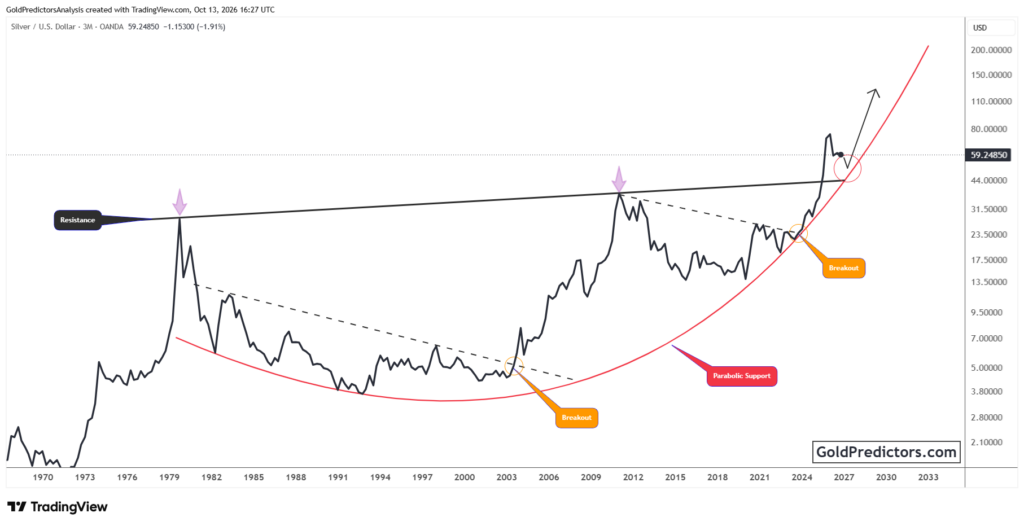


Gold Price Forecast: Rate Concerns Persist Ahead of Fed Decision
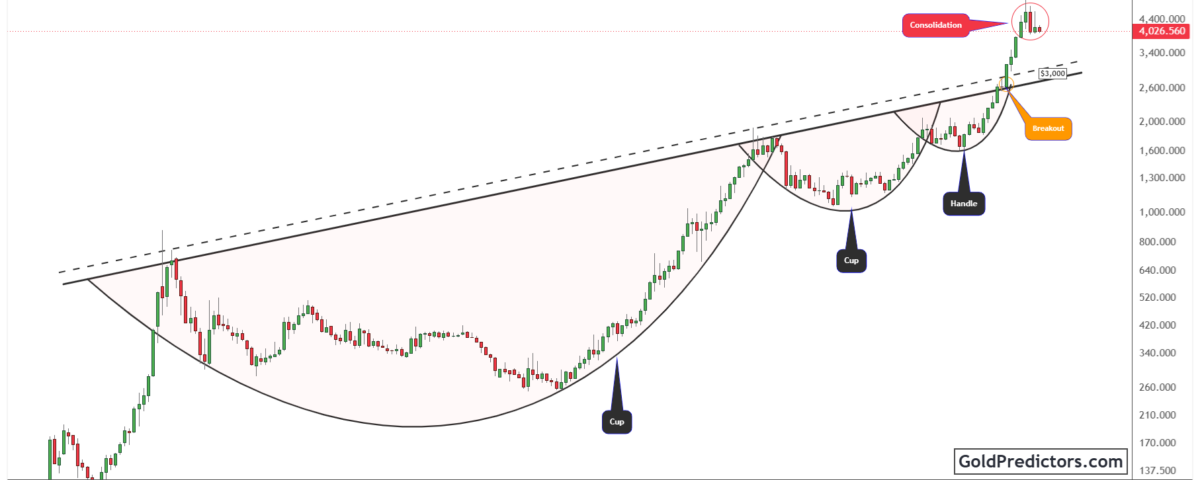
Gold (XAU/USD) remains near $4,000 after a sharp correction from its recent highs. The decline has weakened momentum, but price still holds well above its former long-term resistance line. The Fed decision and upcoming US inflation data could shape its next move. Concerns about further rate increases may limit any recovery. Meanwhile, the gold-to-S&P 500 ratio has fallen from major resistance. Its next move could help show whether gold regains strength against US stocks.
Gold Market Outlook: Fed Guidance Could Shape the Next Move
Gold is holding near $4,000 on October 27 as attention turns to the Fed decision on October 28. The US Dollar Index rose 0.3% toward a nearly two-week high, making gold more expensive in other currencies. The Fed is widely expected to leave interest rates unchanged. However, a pause may offer limited relief if officials keep further increases under consideration. Gold pays no interest, so expectations of higher rates can reduce its appeal.
Persistent inflation remains central to that outlook. Higher fuel prices can raise transport and production costs, making other goods more expensive. That could keep pressure on the Fed to consider another increase. The September PCE inflation report is due on October 29, alongside the first estimate of third-quarter US GDP. These releases will provide evidence on price pressure and economic growth. Lower inflation could ease concerns about more rate increases and help gold stabilize. Higher inflation could keep those concerns alive and put more pressure on gold.
Gold Technical Analysis: A Recovery above $4,000 Could Signal Stability
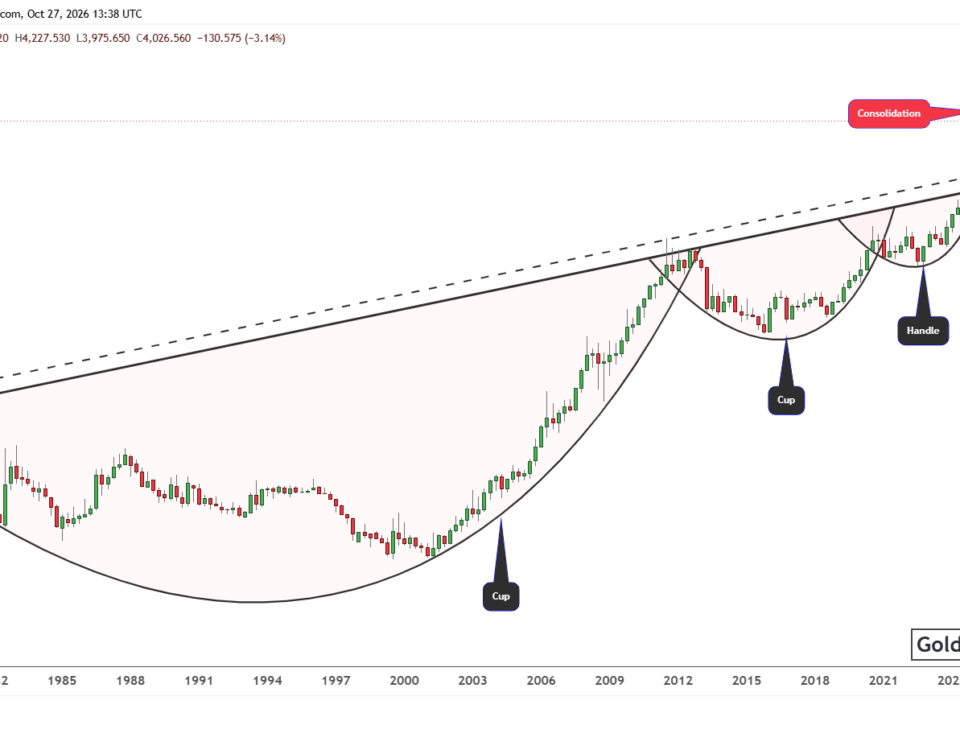
The gold chart below shows large rounded bases and a cup-and-handle pattern beneath a rising resistance line. Gold rose sharply after moving above this line and is now consolidating. The former resistance line near $3,000 could now act as long-term support. Gold remains well above it, suggesting that the recent decline may still be a correction within the long-term uptrend.
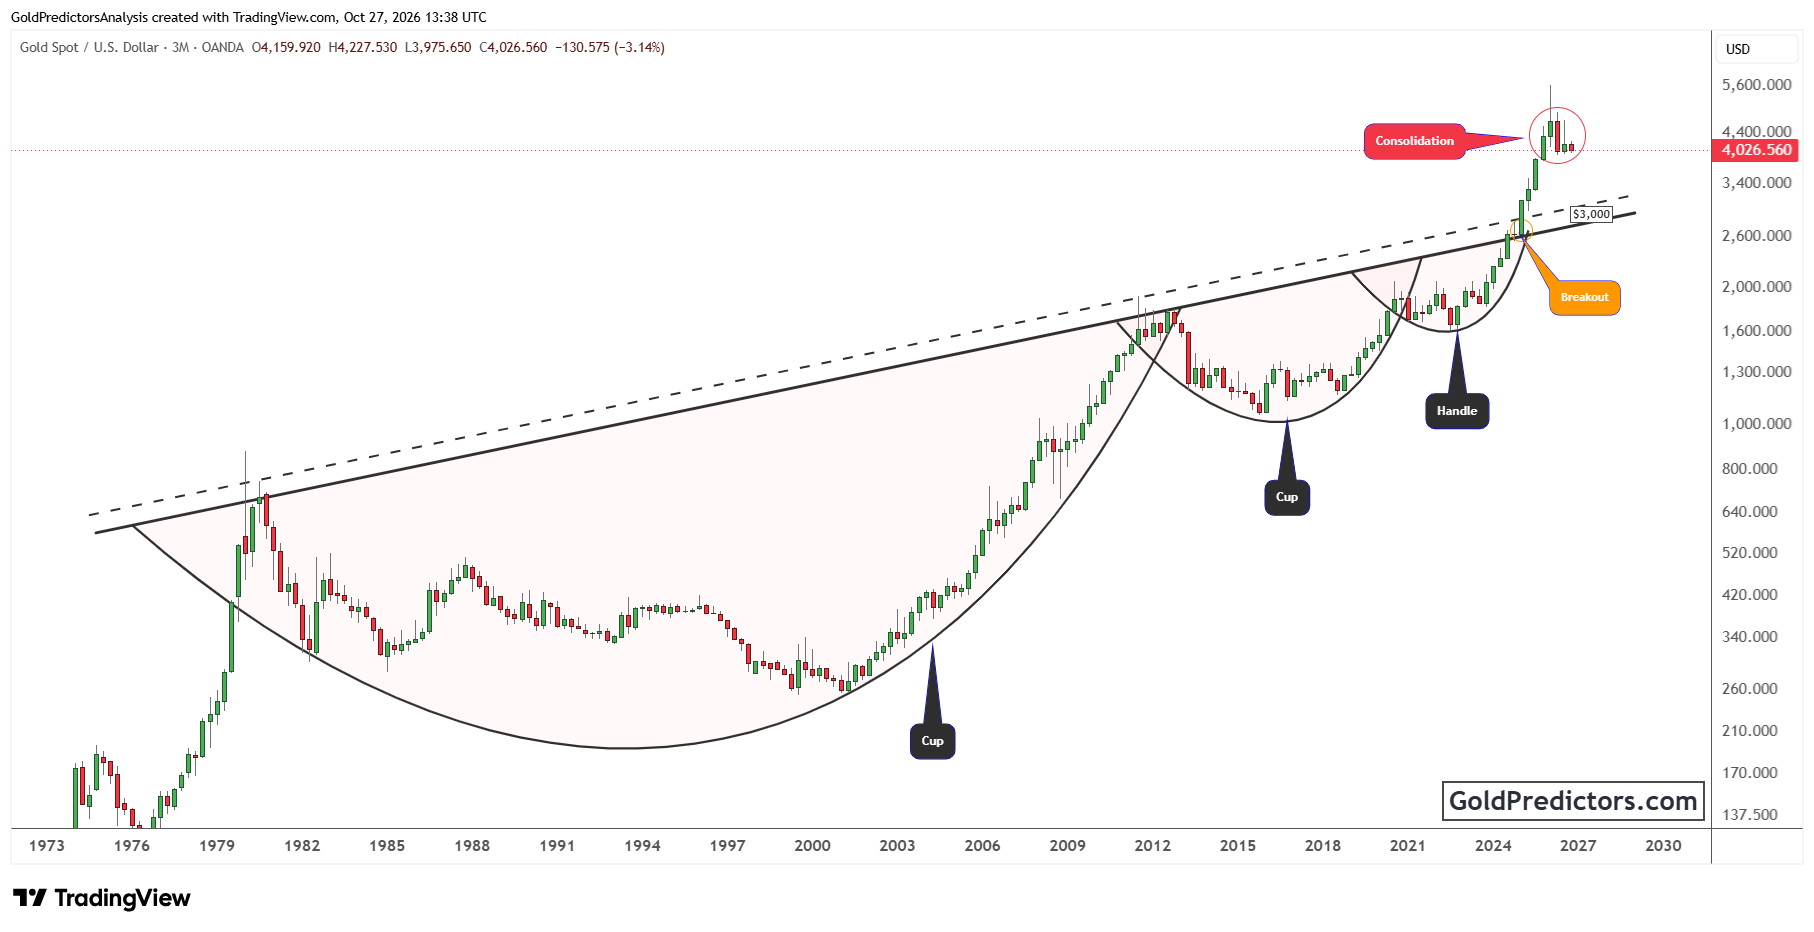
Gold is now trading near $4,000 level. The current quarterly candle has a low near $3,975 and a high near $4,227. This makes $4,000 an important level to watch. If gold holds above it, this would suggest that the price is stabilizing. A rise above $4,228 would provide stronger evidence that the correction is easing.
If gold falls below $3,975 and stays there, the decline could continue. The trendline near $3,000 remains a key long-term support level, well below the current price. Holding above this line would support the long-term uptrend. A lasting move below it would weaken the long-term breakout and raise the risk of further losses.
Gold-to-S&P 500 Ratio Holds Above 0.45 after Rejection at Resistance
The chart below shows the gold-to-S&P 500 ratio. It stands near 0.524 after falling from the upper boundary of a symmetrical triangle that has formed over several decades. The descending resistance line has capped several major peaks. The latest rejection shows that gold has lost ground against the S&P 500. A move back toward the upper boundary would suggest that gold is regaining strength against stocks.
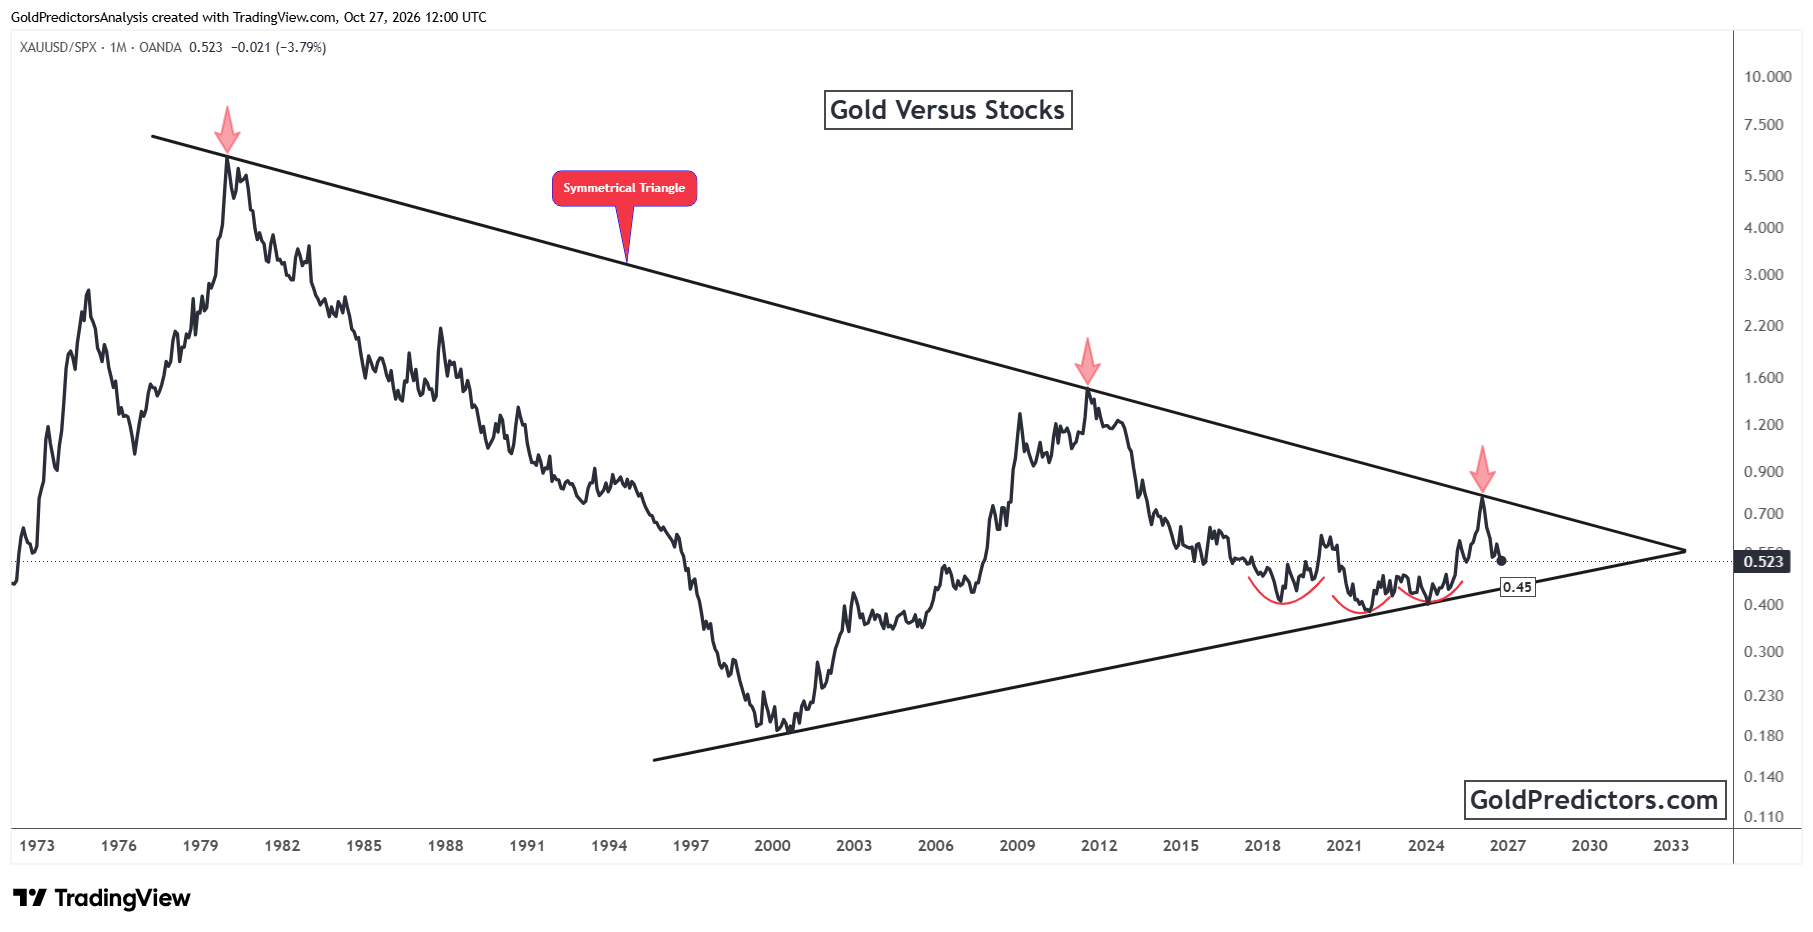
The rising lower boundary near 0.45 is the main support level to watch. The ratio has found support near this line several times before rising. If the ratio holds above this support and rises, gold would outperform the S&P 500 through larger gains or smaller declines. If it falls below 0.45 and stays there, this support would weaken.
The upper triangle boundary marks the main resistance. A move above this line would suggest that the ratio is gaining strength. Holding above it would support the case for gold to outperform the S&P 500 over time. If the ratio declines from this boundary, gold would lose ground against stocks.
Gold Price Outlook: A Softer Fed Message Could Help Gold Stabilize
Gold’s outlook depends on whether the price stabilizes near $4,000 and the gold-to-S&P 500 ratio holds above 0.45. The Fed’s comments on inflation could shape that move, especially while energy costs remain high. Gold still holds well above long-term support near $3,000, leaving room for the uptrend to continue. The gold-to-S&P 500 ratio has key support near 0.45. A turn higher in the ratio would show that gold is gaining strength against US stocks.
Gold Predictors Premium Membership
Get exclusive short-term and swing trade ideas with precise entry levels, stop-loss, and target prices, including justification and analysis — all delivered directly via WhatsApp.
Our premium service includes deep technical analysis on gold and silver markets. We cover cycle analysis, price forecasting, and key timing levels.
Members also receive a weekly market letter with detailed analysis, commentary from our Chief Analyst, including actionable insights, trade timing, and direction forecasts for gold and silver.
Stay ahead of the market — join our premium community today.