

Silver vs Copper: Can Silver Regain Strength against Copper?
Silver (XAG/USD) remains technically strong as price holds above the former $40–$50 resistance zone following the major ascending triangle breakout. The move above this area marked an important shift in the price structure. Silver has since turned lower, but the larger breakout remains intact. Meanwhile, the silver-to-copper ratio has turned higher from its former resistance trendline, showing renewed silver strength relative to copper. Holding above these important support areas could keep the technical outlook positive and support further gains.
Silver Technical Analysis: Holding $40–$50 Could Keep the Breakout Intact
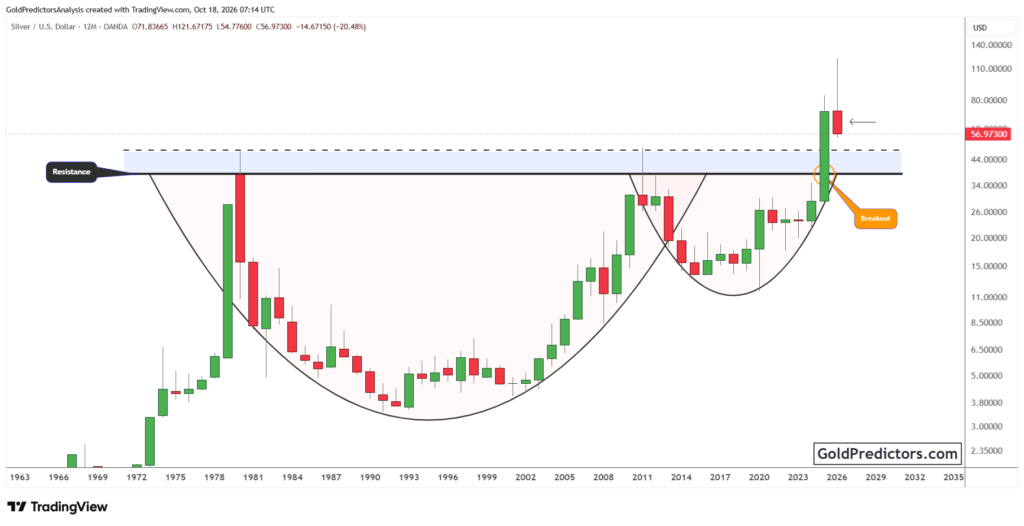
The silver chart below shows a large ascending triangle, with horizontal resistance spanning the $40–$50 region. Price tested this resistance several times but failed to establish a clear break. Meanwhile, a rising trendline provided support from below and helped shape the pattern. Each major advance brought price back toward the horizontal resistance. This structure showed that silver was gradually building strength below an important resistance zone.
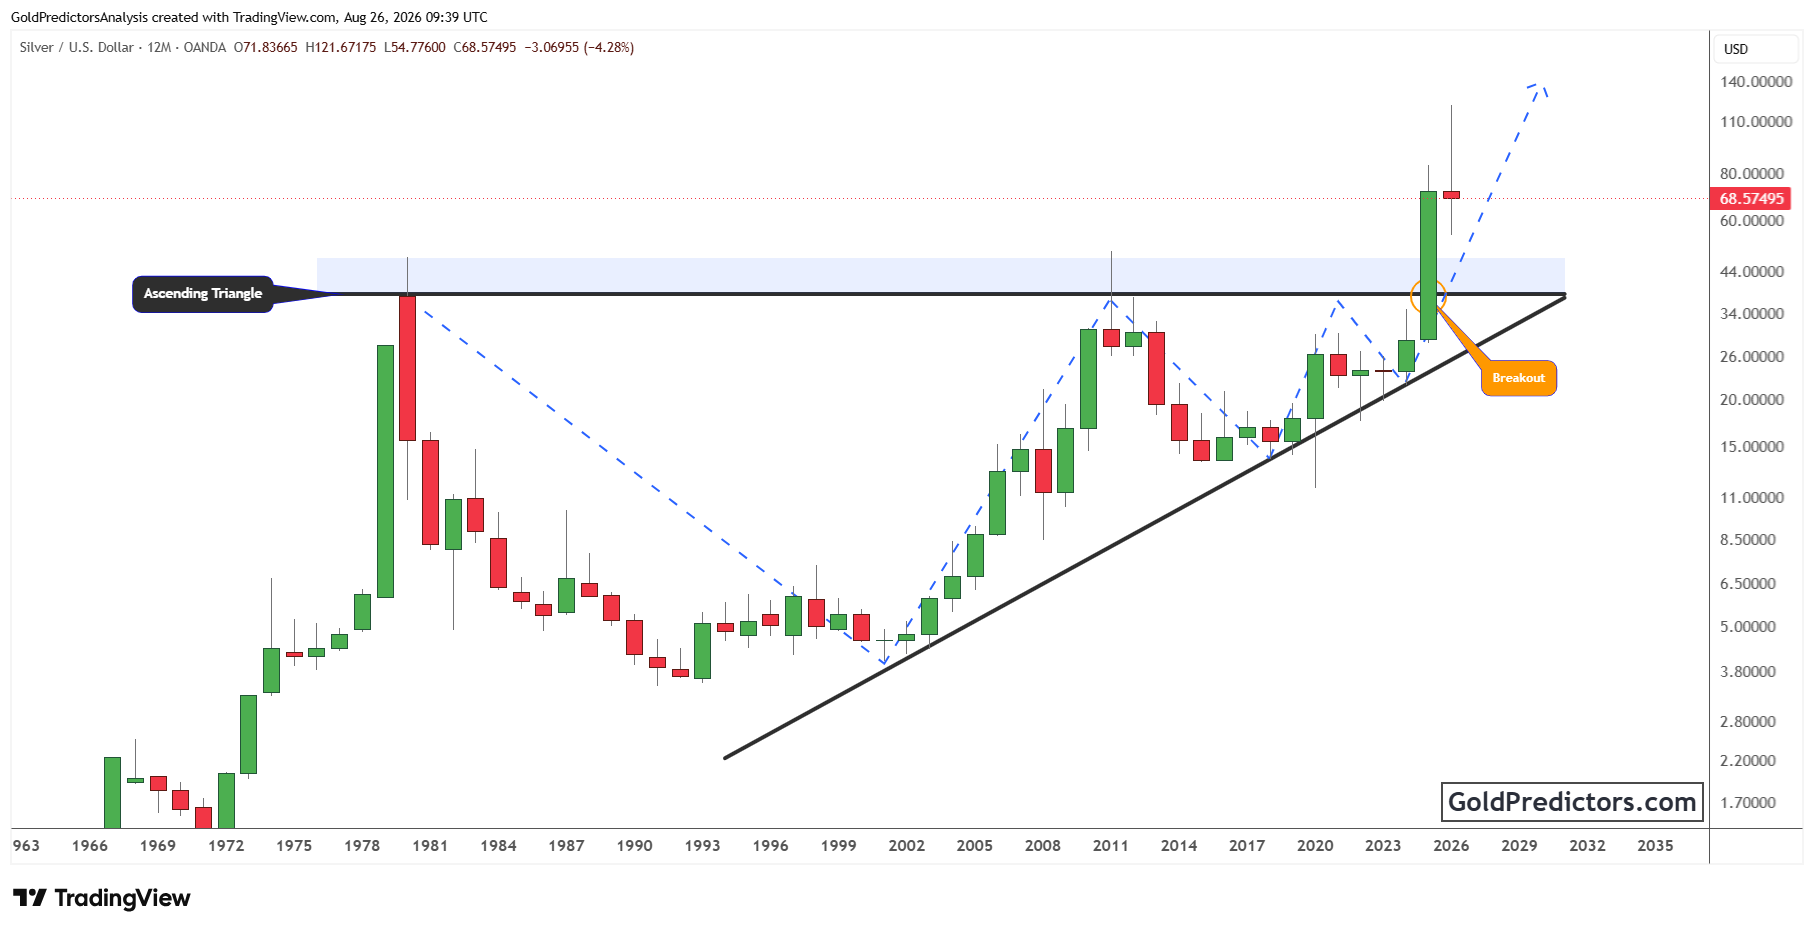
Silver eventually moved above the horizontal resistance and completed the ascending triangle pattern. The breakout led to a strong advance and carried price well beyond the former resistance zone. Silver later climbed above $100 before turning lower. Despite the decline, price continues to hold above the broken resistance area, keeping the larger breakout structure intact. The former $40–$50 resistance zone could now provide important support if weakness continues.
The ascending triangle also provides a strong framework for the longer-term outlook. The depth of the formation suggests that silver could have significant room to extend its advance if the breakout remains intact. However, price may experience periods of consolidation following the strong rise. Staying above the former triangle resistance would keep the technical structure positive. A fresh advance from this area could open the way for further gains, while a move below the broken resistance would weaken the outlook and increase the risk of a deeper decline.
Silver vs Copper Analysis: Ratio Rebounds as Former Resistance Turns into Support
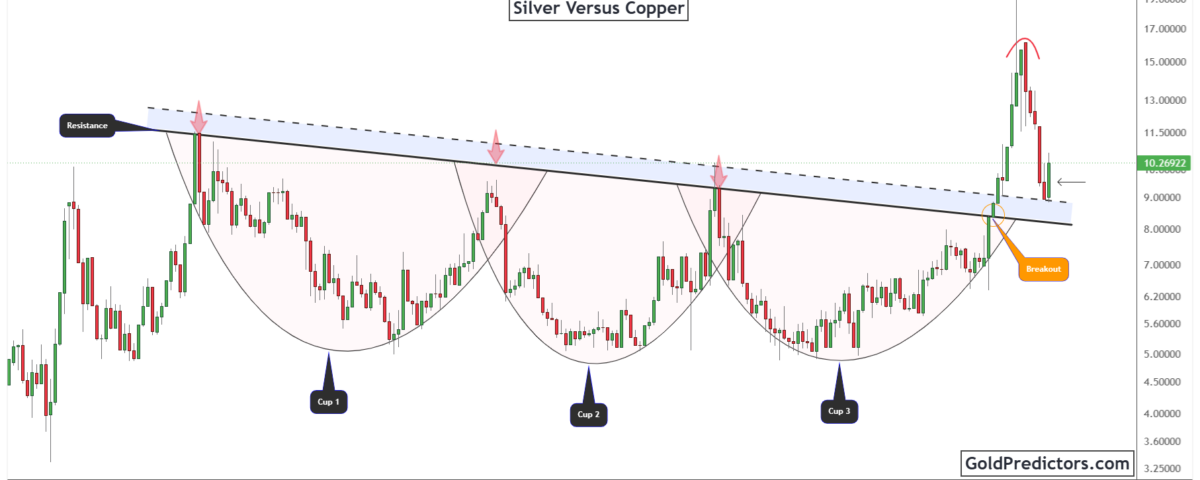
The chart below shows the silver-versus-copper ratio forming a series of large rounded bases below a major resistance trendline. The ratio remained below this resistance while the three formations gradually developed at lower levels. Each rounded base formed after the ratio declined from the resistance area and established support. These repeated formations showed a gradual shift in the underlying structure. The resistance trendline remained the main barrier throughout this process.
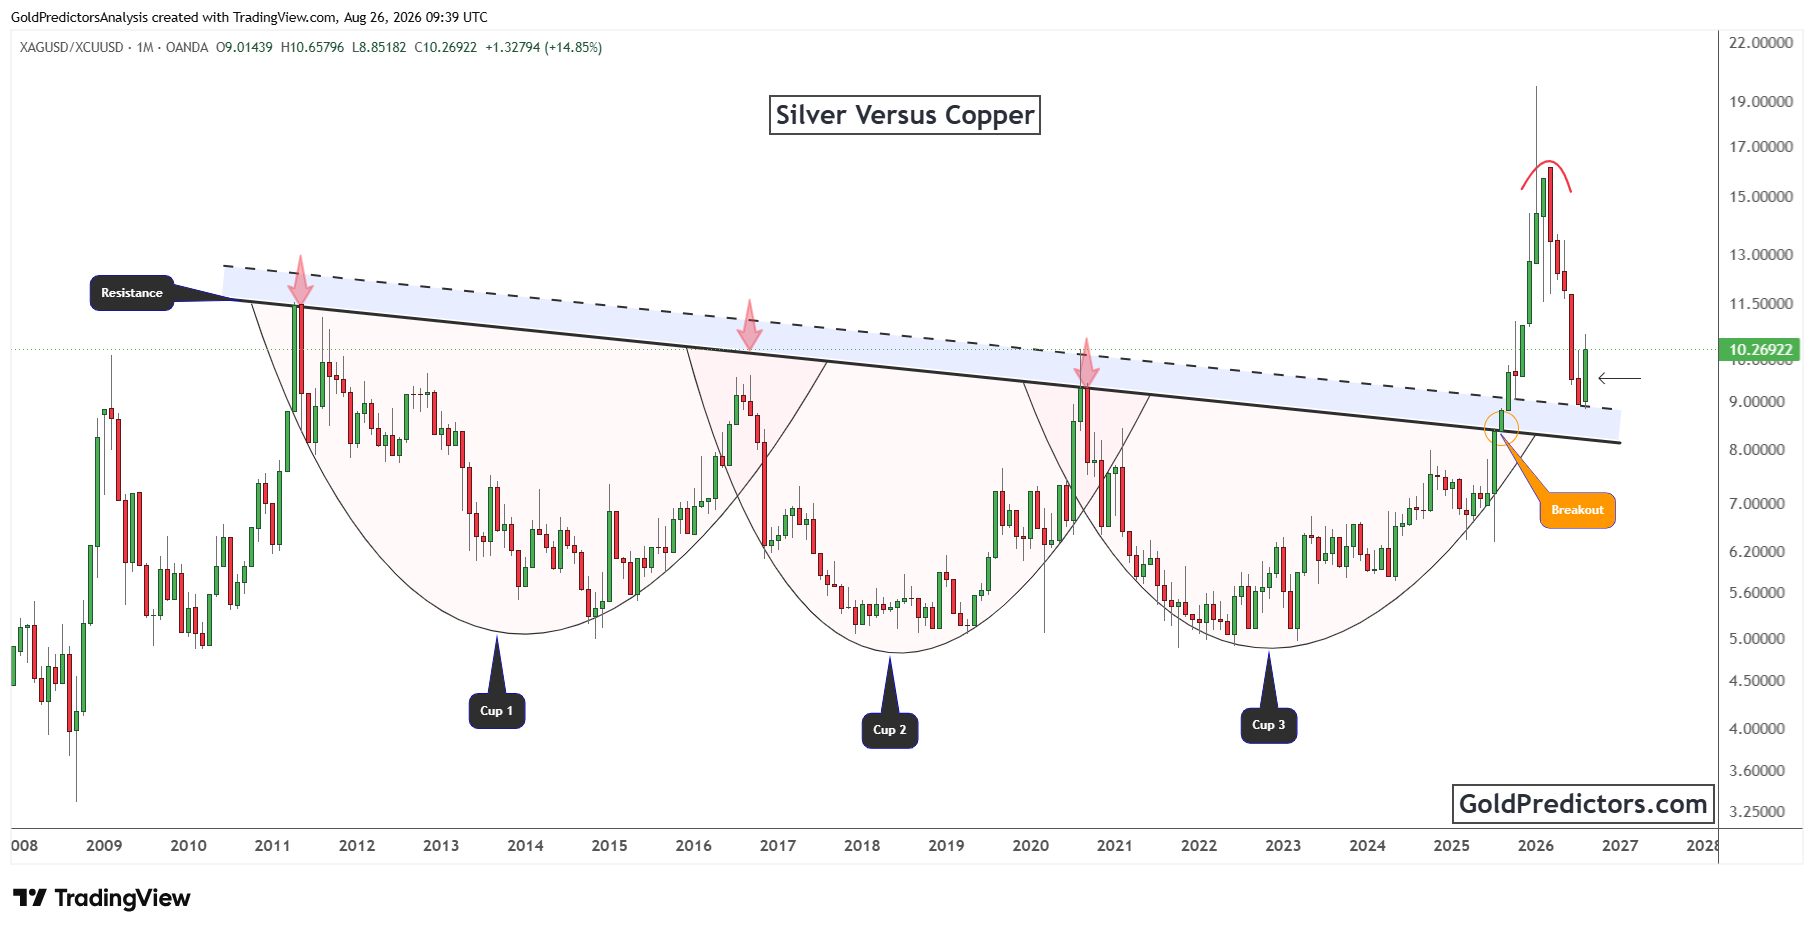
The ratio eventually broke above the resistance trendline and accelerated higher, confirming stronger silver performance relative to copper. The advance gained strength after the breakout and carried the ratio toward the 16 region. The ratio later turned lower as copper began to outperform silver. This decline brought the ratio back toward the former resistance area. However, it has remained above the broken trendline, which could now provide important support.
The ratio has now rebounded from the former resistance area, showing that this region is providing support. Further gains would indicate that silver is again outperforming copper on a relative basis. A continued advance could bring the recent upper region back into focus, while another decline toward the former resistance trendline would place this support area under renewed pressure. A break below the trendline would weaken the breakout structure and could signal stronger copper performance relative to silver.
Silver vs Copper Outlook: Could Silver Extend Its Rebound Against Copper?
Silver maintains a strong technical structure as price remains above the former $40–$50 resistance zone. The major ascending triangle breakout continues to support the overall outlook despite the recent decline. The former resistance area could now act as important support if weakness extends. Holding above this zone would keep the larger breakout intact and maintain the positive technical structure.
At the same time, the silver-to-copper ratio has turned higher from its former resistance trendline. This reaction shows renewed silver strength relative to copper after the earlier decline. Holding above the broken trendline keeps the ratio breakout intact and could support further silver outperformance.
These developments continue to support a positive technical outlook for silver. Holding above the former $40–$50 resistance zone and continued strength in the silver-to-copper ratio could support another advance. A break below these key support areas would weaken the larger technical structure and increase the risk of further declines.
Gold Predictors Premium Membership
Get exclusive short-term and swing trade ideas with precise entry levels, stop-loss, and target prices, including justification and analysis — all delivered directly via WhatsApp.
Our premium service includes deep technical analysis on gold and silver markets. We cover cycle analysis, price forecasting, and key timing levels.
Members also receive a weekly market letter with detailed analysis, commentary from our Chief Analyst, including actionable insights, trade timing, and direction forecasts for gold and silver.
Stay ahead of the market — join our premium community today.