


Gold Price Forecast: XAUUSD Pullback Deepens as Silver Gains Strength
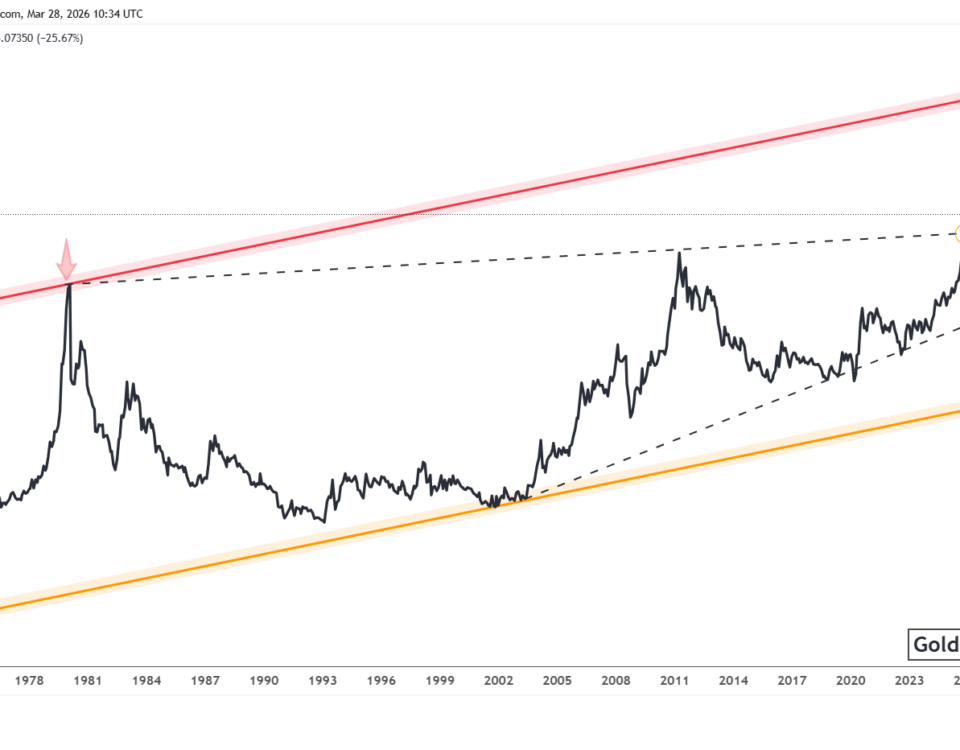
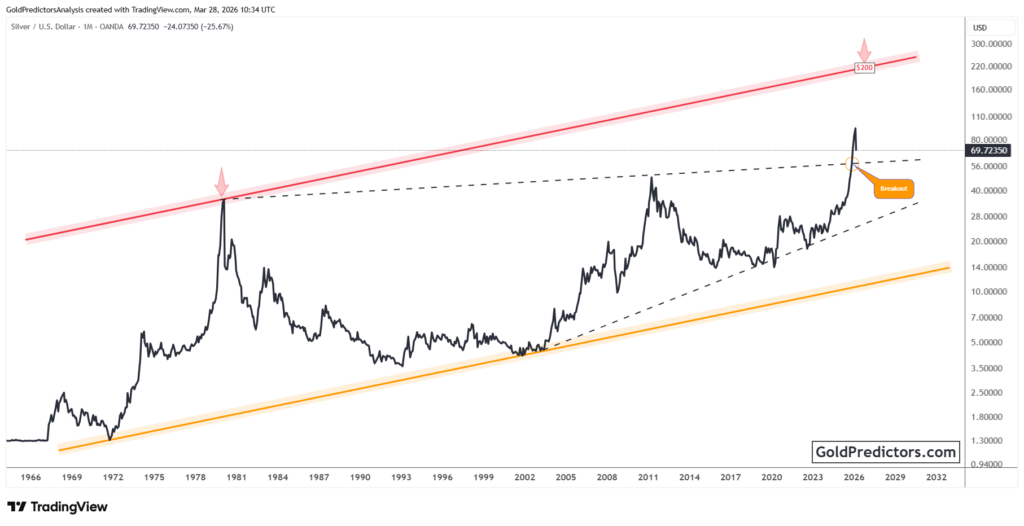
Gold (XAUUSD) continues to hold a positive long-term technical structure despite a pullback from recent highs. Following a sharp rise to new highs, price has entered a corrective phase within its broader upward trend. The long-term trend continues to follow a rising parabolic structure, while recent price action reflects a corrective pullback from record highs. At the same time, the gold-to-silver ratio is trending lower, pointing to improving relative strength in silver. While gold remains in a corrective phase, the declining Gold-to-Silver ratio highlights growing strength in silver and a supportive environment for precious metals.
Gold Technical Analysis: XAUUSD Pullback Tests Long-Term Breakout Structure
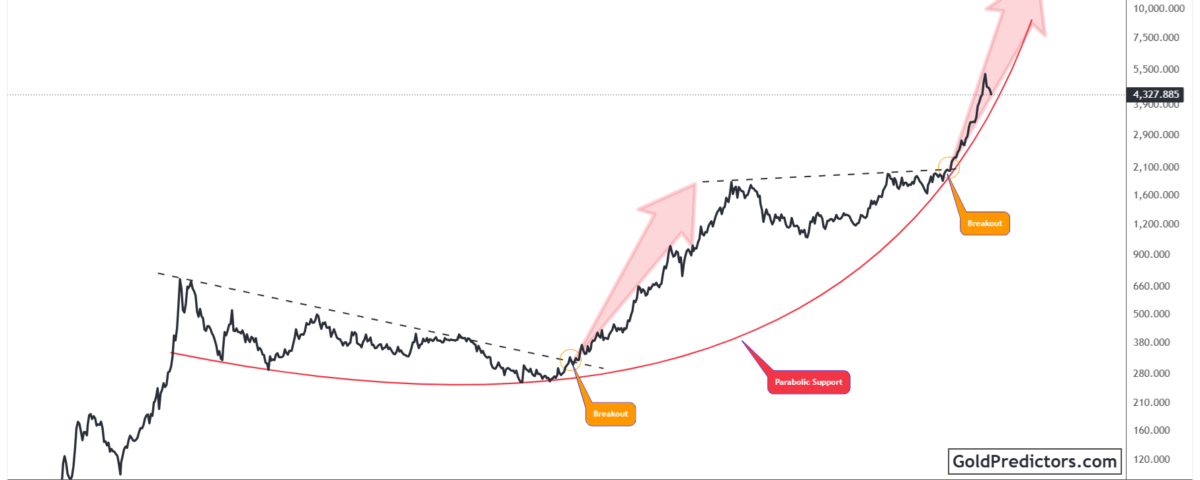
The gold chart below shows multiple breakout phases that have defined the long-term uptrend. Price remained compressed during consolidation periods before each breakout triggered a strong advance. The early 2000s breakout marked a structural change in direction. It signaled the start of a sustained bullish phase. Price then advanced steadily and established a strong upward path.
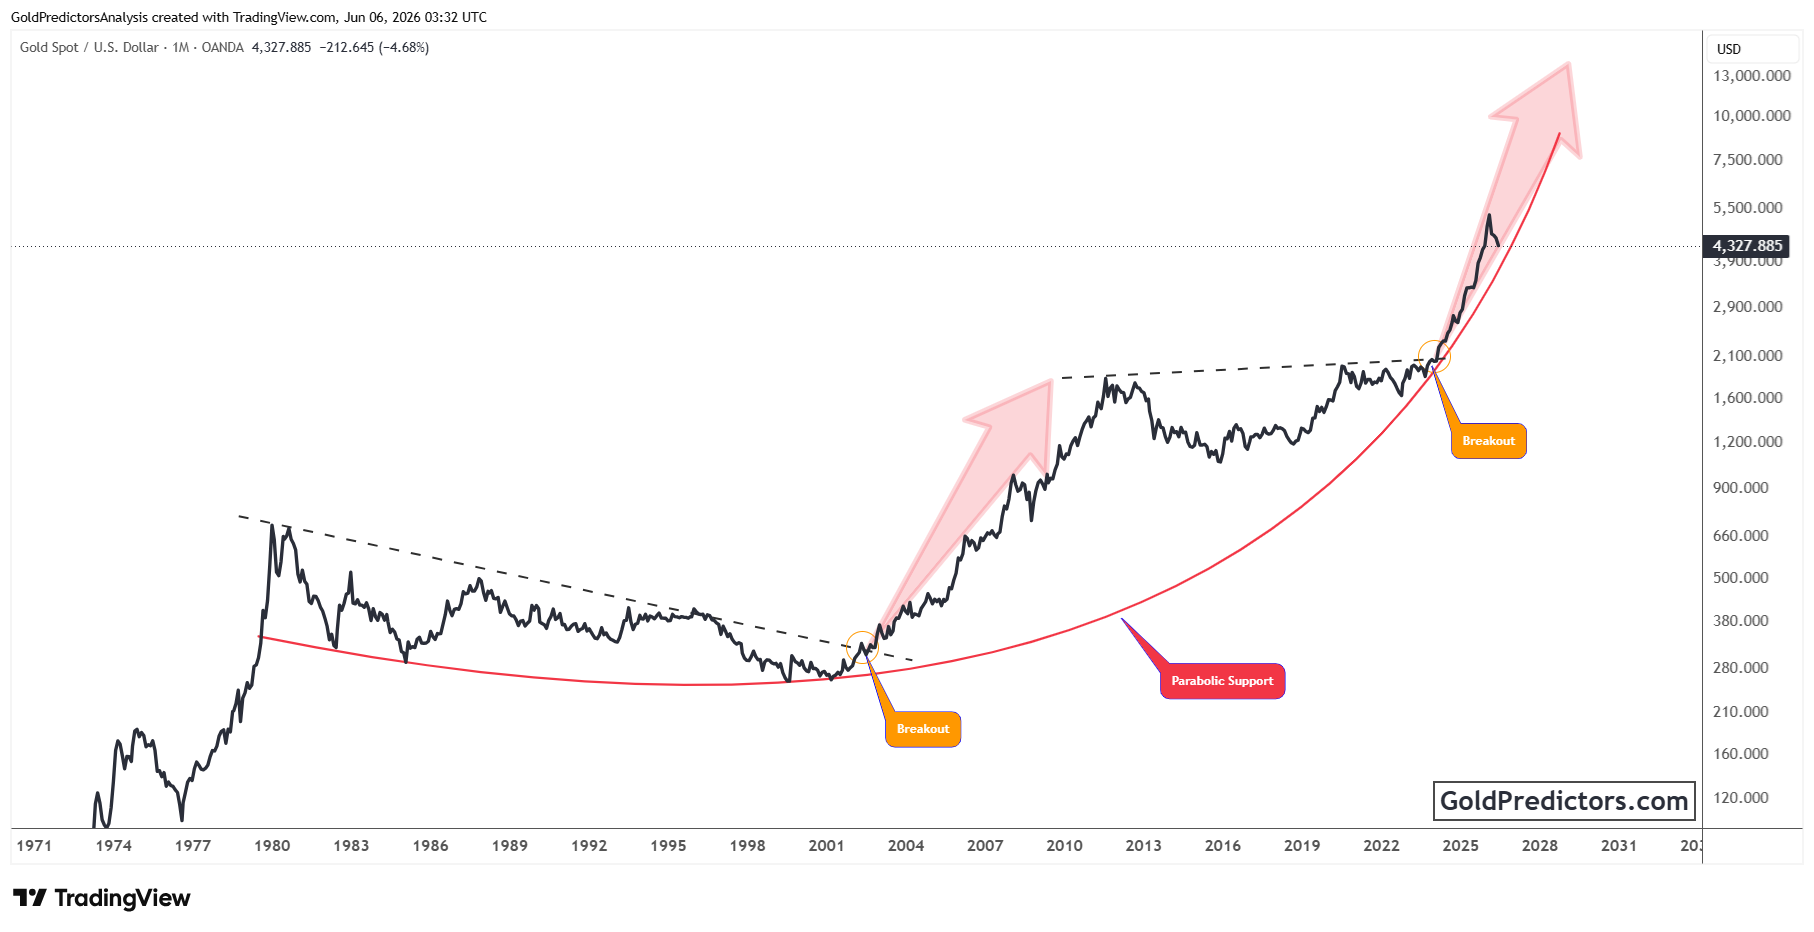
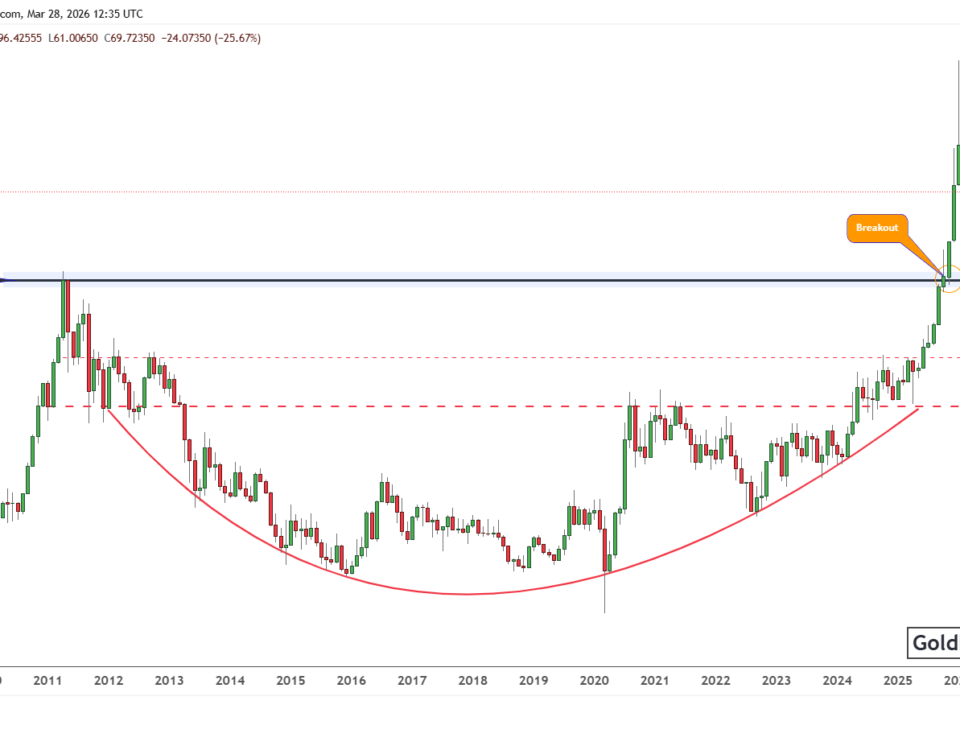
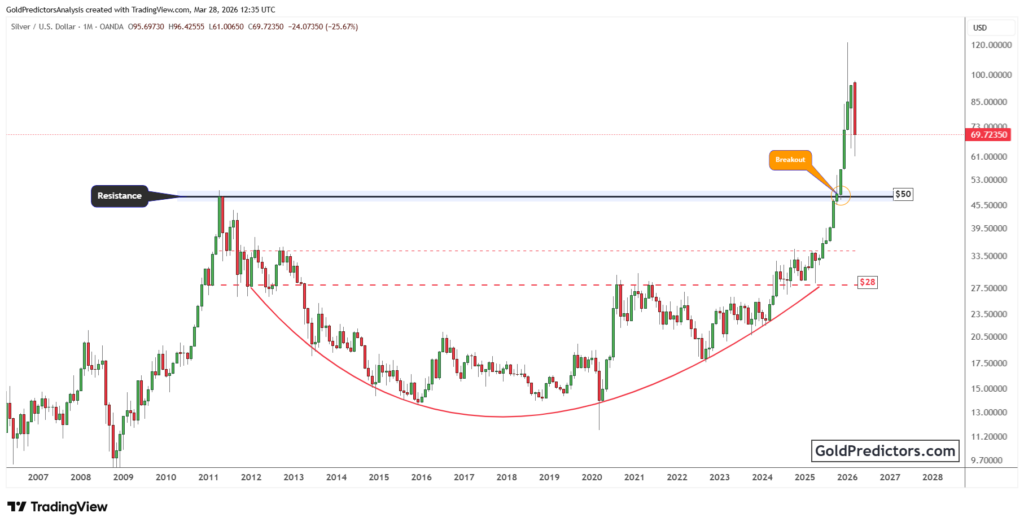
Gold later entered a broad consolidation between 2011 and 2024. Price moved sideways and formed a well-defined range. This phase allowed a strong base to develop over time. The lower boundary held firm during declines, while the upper boundary limited advances. Once price approached the breakout zone again, momentum began to build and pressure increased near resistance.
The recent breakout above this range triggered a sharp acceleration and pushed gold to record highs. Price has since pulled back from its peak and entered a corrective phase within a rising parabolic structure. The retracement reflects a period of consolidation following the powerful advance, as the market absorbs recent gains.
Gold-to-Silver Ratio Breakdown Signals Stronger Silver Price Momentum
The chart below shows the Gold-to-Silver ratio breaking below a long-term ascending trendline that had guided the advance for several years. The ratio repeatedly respected this trendline during previous pullbacks, making it an important technical reference level. The recent decline pushed the ratio below this key support area, indicating a shift in relative strength from gold to silver.
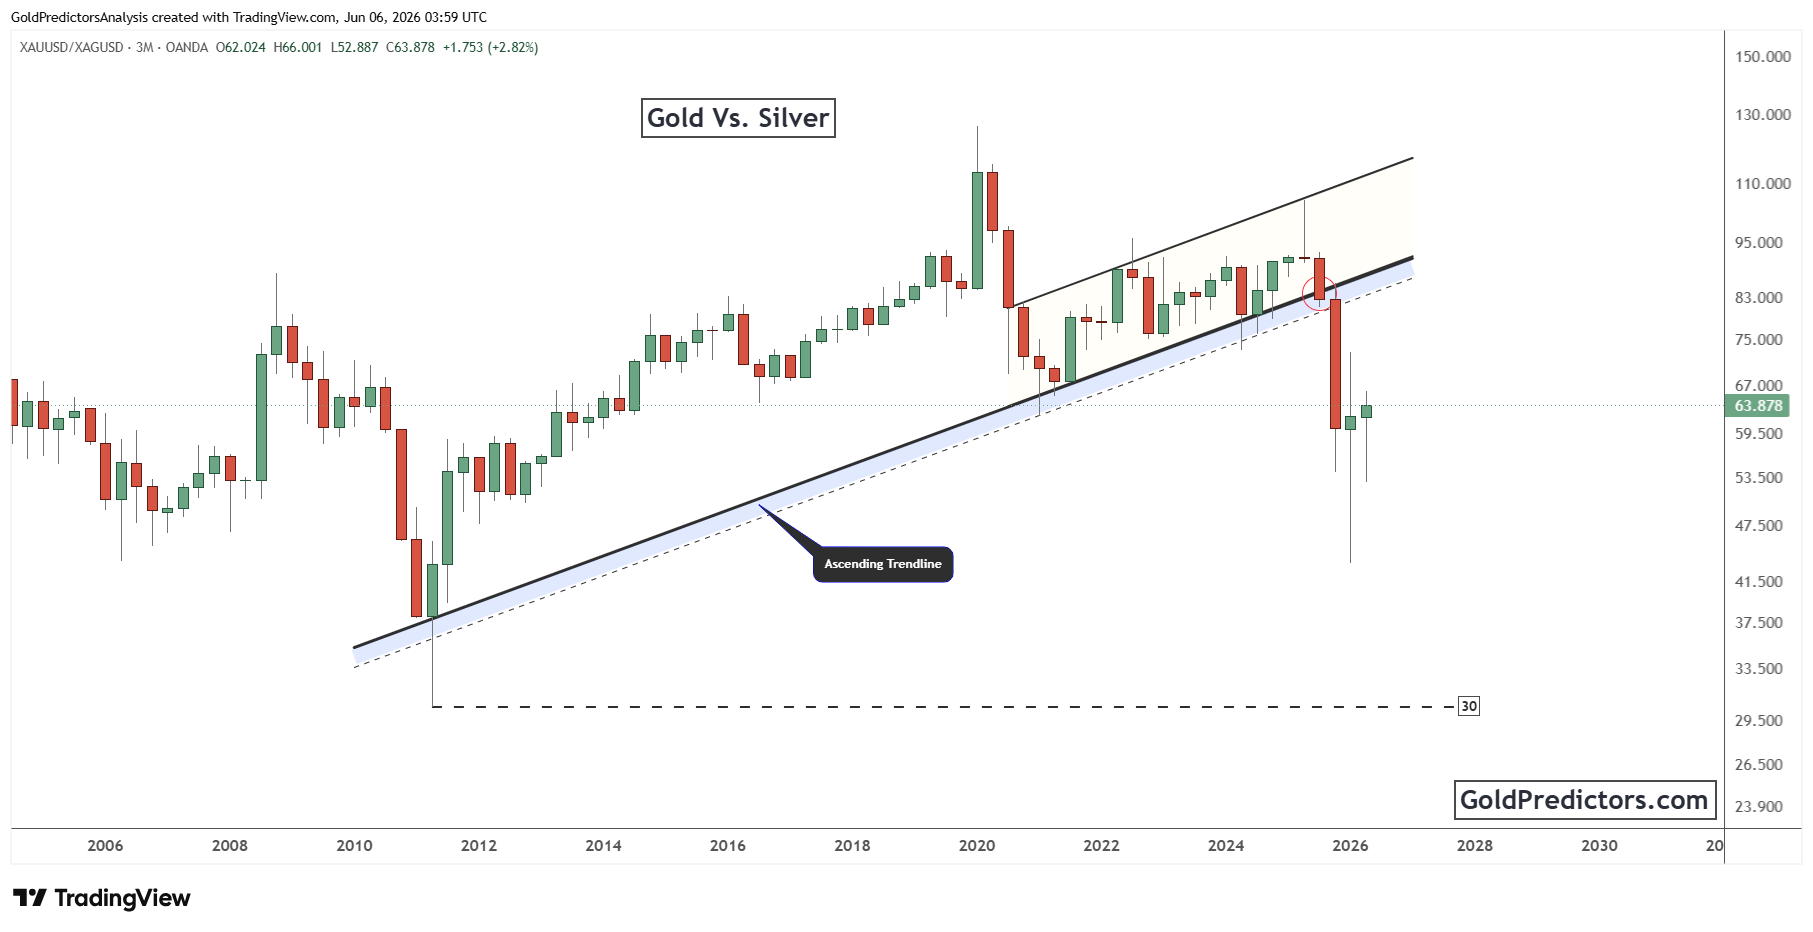
Following the breakdown, the ratio accelerated lower and moved back toward the mid-60s. This sharp decline indicates that silver has started to outperform gold after an extended period of underperformance. The breakdown below the rising trendline signals that the ratio has entered a weaker phase after several years of upward movement. The ratio now trades well below the broken trendline, highlighting the extent of the recent weakness.
The broader technical picture points to increasing relative strength in silver. The breakdown from the rising trendline has shifted momentum from gold to silver. As long as the ratio remains below the former trendline support, the current weakness may continue. A sustained move lower could open the door for a decline toward longer-term support levels. However, a recovery back above the broken trendline would be needed to improve the outlook for the ratio.
Please note that the rebound in the gold-to-silver ratio appears to be short-term, but the overall picture remains negative for the ratio.
Gold and Silver Outlook: Correction May Create a New Buying Opportunity
Gold remains in a corrective phase after a powerful breakout from a multi-year consolidation range. Despite the pullback from recent highs, the price continues to trade within a rising parabolic structure that emerged after the breakout. The current correction follows a strong advance and reflects a period of consolidation within the broader trend.
At the same time, the Gold-to-Silver ratio has turned lower after breaking below a long-term rising trendline. This shift indicates improving relative strength in silver and suggests that silver is beginning to outperform gold after several years of lagging performance. The decline in the ratio highlights a change in leadership within the precious metals sector.
Overall, gold remains in a corrective phase following its breakout from a multi-year consolidation range. Despite the pullback from recent highs, the long-term price structure remains intact. In the short term, gold and silver are likely to correct lower to complete their correction. The gold-to-silver ratio is also rebounding from the support zone. This correction in both metals will create strong buying opportunities.
Gold Predictors Premium Membership
Get exclusive short-term and swing trade ideas with precise entry levels, stop-loss, and target prices, including justification and analysis — all delivered directly via WhatsApp.
Our premium service includes deep technical analysis on gold and silver markets. We cover cycle analysis, price forecasting, and key timing levels.
Members also receive a weekly market letter with detailed analysis, commentary from our Chief Analyst, including actionable insights, trade timing, and direction forecasts for gold and silver.
Stay ahead of the market — join our premium community today.