


Gold Price Outlook: Long-Term Strength and Leadership Rotation Support Higher Prices
Gold (XAUUSD) continues to trade within a rising long-term structure after clearing multiple breakout phases. Price remains contained inside a well-defined ascending channel that has guided the trend for more than two decades. Each breakout shifted gold into a higher range and held above prior ceilings. Momentum remains constructive despite the sharp advance. At the same time, intermarket analysis shows gold beginning to outperform growth equities after a multi-year period of lagging performance. This combination of structural strength and improving relative momentum frames gold as a leading asset within the current technical landscape.
Gold Holds Long-Term Rising Channel After Successive Breakouts
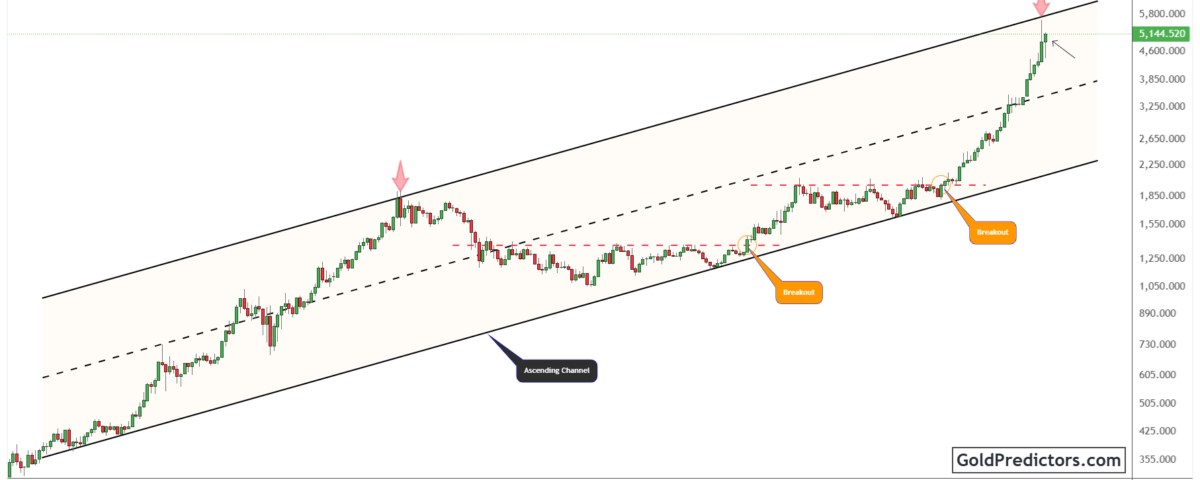
The gold chart below shows price moving within a well-defined ascending channel that has guided the long-term trend since the early 2000s. Price consistently respected both channel boundaries across multiple cycles. Pullbacks held near the lower boundary, while advances rotated toward the upper band. This structure points to sustained accumulation within a rising long-term framework.
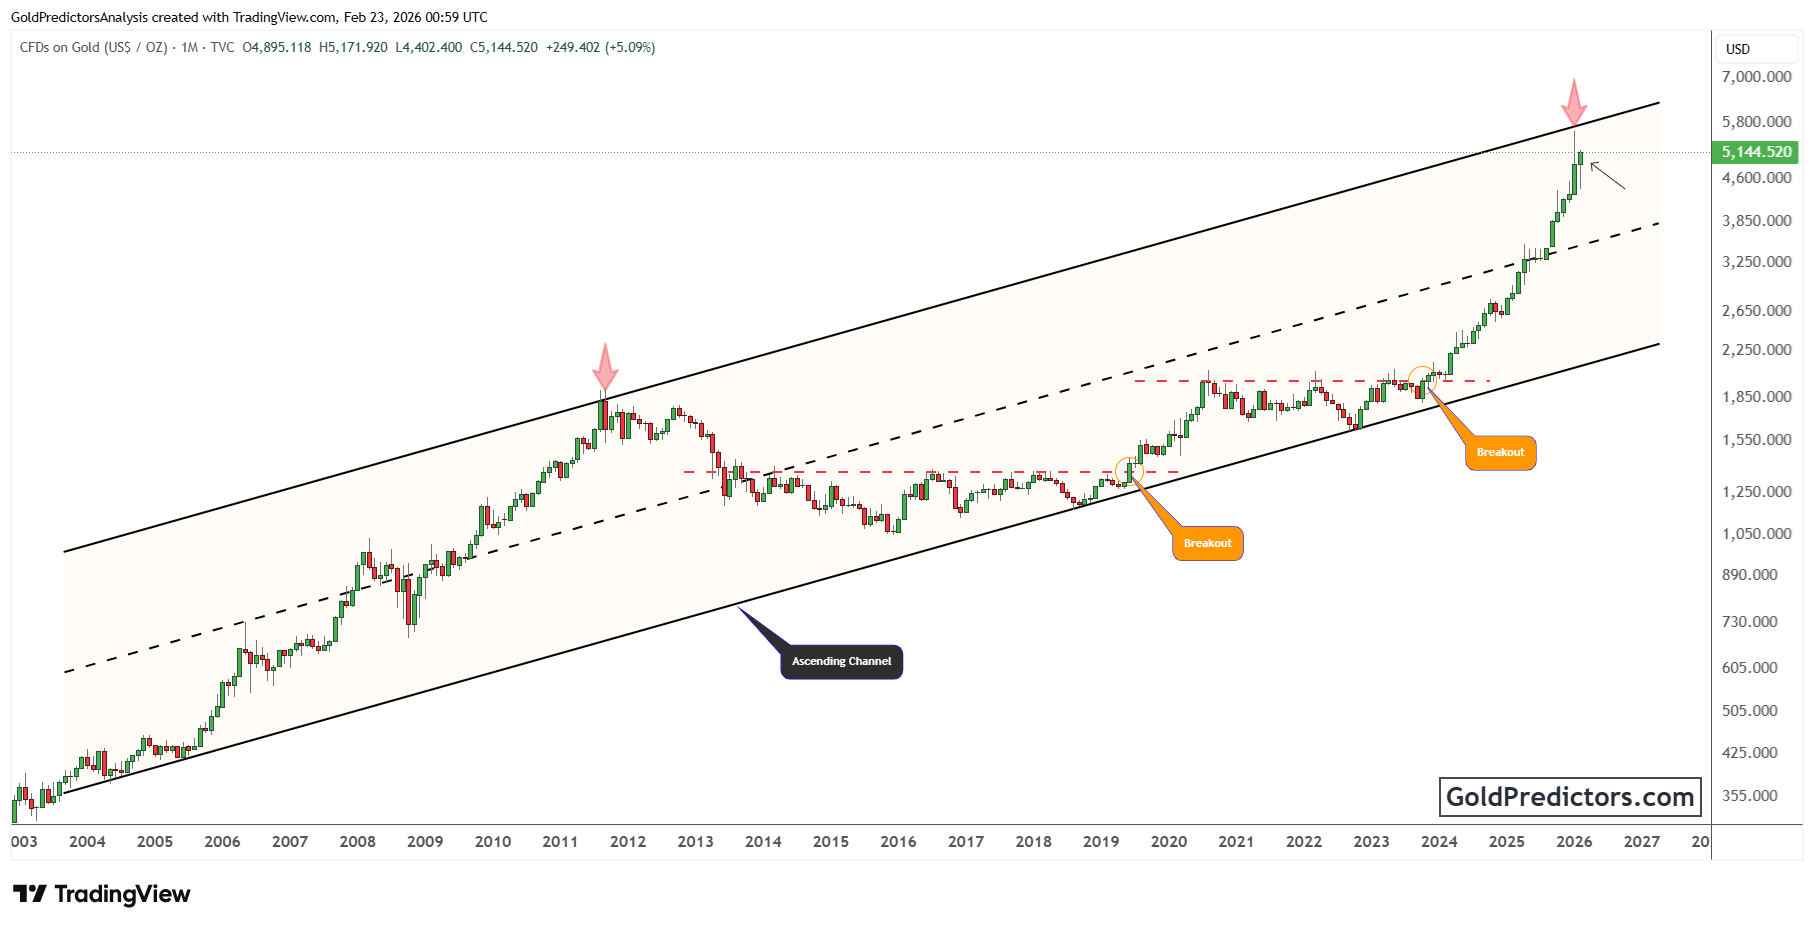
The chart highlights two key breakout phases within the channel. The first breakout shifted the price into a higher range after a prolonged consolidation. Gold then spent several years stabilizing while holding above former resistance. The second breakout showed stronger momentum, with the price accelerating from channel support and advancing rapidly into the upper portion of the structure.
Recent price action has carried gold close to the channel’s upper boundary after a rapid advance. Limited candle overlap points to steady trend continuity. Short-term pauses or shallow pullbacks remain possible after the sharp move. As long as price holds above former breakout zones and remains within the channel, the broader technical structure continues to favor higher levels over time.
Gold Outperforms Growth Equities as Ratio Breaks Higher
The chart below shows a monthly comparison between gold and Palantir Technologies, highlighting relative strength between hard assets and a growth-focused technology stock. The ratio trended lower from 2021 through 2025, a period marked by sustained leadership from growth equities. This phase reflected persistent outperformance by high-beta stocks while gold lagged.
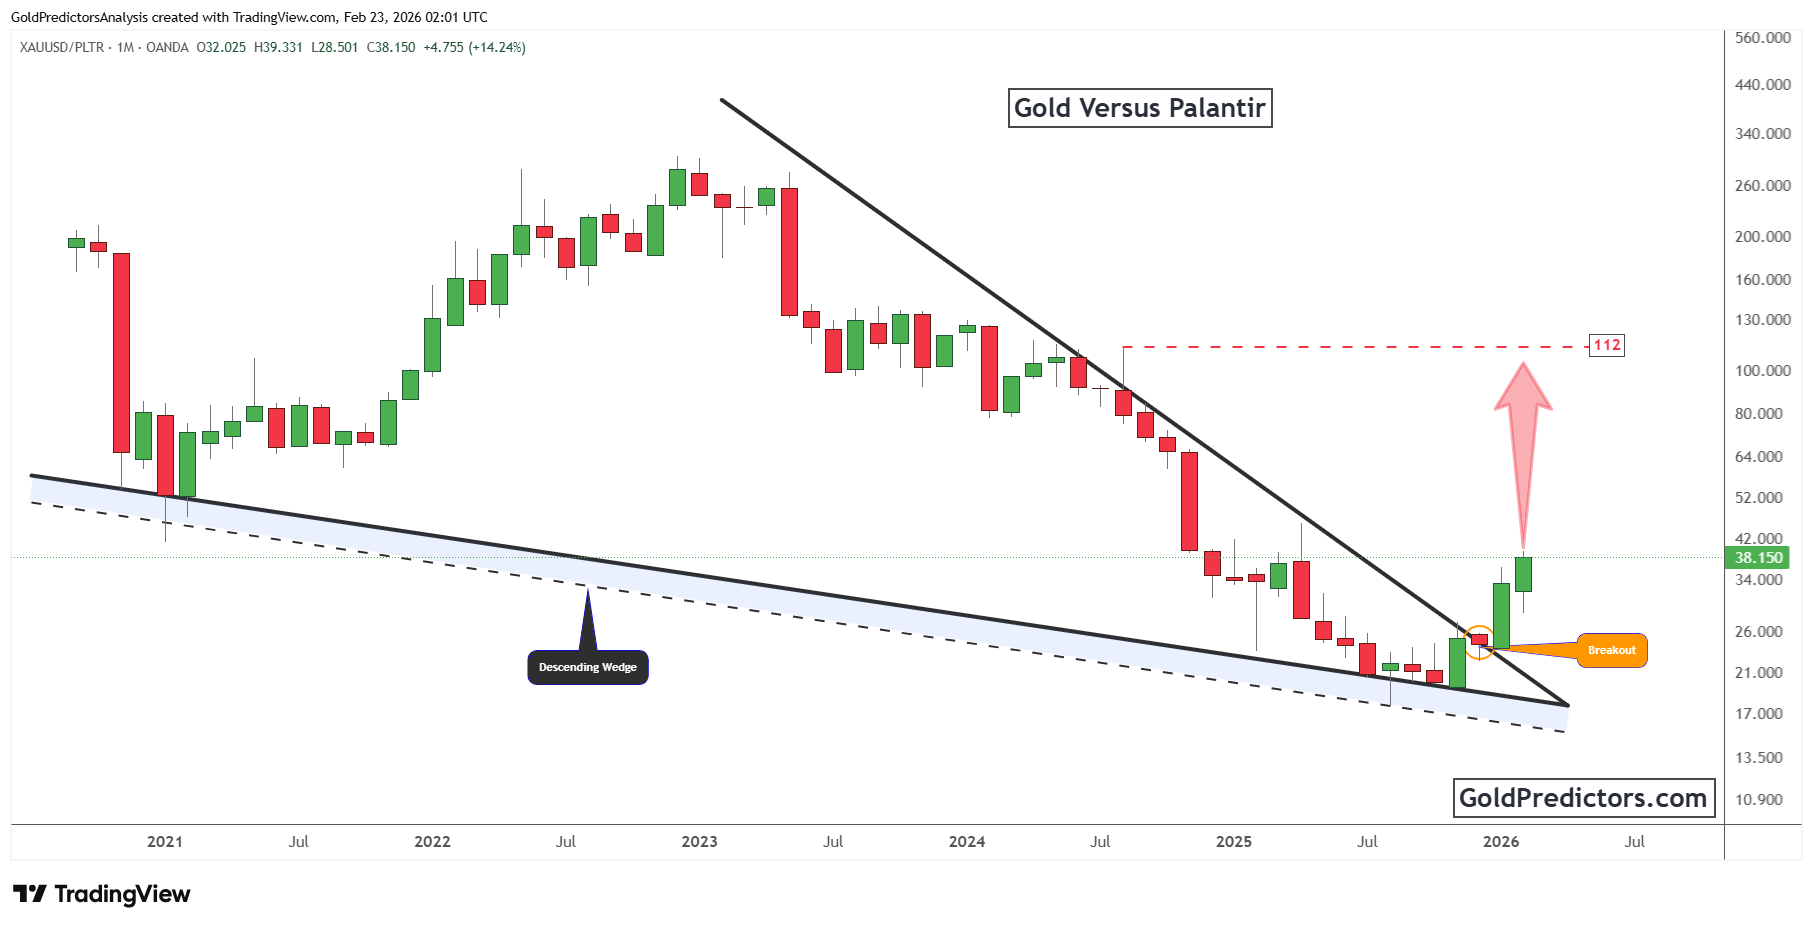
After a prolonged decline, the ratio shifted into a consolidation phase that moderated the prior trend. During this period, price developed a descending wedge marked by progressively narrower swings. This formation points to fading downside pressure. As the structure matured, momentum slowed and the price compressed along the lower boundary rather than extending lower, indicating a change in underlying balance.
A breakout occurred in 2026, with the ratio pushing above descending resistance and showing a clear expansion in momentum. This shift signals renewed leadership from gold after several years of underperformance. The projected area near 112 serves as the next technical reference, yet the more important development is the change in leadership itself. This shift marks a transition from prolonged underperformance into a phase where gold begins to regain dominance.
Gold outlook: Structural strength and leadership rotation support higher prices
Gold has moved through long-standing technical barriers and stabilized at higher levels. The sustained advance through former barriers shows acceptance of higher levels rather than a temporary surge. By holding within its rising channel after multiple breakout phases, gold maintains a framework that supports continuation over time. This behavior reflects steady participation and a market that continues to absorb higher prices.
At the same time, the gold-to-Palantir ratio has turned higher after breaking out from a multi-year descending wedge. After several years of lagging growth equities, gold has turned higher on a ratio basis and broken out from a compressive structure. That turn marks a change in leadership, not just a short-term adjustment. Capital preference is beginning to rotate back toward hard assets as relative performance dynamics evolve.
These technical and intermarket signals point to a durable change in positioning. Short-term pauses or shallow pullbacks remain possible after a sharp advance. As long as gold holds above former breakout zones and relative strength remains constructive, the broader setup continues to favor higher levels over the longer term.
Gold Predictors Premium Membership
Get exclusive short-term and swing trade ideas with precise entry levels, stop-loss, and target prices, including justification and analysis — all delivered directly via WhatsApp.
Our premium service includes deep technical analysis on gold and silver markets. We cover cycle analysis, price forecasting, and key timing levels.
Members also receive a weekly market letter with detailed analysis, commentary from our Chief Analyst, including actionable insights, trade timing, and direction forecasts for gold and silver.
Stay ahead of the market — join our premium community today.


