


Gold Faces Resistance after Mid-Channel Surge While CPI Ratio Signals Strength
Gold (XAUUSD) remains in a strong long-term uptrend, trading within its multi-decade ascending channel. After surging through the midline with accelerating momentum, the price hit $5,600 before facing sharp resistance and pulling back below $5,000. Despite this correction, the broader trend stays intact. At the same time, the gold-to-CPI ratio has broken out of a major consolidation zone, highlighting a structural revaluation of gold in real terms. This combination of technical structure and real-term breakout highlights gold’s ongoing revaluation in both nominal and inflation-adjusted terms.
Gold Faces Resistance after Surging Through Channel Midline
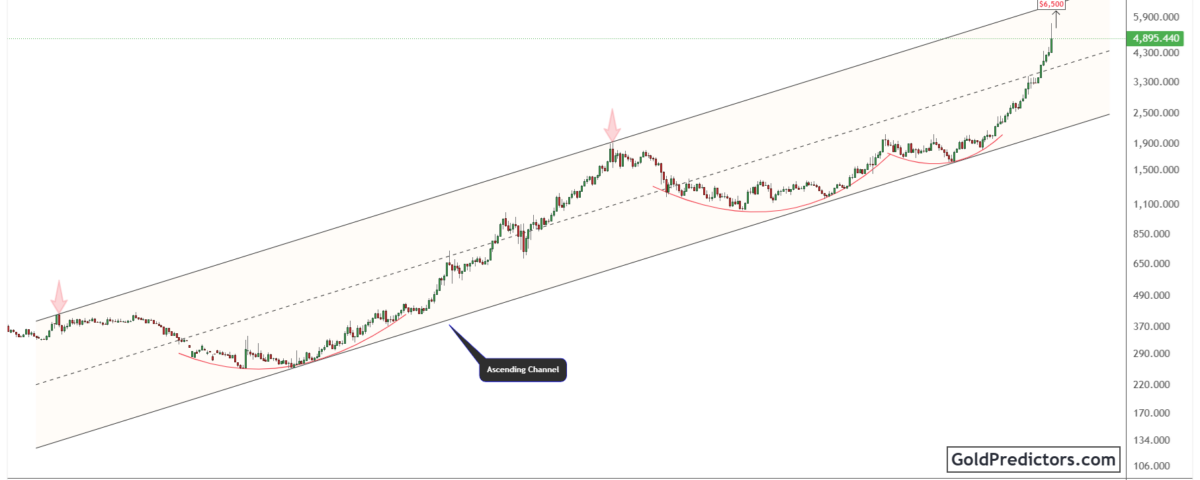
The gold chart below shows a well-defined ascending channel that has guided price action for more than three decades. Price moved consistently within this structure, forming a series of higher highs and higher lows over several decades. Throughout the climb, multiple consolidation phases formed strong base structures. These pauses often developed into rounded bottoms, indicating steady accumulation near key support along the channel’s lower boundary.
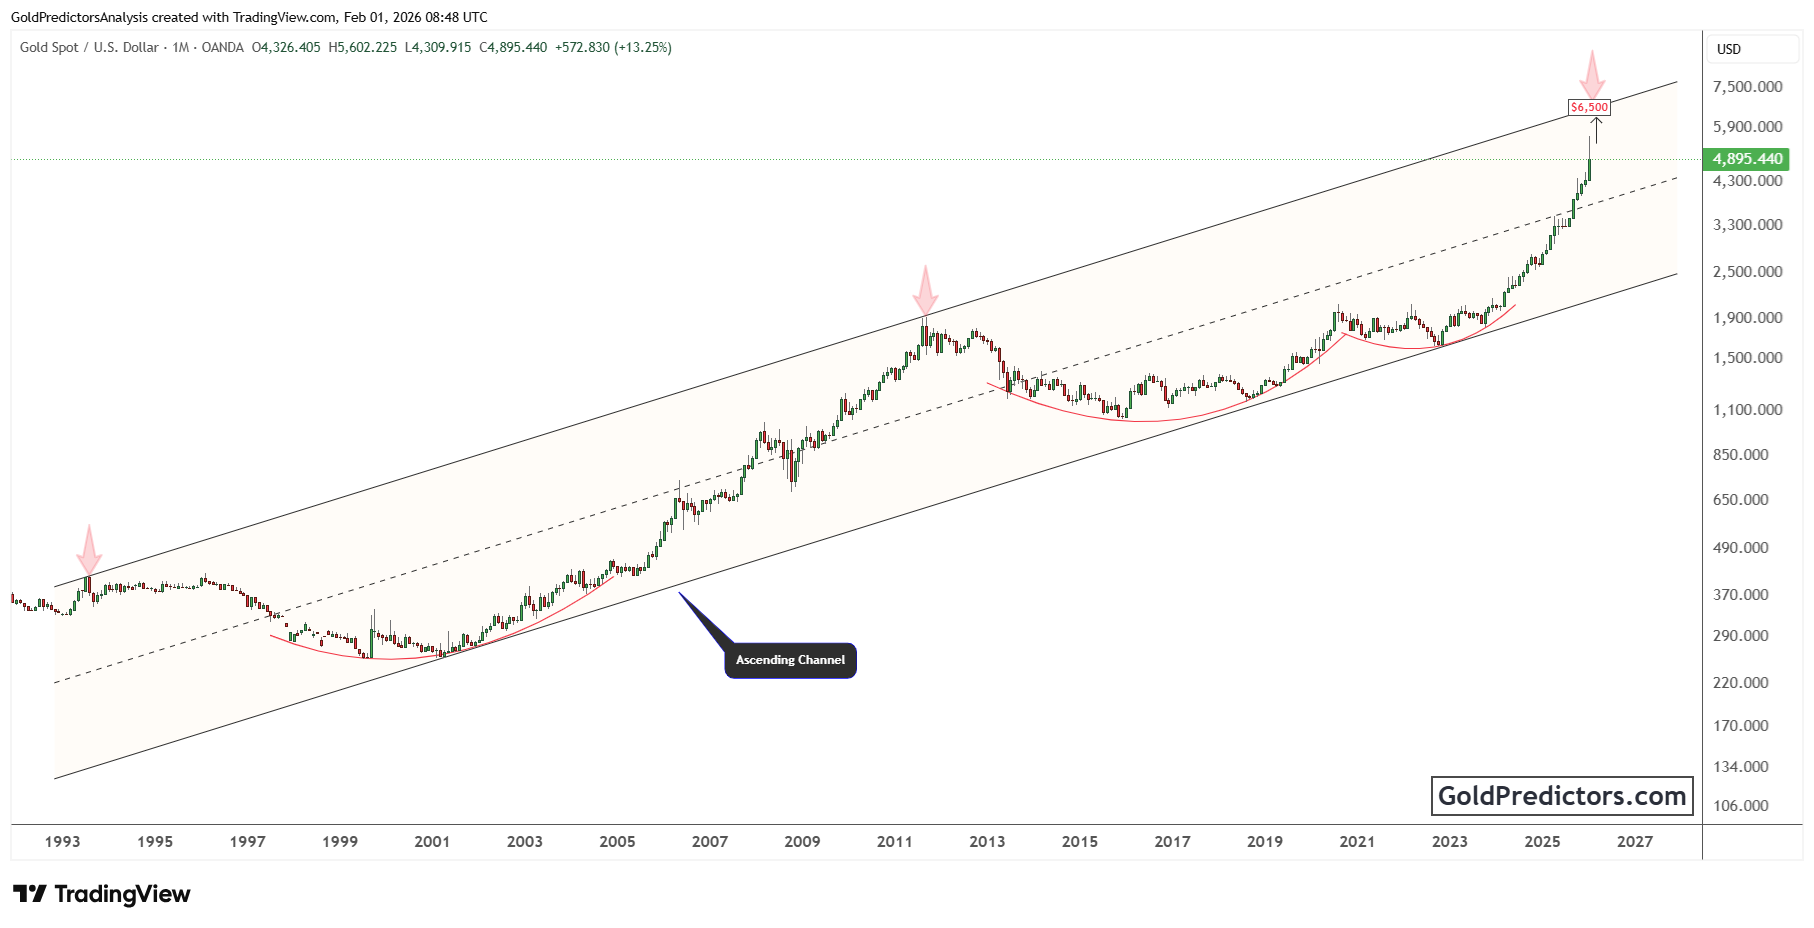
Following a period of steady strength, gold held firmly above the mid-channel trendline, setting the stage for a sharper advance. After consolidating along this level, the price began to accelerate with renewed momentum. The move echoed earlier rallies within the channel but unfolded with greater intensity. In late 2025, gold surged through the midline with conviction and is now approaching the upper boundary of the long-term structure.
As price nears the top of the channel, gold encounters a significant resistance area. The recent rally lifted the price to $5,600, but intense resistance forced a sharp drop below $5,000. This pullback highlights the weight of overhead resistance and suggests that a move toward $6,500 may take more time to develop. While the broader trend remains bullish, gold may need to consolidate and rebuild momentum before it can challenge the upper boundary of the long-term structure again.
Gold Gains Real Strength as CPI Ratio Clears Major Resistance
The chart below shows a breakout in the gold-to-CPI ratio, highlighting gold’s strength relative to the U.S. Consumer Price Index (CPI). This ratio tracks gold’s real purchasing power by adjusting for inflation across decades. The move signals a sharp rise in gold’s inflation-adjusted performance and highlights its role as a long-term hedge against inflation. Historically, gold tends to peak when this ratio experiences a sharp upward spike. The current breakout may mark the start of a renewed expansion in gold’s real purchasing power.

Over time, the gold-to-CPI ratio developed multiple broad cup-like patterns, reflecting a prolonged period of consolidation. Rounded bottoms formed after the post-1980 decline, with renewed upward pressure emerging in the later stages of the consolidation. A breakout occurred in 2024, taking the ratio above the key resistance level and the neckline of the cup structure. This move marks a historic shift in gold’s inflation-adjusted strength.
Currently, the gold-to-CPI ratio trades at elevated levels, confirming a decisive breakout in real terms. The sharp ascent following the breakout reflects strong capital rotation into hard assets, with gold firmly leading the trend. This move indicates that gold is outperforming not only fiat currencies but also the broader real economy. Unlike previous rallies that stalled at resistance, this move has broken through long-standing barriers.
Gold Outlook: Real-Term Breakout and Channel Structure Support Long-Term Strength
Gold remains in a strong uptrend, steadily climbing within its multi-decade ascending channel. The sustained move through the structure reflects broad macro support, while the breakout above the midline signaled accelerating momentum. After reaching $5,600, the price faced sharp resistance and quickly pulled back below $5,000. As long as gold holds above key structural support, the broader bullish framework remains intact.
At the same time, the breakout in the gold-to-CPI ratio marks a critical development. This move shows that gold is strengthening in real terms, not just in nominal price. By breaking above a major inflation-adjusted resistance zone, gold is now outperforming both fiat currencies and consumer prices. The formation of multi-decade base structures in this ratio adds further weight to the bullish thesis.
These patterns suggest gold is undergoing a powerful revaluation phase. The gold-to-CPI ratio has already broken out of its long-term range, signaling strength in real terms. At the same time, gold’s nominal price continues to rise within its multi-decade ascending channel, with the latest rally approaching the upper boundary. Although the recent pullback may lead to temporary consolidation, the broader bullish structure remains intact, reaffirming gold’s role as a reliable store of value in an evolving global system.
Gold Predictors Premium Membership
Get exclusive short-term and swing trade ideas with precise entry levels, stop-loss, and target prices, including justification and analysis — all delivered directly via WhatsApp.
Our premium service includes deep technical analysis on gold and silver markets. We cover cycle analysis, price forecasting, and key timing levels.
Members also receive a weekly market letter with detailed analysis, commentary from our Chief Analyst, including actionable insights, trade timing, and direction forecasts for gold and silver.
Stay ahead of the market — join our premium community today.


