


Gold Breaks Out of Decade-Long Channel as Nasdaq Ratio Signals Reversal

Gold (XAUUSD) has broken out of a decade-long ascending channel, signaling a major shift in market structure. Since 2015, the channel supported a steady uptrend marked by repeated accumulation phases and rising lows. A clear breakout above the upper boundary confirms renewed bullish momentum, fueled by inflation concerns and sustained central bank demand. At the same time, the Nasdaq-to-Gold ratio has broken down from a long-term topping pattern, signaling a reversal in equity leadership. This shift highlights a structural change in capital allocation toward real assets. With strong follow-through and no immediate resistance ahead, gold appears poised to lead the next phase of the market cycle.
Gold Breaks Decade-Long Channel, Signals Start of New Secular Bull Market
The gold chart below shows a decisive breakout from a well-structured ascending channel that has been in place since 2015. For nearly a decade, this channel provided a clear roadmap for gold’s gradual rise. Throughout this period, price action developed multiple rounded base formations, which are traditional indicators of accumulation, followed by a series of higher lows and sustained upward momentum. These formations consistently marked periods of consolidation that supported the continuation of the broader bullish trend.

Gold has recently broken above the upper boundary of its long-standing ascending channel, signaling a significant technical development. The breakout was clear and decisive, with monthly candles showing strong follow-through and persistent bullish momentum. As price continues to climb, there are no visible signs of exhaustion in the current trend. The strength of this move reflects growing demand driven by macro forces, including persistent inflation risks and steady accumulation by global central banks. The former resistance of the ascending channel now serves as strong support, creating a firm base for continued upside in the coming months.
Moreover, this breakout phase clearly indicates that gold has entered a new stage in its secular bull market. The broader trend remains firmly intact, supported by growing investor interest in real assets during periods of economic and geopolitical stress. Current price action reflects strong momentum, with no immediate resistance to cap the advance. If these conditions persist, gold appears well positioned to continue climbing in the quarters ahead.
Gold Outpaces Equities as Nasdaq-to-Gold Ratio Breaks Long-Term Support
The chart below shows a major reversal in the Nasdaq-to-Gold ratio, signaling the end of a long period of tech outperformance relative to gold. Since 2012, the ratio climbed within a broad ascending channel as growth stocks consistently outpaced gold, supported by low interest rates and risk-on sentiment. However, this trend has shifted. The ratio developed a broad topping formation, indicating weakening momentum. It has since broken lower, suggesting the early stages of sustained underperformance in equities relative to gold.
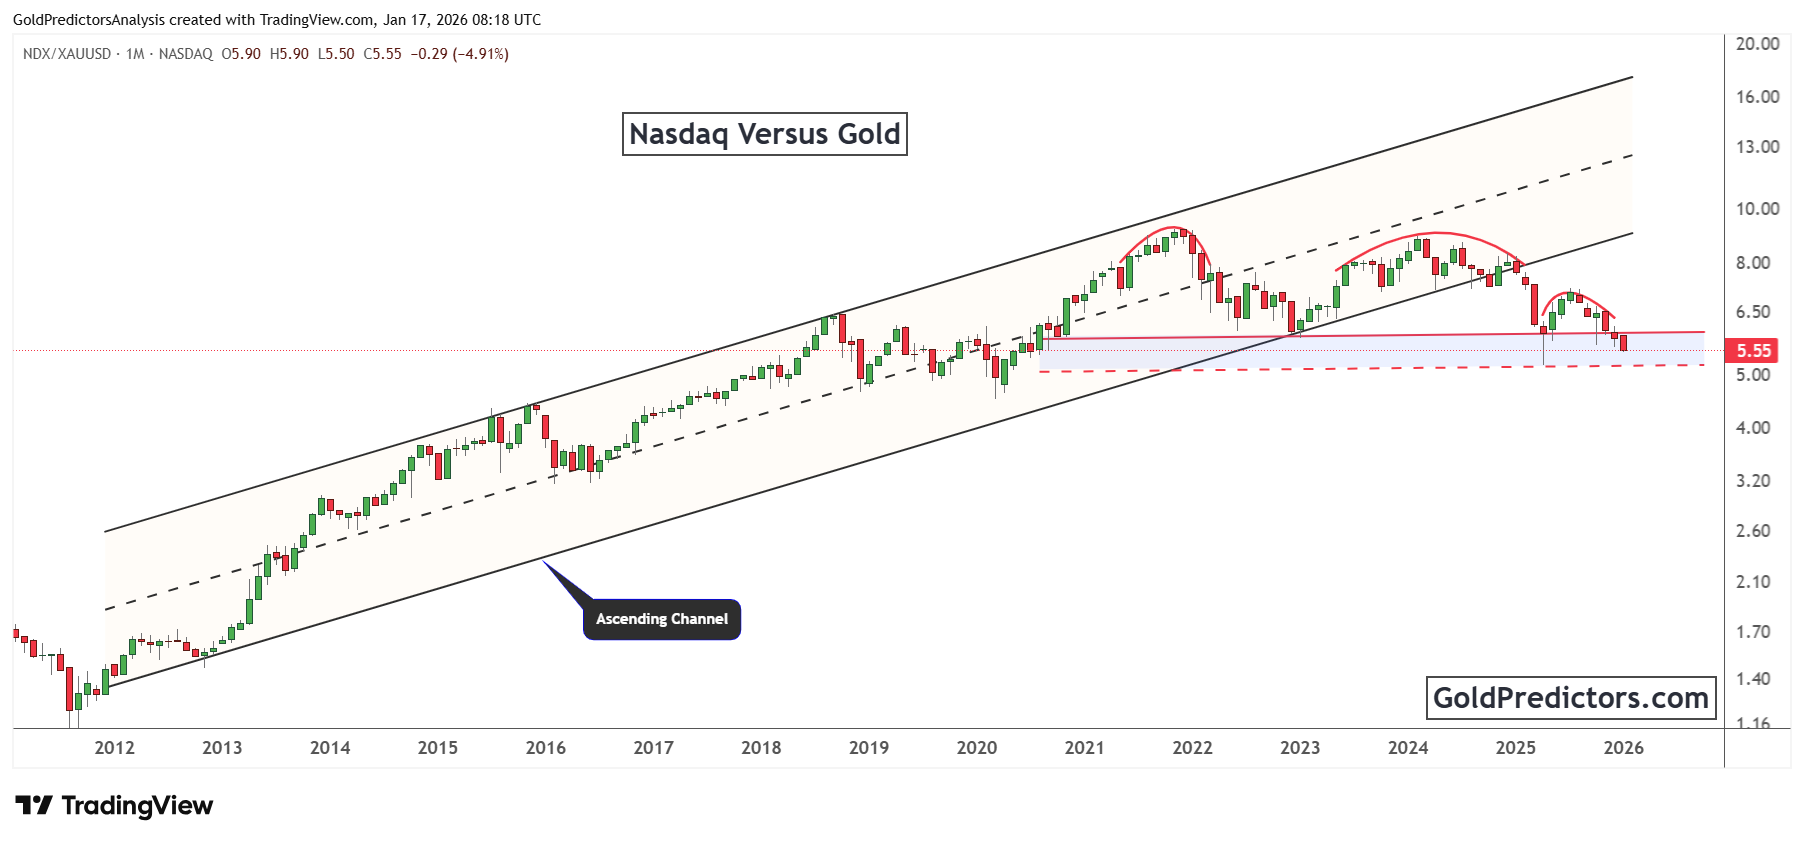
Over the past several years, the pattern evolved into a rounded top, signaling a gradual shift in momentum. This formation points to fading upside potential and increasing downside risk. Recent monthly candles support this outlook, as the ratio now hovers near a key horizontal support zone around 5.5. While this area has provided stability in the past, persistent selling pressure is now testing its durability.
The weakening structure of the Nasdaq-to-Gold ratio highlights a growing shift in market leadership. The repeated lower highs and weak rebounds suggest that bullish momentum in equities relative to gold has faded. This breakdown aligns with gold’s breakout, pointing to a broader rotation in market positioning. Capital appears to be flowing out of high-valuation tech stocks and into safer, inflation-resistant assets. If the current downtrend in the ratio continues, it could mark the early stages of a multi-year reversal in relative performance.
Conclusion: Gold Strength and Equity Weakness Point to Changing Market Dynamics
Gold’s breakout from a decade-long channel confirms a major shift in long-term market dynamics. The move reflects strong follow-through and steady buying interest, supported by favorable macroeconomic conditions. With no immediate resistance overhead, gold remains well positioned to extend its advance as global demand for real assets continues to rise.
At the same time, the Nasdaq-to-Gold ratio has broken below key technical levels, ending years of consistent equity outperformance. The failure to hold support and the development of a long-term topping pattern suggest that tech stocks may underperform over the coming years. This shift reflects a broader rotation away from growth assets and into inflation-protected stores of value.
These technical developments mark a structural change in capital allocation. Gold’s strong upside momentum, paired with the weakening equity ratio, highlights a growing preference for safety and stability. If these trends hold, gold could lead the next phase of the market cycle while high-valuation equities face continued pressure.
Gold Predictors Premium Membership
Get exclusive short-term and swing trade ideas with precise entry levels, stop-loss, and target prices, including justification and analysis — all delivered directly via WhatsApp.
Our premium service includes deep technical analysis on gold and silver markets. We cover cycle analysis, price forecasting, and key timing levels.
Members also receive a weekly market letter with detailed analysis, commentary from our Chief Analyst, including actionable insights, trade timing, and direction forecasts for gold and silver.
Stay ahead of the market — join our premium community today.


