


Is Gold Entering a New Secular Bull Market That Could Push Prices Toward $30,000?
Gold (XAUUSD) has broken out of a multi-decade consolidation, signaling the start of a powerful new bull market. The breakout occurred within a broadening wedge and followed years of accumulation and narrowing price action. A classic cup-and-handle pattern formed ahead of the move, highlighting the strength of the breakout.
At the same time, the gold-to-S&P 500 ratio broke out of a decade-long downtrend, signaling renewed leadership by hard assets. This alignment of price and ratio confirms a structural shift and supports the case for further long-term upside.
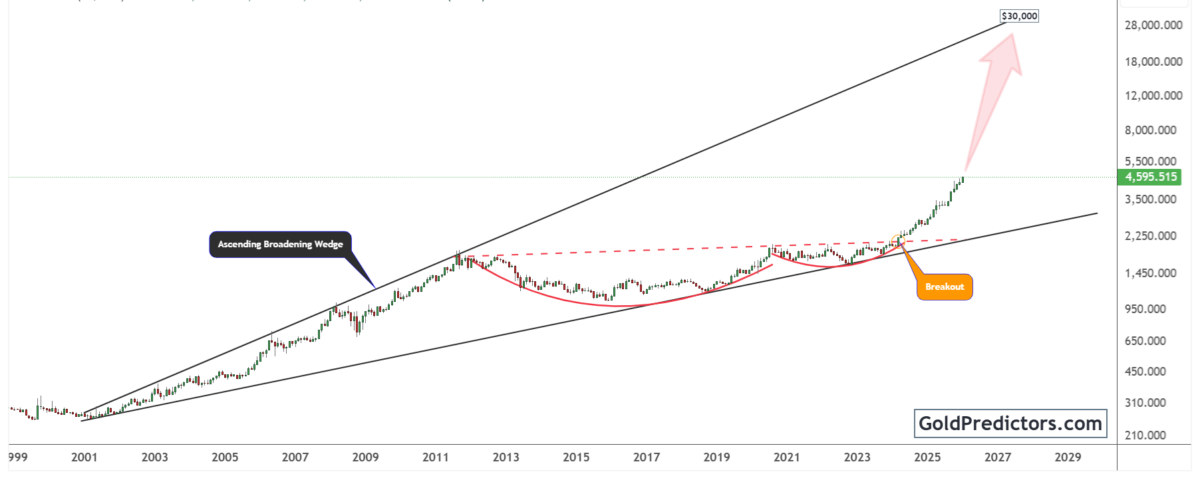
Gold Breaks Out of Multi-Decade Consolidation within Broadening Wedge
The gold chart below shows a breakout from a multi-decade consolidation pattern that unfolded within an ascending broadening wedge structure starting in the early 2000s. This consolidation phase formed a classic cup-and-handle pattern, defined by a deep rounded base followed by a shallow pullback. Gold decisively moved above long-standing horizontal resistance near the $2,000 level, confirming the end of the handle formation and launching a powerful new bullish phase within the broader wedge.

Following this breakout, gold accelerated sharply to the upside, reaching above $4,500 by early 2026. The price structure signals the start of a new leg in gold’s secular bull market, supported by strong technical and macro tailwinds. Based on the rising slope of the broadening wedge, the long-term projection points toward the $30,000 level. This move could play out over several years, driven by ongoing macroeconomic instability, dovish policy shifts, and continued accumulation of gold as a strategic asset.
Additionally, the trendline support from the early 2000s remains intact, adding to the evidence of a sustained long-term bullish outlook. Each phase of consolidation has led to renewed strength, highlighting the durability of gold’s upward movement. The current rally is supported by both technical structure and macro catalysts. This combination of technical strength and macro support validates the case for continued long-term upside in gold.
Gold Outperforms Stocks as Ratio Breaks Decade-Long Downtrend
The chart below shows the gold-to-S&P 500 index ratio, highlighting gold’s outperformance relative to equities. The ratio reveals a breakout from a decade-long downtrend. After peaking in the early 1980s, the ratio entered a long-term decline, with gold underperforming equities for nearly three decades. This downtrend ended in 2002, when the ratio began climbing steadily, signaling a shift in leadership from equities to hard assets.
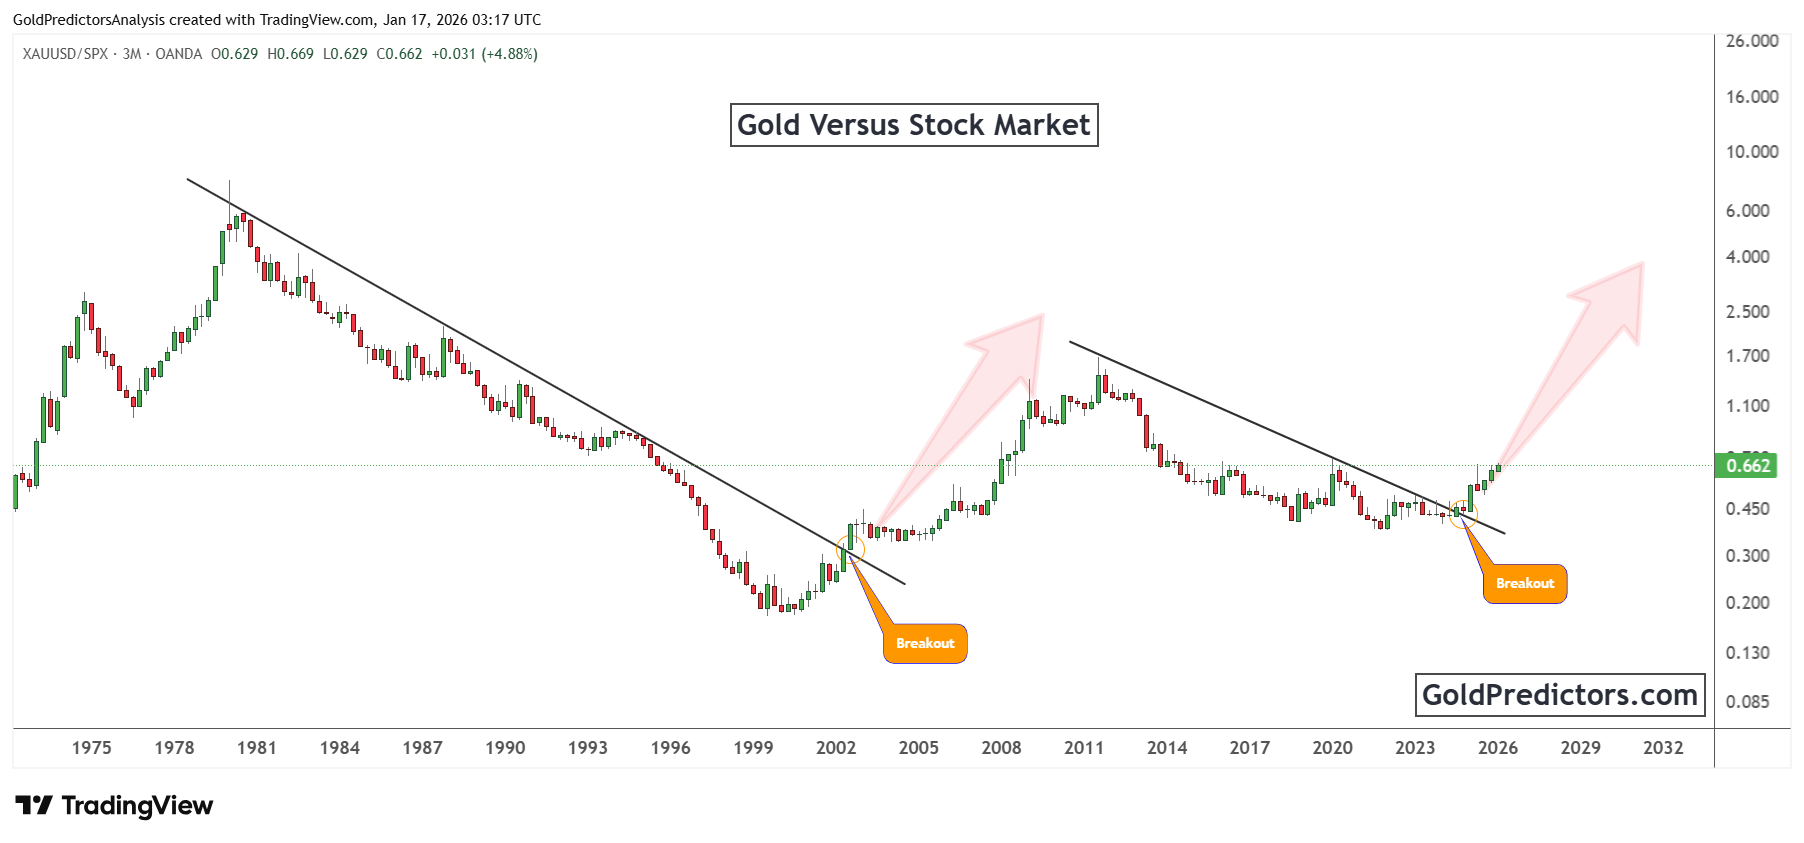
A comparable breakout occurred in late 2024, as the ratio moved above another key descending trendline. This move points to a renewed rotation away from traditional equities and back into gold, reflecting growing demand for defensive and inflation-protected assets. The breakout also confirms a structural shift in capital allocation, favoring tangible stores of value over high-duration risk assets.
Additionally, the sharp uptrend in the ratio implies that gold is not only gaining in absolute terms but is also outperforming broader stock market benchmarks. If history repeats, the current breakout could lead to a sustained period of gold dominance. This trend may strengthen further as equity valuations stay elevated and macro risks continue to build. The combination of strong gold prices and a rising gold-to-S&P ratio reflects a powerful dual signal. Both absolute performance and relative strength point to continued upside for gold.
Conclusion: Gold’s Breakout and Rising Ratio Signal Long-Term Market Leadership
Gold has completed a major breakout from a multi-decade consolidation phase, confirming the start of a new bullish cycle. The breakout above $2,000, following a well-formed cup-and-handle pattern inside a broadening wedge, highlights years of accumulation and growing investor conviction. Gold’s swift climb above $4,400 confirms the breakout’s strength and supports the case for much higher long-term targets.
At the same time, gold is gaining strength relative to equities. The breakout in the gold-to-S&P 500 ratio marks the end of a decade-long downtrend and signals renewed leadership by hard assets. This shift suggests a broader rotation away from overvalued equities and into defensive, inflation-sensitive assets like gold. These developments highlight a structural shift in market leadership that continues to favor gold over traditional equities.
The combination of gold’s price breakout and its rising performance relative to equities signals a structural bullish shift. The charts indicate that gold is not just rallying but is also reclaiming a dominant role in the macro landscape. As macro uncertainty persists and monetary conditions evolve, gold remains well positioned to deliver long-term gains, with technical indicators pointing toward the $30,000 level.
Gold Predictors Premium Membership
Get exclusive short-term and swing trade ideas with precise entry levels, stop-loss, and target prices, including justification and analysis — all delivered directly via WhatsApp.
Our premium service includes deep technical analysis on gold and silver markets. We cover cycle analysis, price forecasting, and key timing levels.
Members also receive a weekly market letter with detailed analysis, commentary from our Chief Analyst, including actionable insights, trade timing, and direction forecasts for gold and silver.
Stay ahead of the market — join our premium community today.


