


Gold’s Structural Shift: Technical Breakout Meets Monetary Expansion
Gold (XAUUSD) has broken out of a decades-long triangle pattern, marking a key turning point in its structural trend. The move follows years of consolidation and signals renewed momentum. This breakout reflects growing confidence in gold’s role as a durable store of value. At the same time, the gold-to-M2 ratio confirms rising strength in real terms. These aligned breakouts suggest a major shift is underway. Gold is now trading in open territory, with long-term indicators pointing toward continued upside.
Gold Breaks Out of Multi-Decade Triangle, Enters Long-Term Bull Phase
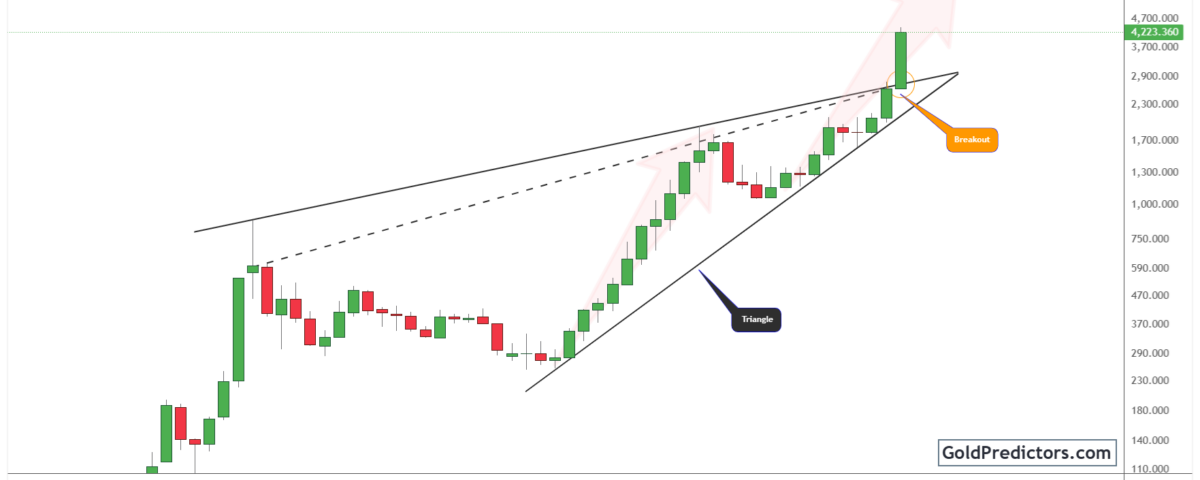
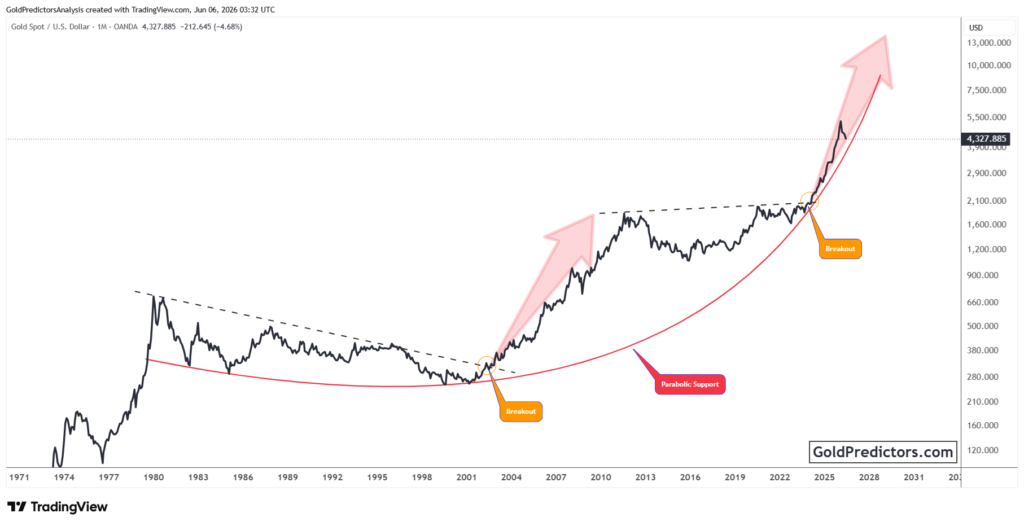
The gold chart below shows a decisive breakout from a well-formed triangle pattern that developed over multiple decades. Following a strong rally in the early 2000s, gold reached its peak in 2011 and entered a prolonged consolidation phase. During this period, price action tightened within converging trendlines. This created a triangle that highlighted prolonged market compression. This multi-year structure acted as a base-building phase, setting the stage for the recent breakout and renewed momentum.
After breaking through key resistance, the breakout gathered momentum and confirmed a directional shift. This move broke through the upper boundary of the triangle, turning the consolidation into a base for further gains. The breakout validates the triangle as a continuation pattern, suggesting that the next leg of the bull market is underway.
Technically, the breakout signals a sustained bullish phase, with a projected upside toward the $6,500–$8,500 range. These targets correspond to the height of the triangle applied from the breakout level. The presence of strong bullish candles and rising momentum supports this outlook. With minimal resistance overhead, gold now trades in open territory, increasing the likelihood of continued strength in the years ahead.
Gold-to-M2 Ratio Breaks Key Barrier, Confirms Real Purchasing Power Gain
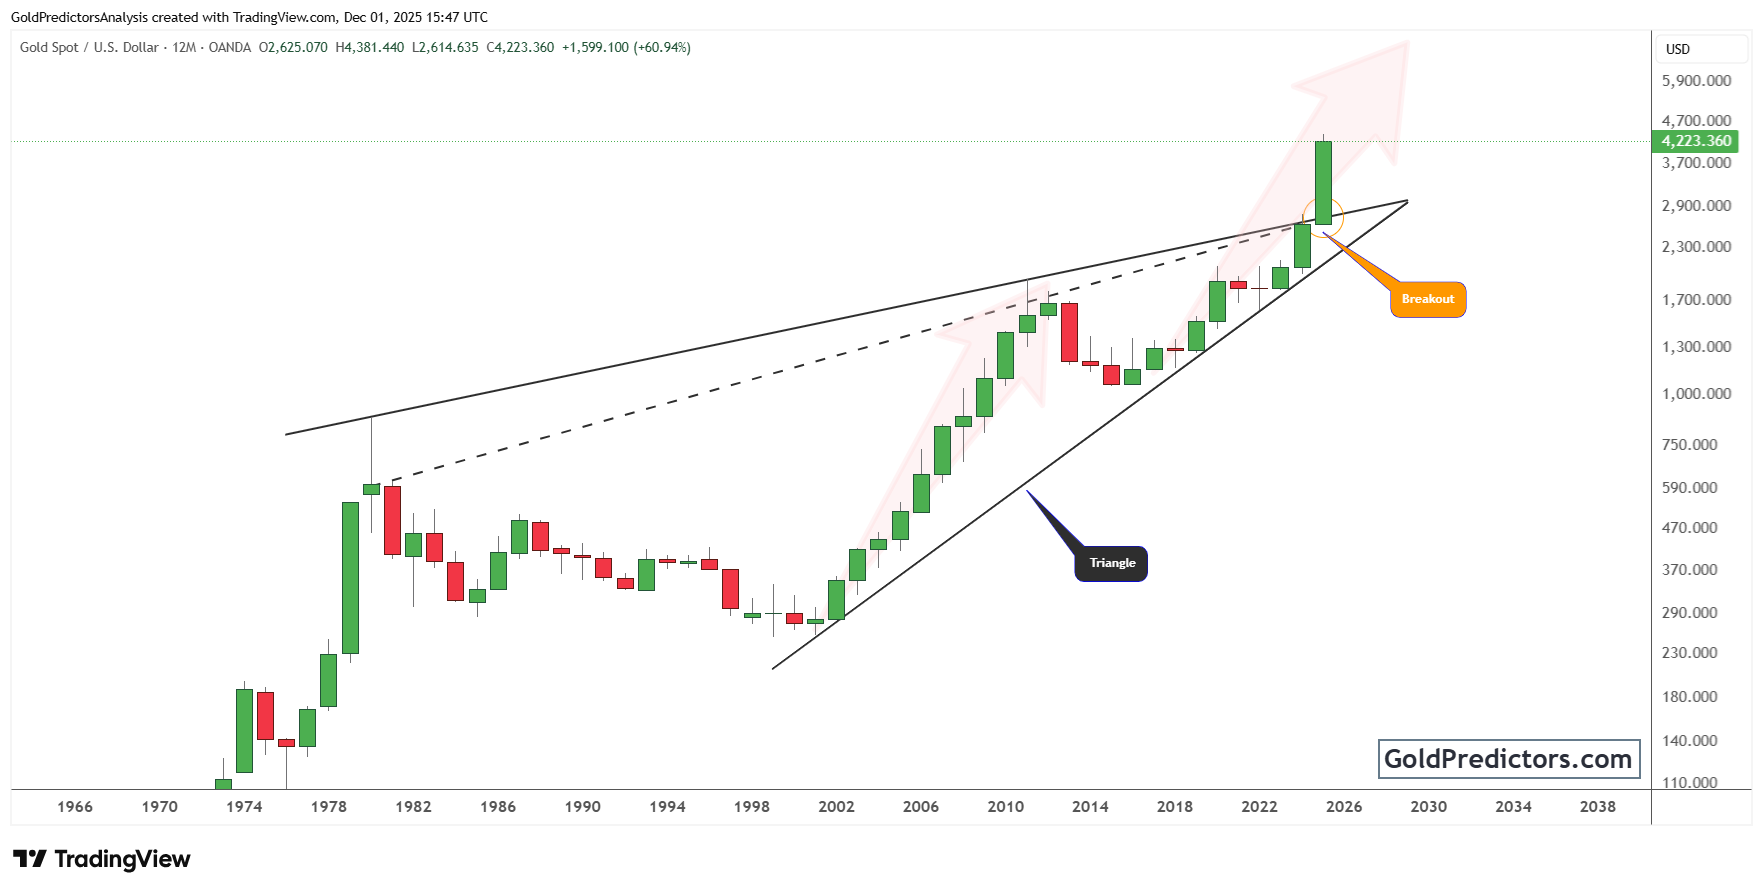
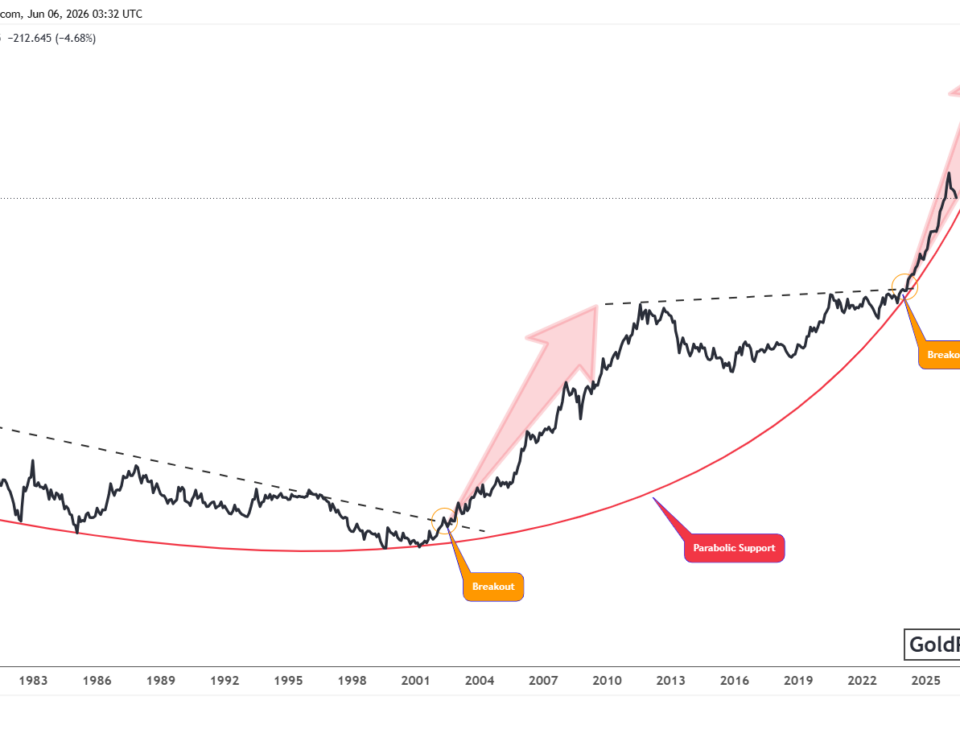
The chart below shows gold’s performance relative to the U.S. money supply (M2), providing insight into its inflation-adjusted strength. For more than a decade, this ratio remained range-bound, forming a broad base with two rounded bottoms. A descending trendline, drawn from the 1980 peak and retested in 2011, served as a persistent resistance level for the ratio.
Recently, the gold-to-M2 ratio broke above a long-standing descending resistance line. It is now testing a key horizontal barrier, signaling a potential shift in its structure. This move signals that gold is not only rising in nominal terms but is also outperforming the expanding money supply. As a result, the breakout reflects a genuine increase in purchasing power and indicates a renewed investor preference for tangible assets over fiat-based systems.
Moreover, the rounded bottom structure reflects a long phase of support formation, adding weight to the breakout. This shift suggests that gold is reclaiming its role as a store of value in an increasingly liquid financial environment. Historically, breakouts of this kind have often preceded multi-year bull runs, particularly during periods of elevated inflation and financial stress. Combined with recent price action, this breakout strengthens the case for a sustained revaluation phase.
Gold outlook: Structural breakouts and real-value gains support sustained upside
Gold has entered a new era of structural strength, driven by decisive technical and macroeconomic shifts. The breakout from a multi-decade triangle pattern confirms the end of a long consolidation phase and marks the beginning of a powerful new trend. The move above the $3,100–$3,200 zone confirms the triangle as a base formation and signals potential for higher long-term gains.
At the same time, the gold-to-M2 ratio has broken above descending resistance and is testing horizontal barriers. This signals that gold is not just gaining nominally, but also rising in real, inflation-adjusted terms. Moreover, the breakout from the ratio’s rounded base and long-standing trendline marks a renewed shift toward gold as a reliable store of value.
These developments indicate a broader reassessment of gold’s role within the financial system. With breakouts confirmed in both price action and macro ratios, the long-term outlook now supports sustained strength. Gold has transcended historical boundaries and entered uncharted territory, reaffirming its position as a core asset in today’s evolving monetary landscape.
Gold Predictors Premium Membership
Get exclusive short-term and swing trade ideas with precise entry levels, stop-loss, and target prices, including justification and analysis — all delivered directly via WhatsApp.
Our premium service includes deep technical analysis on gold and silver markets. We cover cycle analysis, price forecasting, and key timing levels.
Members also receive a weekly market letter with detailed analysis, commentary from our Chief Analyst, including actionable insights, trade timing, and direction forecasts for gold and silver.
Stay ahead of the market — join our premium community today.
