


Gold Surges into New Bull Market While Bitcoin-to-Gold Ratio Crashes
Gold (XAUUSD) has broken out of a multi-decade triangle pattern, confirming a new phase in its long-term bull market. The move follows years of consolidation and accumulation, which led to a decisive breakout above key resistance. This shift reflects strong technical momentum and broader macro drivers, including inflation hedging, central bank demand, and geopolitical risk. At the same time, Bitcoin has lost ground relative to gold, with the ratio breaking key support after forming a major topping structure. These developments signal a turning point in market dynamics and highlight gold’s renewed dominance as a strategic store of value.
Gold Breaks Out of Multi-Decade Triangle to Confirm Secular Bull Market
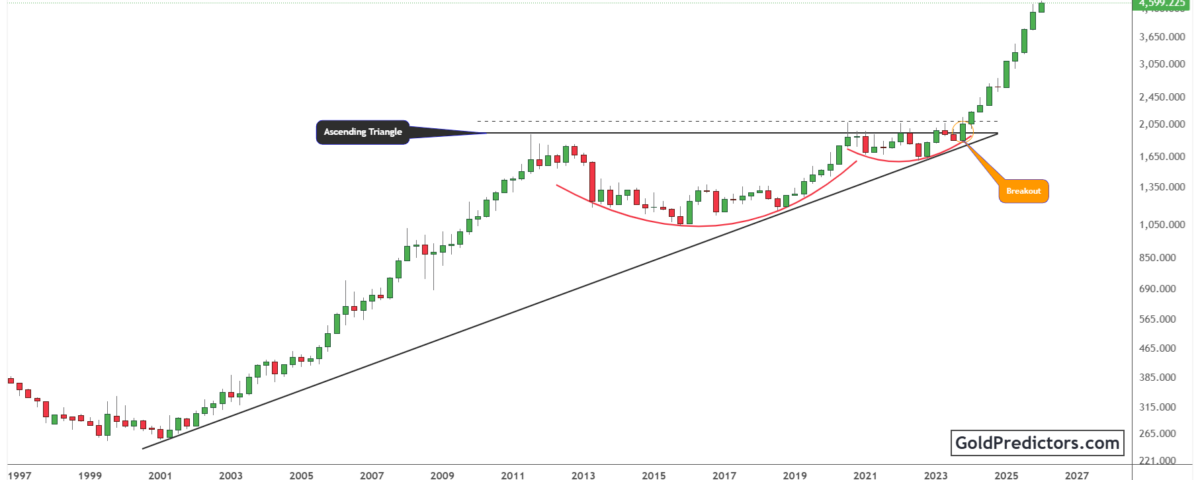
The gold chart below shows a major breakout from a long-term ascending triangle that began forming after the 2011 peak. Following an extended consolidation phase and the formation of a rounded base, price action developed into a classic cup-and-handle structure. This structure signaled growing accumulation and set the stage for a decisive upside breakout that launched gold into a new phase of its long-term bull market.

In 2024, gold cleared the critical $2,000 level, triggering a strong breakout that signaled a fresh upward phase. Since that move, price action has accelerated into a parabolic advance, with quarterly candles reflecting strong momentum and limited signs of fatigue. The clean break above long-standing horizontal resistance validates the prior consolidation as a bullish continuation pattern. This breakout signals a broader macro transition, supported by inflation hedging demand, sustained central bank buying, and elevated geopolitical risk.
Moreover, the long-term trendline extending from the early 2000s remains firmly intact, adding to the evidence that gold is in a sustained secular bull market. Current price action reflects more than just a short-term rally. It aligns with a broader structural expansion unfolding over multiple decades. Gold has consistently respected this trendline, highlighting the strength of its long-term uptrend. As support levels continue to rise, the overall technical backdrop remains decisively bullish.
Gold Outperforms Bitcoin as Ratio Breaks Key Support
The chart below shows a clear breakdown in the Bitcoin-to-Gold ratio after years of consolidation. Price failed to decisively break above long-term resistance near the 40 level, forming a broad topping structure. Repeated rejections from this zone created a horizontal ceiling. At the same time, the rising trendline pushed price higher, ultimately forming an ascending triangle.

Following a prolonged consolidation, the pattern resolved to the downside as the ratio broke below its rising trendline support. A sharp bearish candle confirmed the breakdown, followed by continued weakness in the following months. This move signals a clear loss of momentum for Bitcoin relative to gold, pointing to a possible shift in long-term capital allocation toward the metal.
Currently, the ratio is hovering near 21, confirming the bearish breakdown through a series of lower monthly closes. The projected path suggests further downside risk. If weakness persists, the ratio could fall toward lower single-digit levels, especially if macro forces continue to favor gold over digital assets.
Conclusion: Gold’s Breakout and Bitcoin’s Breakdown Signal Long-Term Capital Rotation
Gold’s breakout from a multi-decade triangle marks a historic shift in the precious metals market. After years of consolidation and steady accumulation, the metal has launched into a new phase of its secular bull market. The move reflects strong technical momentum and aligns with broader macro trends favoring real assets.
At the same time, Bitcoin has begun to lose ground relative to gold. The Bitcoin-to-Gold ratio broke below a key trendline, confirming a major topping pattern. This breakdown signals a loss of relative strength and highlights shifting capital flows. This transition marks a renewed phase of gold leadership in the macro environment.
These developments mark a broader shift of capital toward real assets. Gold’s multi-decade breakout and Bitcoin’s underperformance point to a rotation into tangible stores of value amid rising global uncertainty. As inflation pressures, central bank demand, and geopolitical risk persist, gold appears well-positioned to lead the next phase of global capital allocation.
Gold Predictors Premium Membership
Get exclusive short-term and swing trade ideas with precise entry levels, stop-loss, and target prices, including justification and analysis — all delivered directly via WhatsApp.
Our premium service includes deep technical analysis on gold and silver markets. We cover cycle analysis, price forecasting, and key timing levels.
Members also receive a weekly market letter with detailed analysis, commentary from our Chief Analyst, including actionable insights, trade timing, and direction forecasts for gold and silver.
Stay ahead of the market — join our premium community today.


