


Gold Breaks Out of Cup-and-Handle Formation with $6,000 Target in Sight
Gold (XAUUSD) continues to strengthen after completing a multi-decade cup-and-handle formation within a long-standing ascending channel. The setup unfolded gradually, driven by long-term accumulation and a series of higher lows that signaled growing strength. A decisive breakout in 2024 confirmed the bullish setup, with price surging above key resistance and holding momentum into 2025. At the same time, the Gold-to-Dow ratio has broken a 40-year trendline, signaling a major rotation from equities into real assets. These developments point to a powerful structural shift that supports significantly higher gold prices ahead.
Gold Builds Momentum after Cup-and-Handle Breakout in Long-Term Channel
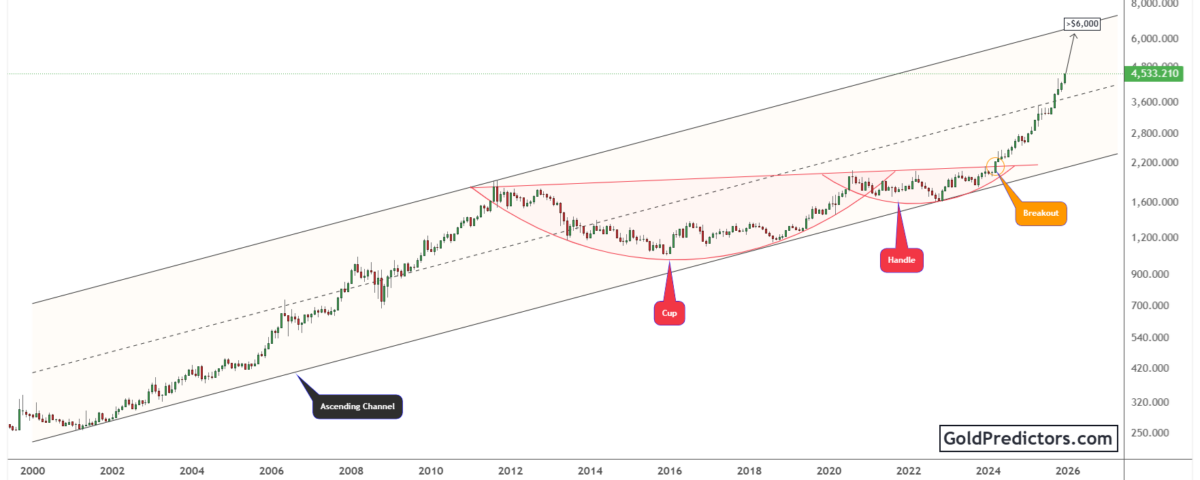
The gold chart below shows a well-defined ascending channel that began forming in the early 2000s. The steady decline from 2012 to 2015 created a rounded structure, setting the stage for a sustained upward move. This base marked the beginning of a broader structural setup. In 2016, gold began climbing gradually, building the right side of the formation and establishing a sustained upward trend within the rising channel.

Following this, gold moved into the handle phase. This stage was marked by a shallow consolidation within a narrowing range, suggesting a temporary pause in the broader uptrend. During this period, price action stayed within the lower half of the ascending channel, consistently finding support without breaking down. This consolidation created the conditions for a strong breakout to follow.
In 2024, gold broke decisively above horizontal resistance, completing its multi-decade cup-and-handle formation. The breakout was confirmed by a strong bullish candle that pushed price above the midline of the long-standing ascending channel. Gold continued its advance into 2025, maintaining firm momentum with no clear signs of exhaustion. The current technical structure now points to an upside target above $6,000. With no significant resistance in sight, gold remains well-positioned for a sustained move into uncharted territory.
Gold-to-Dow Ratio Breakout Signals Long-Term Rotation Into Real Assets
The chart below shows the long-term Gold-to-Dow ratio, a key measure of capital rotation between real assets and equities. Between 1980 and 2024, the ratio followed a persistent downtrend, with each rally capped by the descending trendline. Over time, a broad cup-like formation emerged as gold gradually began to outperform equities.
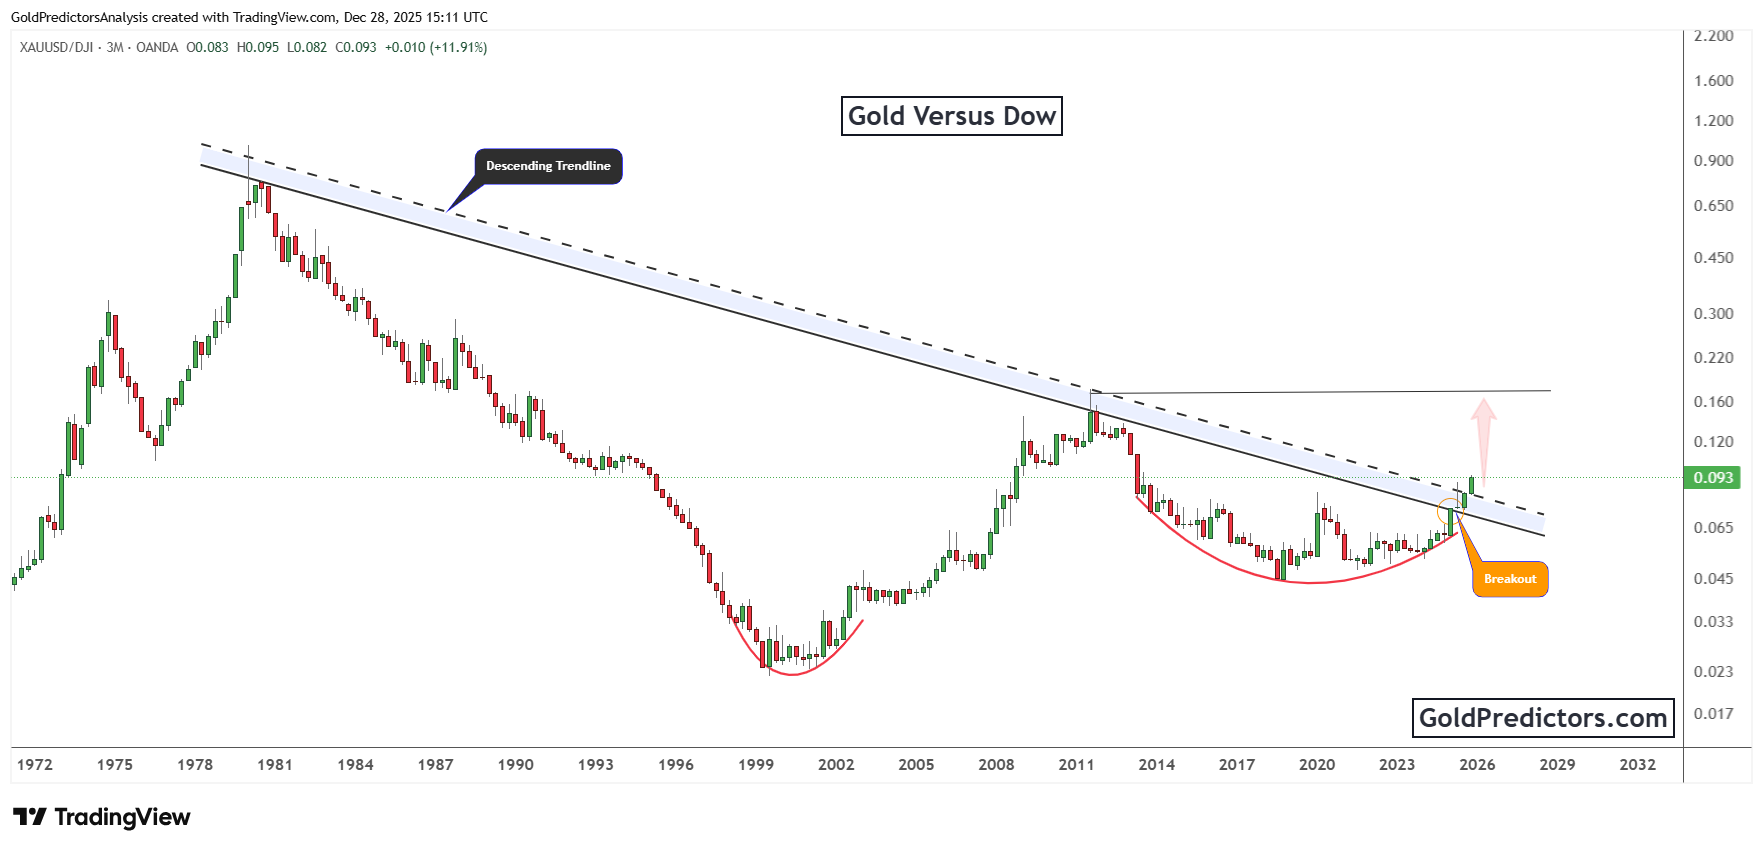
In 2025, the ratio finally broke above the long-standing trendline. The breakout was confirmed by a strong closing candle, signaling a structural shift in capital flows. This move suggests that gold is beginning to outperform equities in a more sustained and meaningful way, reflecting a broader change in market dynamics.
Historically, breakouts in the Gold-to-Dow ratio have preceded extended periods of gold strength. The previous breakout in the early 2000s triggered a sustained bull market in precious metals. Today’s setup closely mirrors that cycle, but with a deeper base, stronger momentum, and heightened macro headwinds. The ratio now targets the 0.19 level or higher, indicating substantial upside from current levels. This suggests not only further strength in gold but also the likelihood of continued weakness in traditional equity benchmarks like the Dow.
Conclusion: Gold’s Breakout and Ratio Surge Point to Long-Term Revaluation Cycle
Gold has entered a strong bullish phase after completing a multi-decade cup-and-handle formation. The breakout above key resistance confirms a structural shift in trend. Price action remains inside a well-defined ascending channel, with momentum accelerating and no major resistance overhead.
At the same time, the Gold-to-Dow ratio has broken above a 40-year trendline. This signals a shift in capital flows away from equities and into real assets. The pattern reflects rising confidence in gold’s long-term strength and growing pressure on equity benchmarks like the Dow. This rotation highlights gold’s growing role as a leading asset in the current market cycle.
With gold maintaining strong momentum and no clear signs of reversal, the path toward the $6,000 target remains firmly intact. Overhead resistance is minimal, and the combination of price structure and intermarket ratios continues to support further upside. As macro uncertainty intensifies and capital seeks stability, gold stands out as a leading asset, well positioned for a sustained upward move in the years ahead.
Gold Predictors Premium Membership
Get exclusive short-term and swing trade ideas with precise entry levels, stop-loss, and target prices, including justification and analysis — all delivered directly via WhatsApp.
Our premium service includes deep technical analysis on gold and silver markets. We cover cycle analysis, price forecasting, and key timing levels.
Members also receive a weekly market letter with detailed analysis, commentary from our Chief Analyst, including actionable insights, trade timing, and direction forecasts for gold and silver.
Stay ahead of the market — join our premium community today.


