Gold Enters Powerful Bull Market While Technology Stocks Lose Ground
Gold (XAUUSD) has entered a powerful bull market phase after breaking decisively above a multi-year resistance zone. This breakout triggered a sharp and orderly rally, with price action unfolding within a well-defined ascending channel. At the same time, the Technology-to-Gold ratio has broken down from a decade-long ascending channel. This breakdown signals a shift in market leadership away from growth equities and toward tangible assets, such as gold. These developments indicate a broader structural shift and underscore gold’s growing role as a reliable store of value in an increasingly uncertain environment.
Gold Breaks Key Resistance and Enters Powerful Bull Market Channel
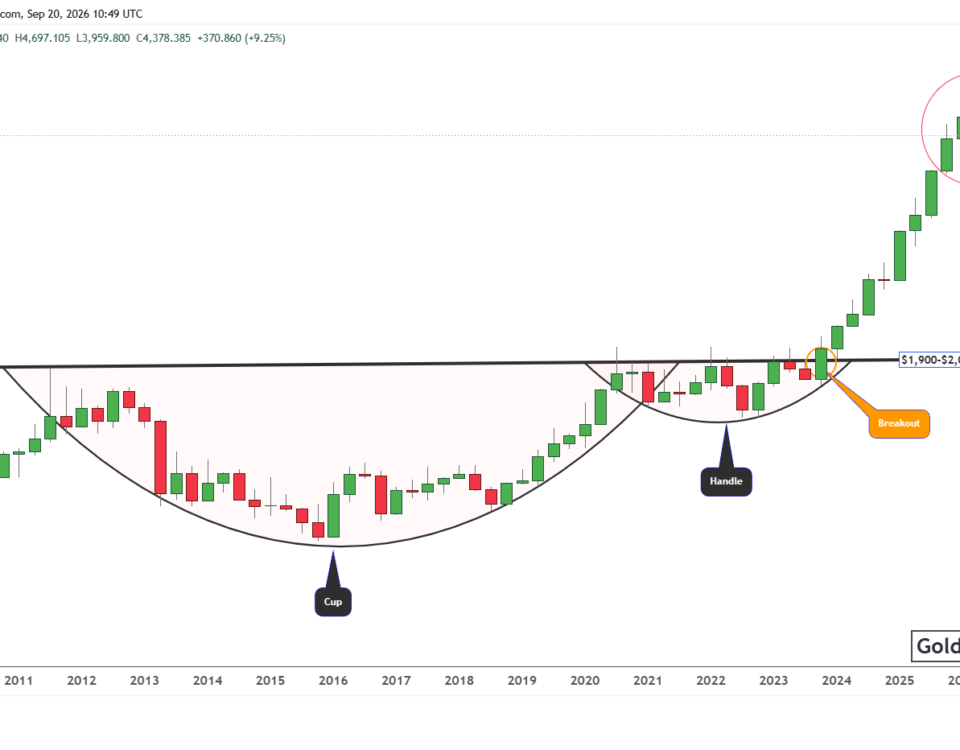
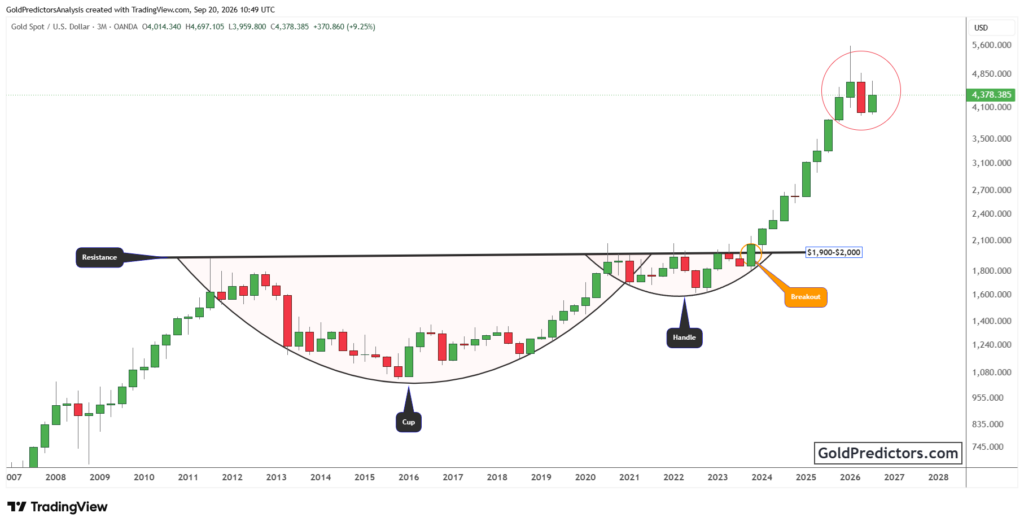
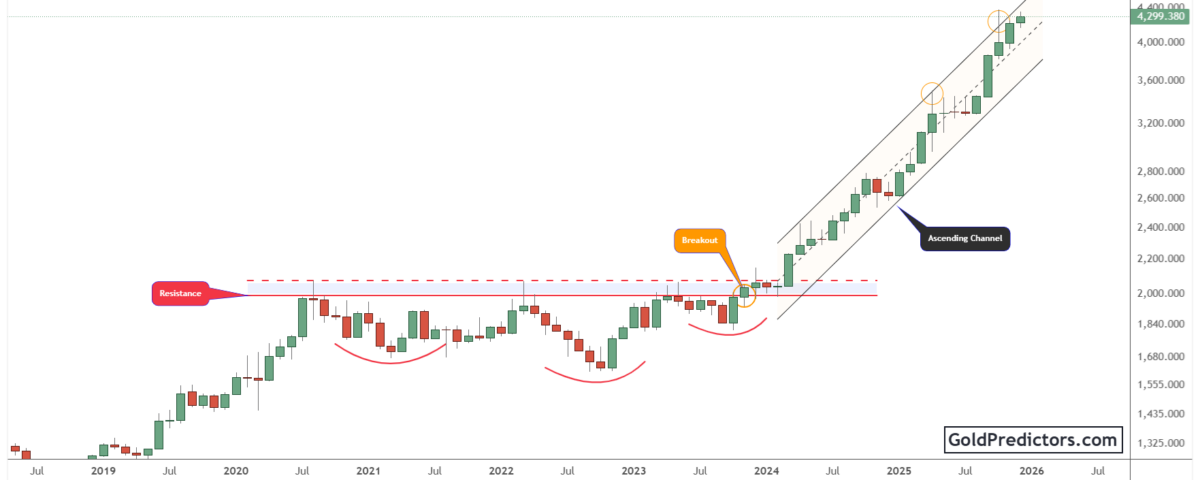
The gold chart below shows a decisive breakout above a significant resistance zone that had capped price action for an extended period. This horizontal ceiling, just below the $2,100 level, held firm for several years as gold formed a series of rounded bottoms. These recurring lows formed a solid accumulation zone, pointing to underlying long-term strength. Eventually, gold closed firmly above this zone, triggering a powerful rally and signalling the start of a new leg in its broader bull market.
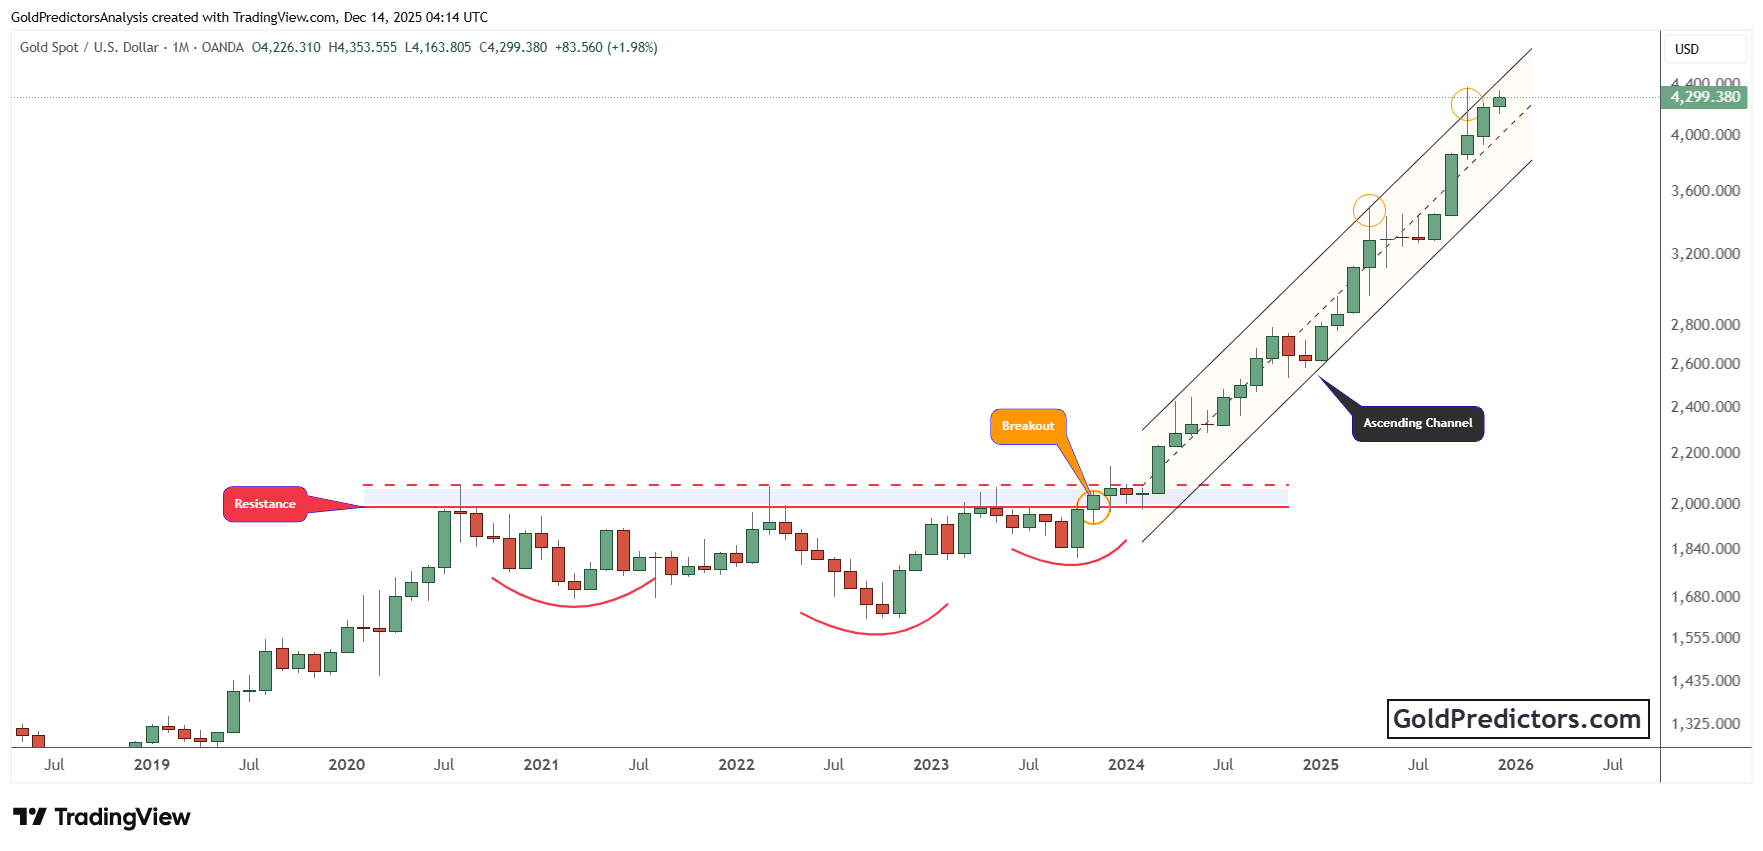
The breakout marked the beginning of a steep and orderly uptrend, characterised by strong follow-through and limited pullbacks. Price action developed within a rising channel, maintaining a clear and consistent structure. Each decline held near the lower boundary, while upward moves approached the upper resistance line. This disciplined pattern reflects a well-defined technical range, underpinned by ongoing macro uncertainty, shifting policy expectations, and steady global demand for safe-haven assets.
As of late 2025, gold is trading above $4,000, having already tested the upper channel boundary multiple times. These upper wicks, shown with orange markers, indicate areas where momentum paused but did not reverse the trend. The presence of a channel midpoint line adds further validation to the structure, serving as both a reaction zone and a confirmation of trend strength. The overall setup continues to support higher price targets as long as gold remains within this ascending structure.
Technology to Gold Ratio Breaks Down from Long-Term Channel Support
The chart below shows the technology-to-gold ratio, indicating that technology stocks are losing ground relative to gold. From 2012 to 2024, the ratio moved within a broad ascending channel, highlighting tech’s outperformance during the previous cycle. That trend has now shifted, as the ratio breaks below its long-standing ascending channel, signalling a potential turning point in relative market leadership.
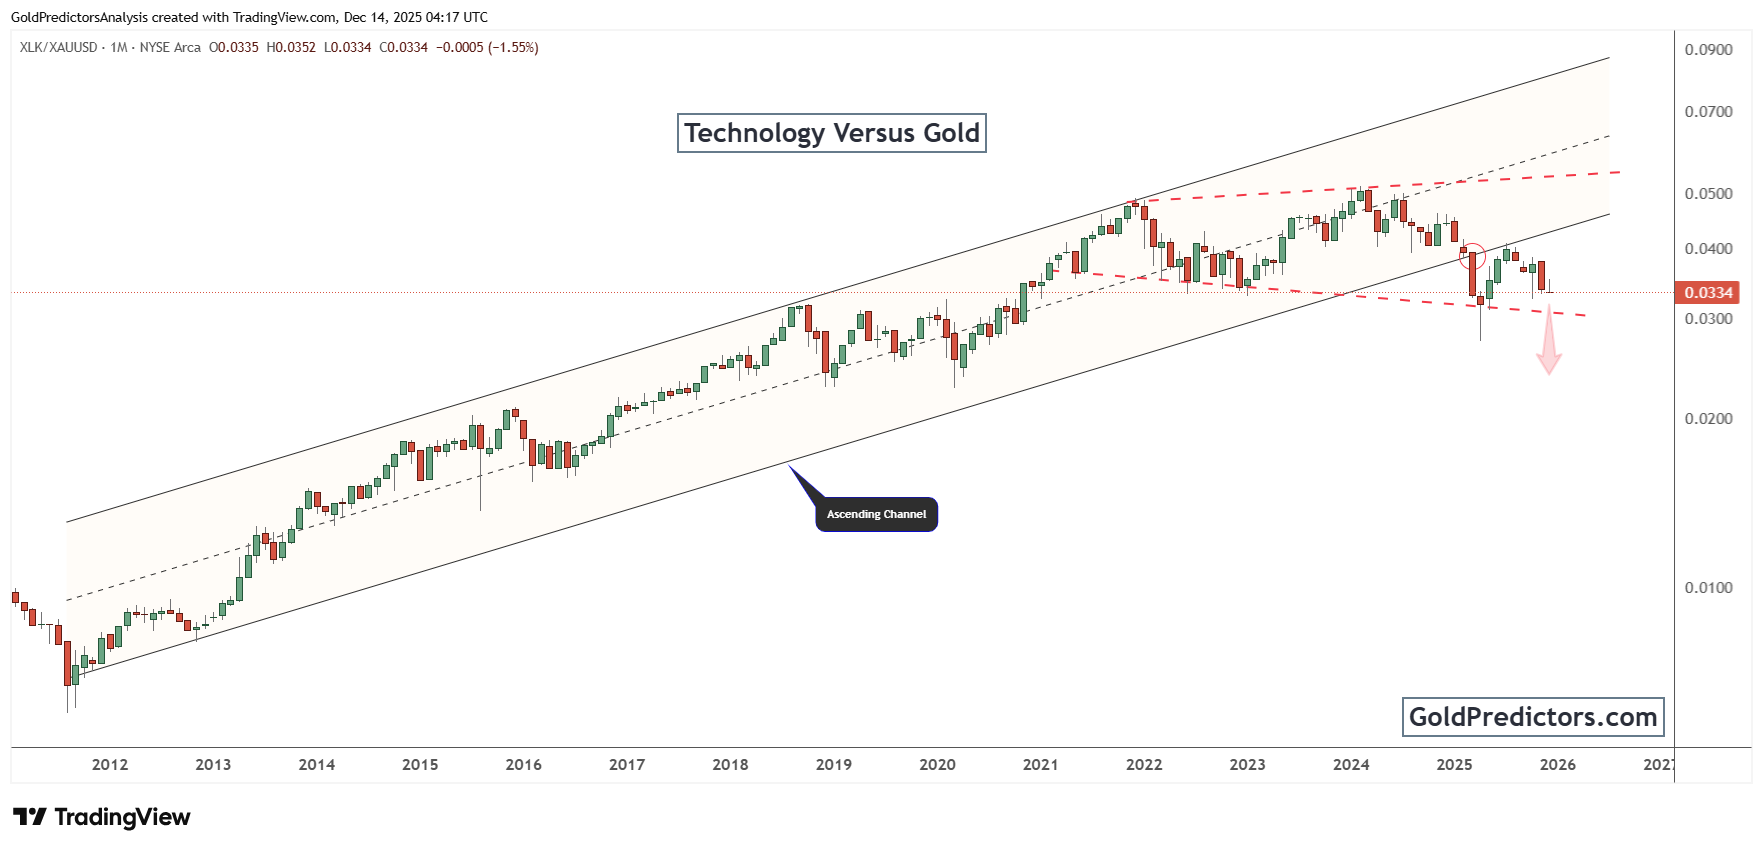
Initially, the ratio slipped below the lower boundary of its ascending channel in early 2025. A short-lived rebound was unable to reclaim the broken trendline, leading to a bearish retest and renewed weakness. The ratio remains under pressure, with the chart now pointing toward a potential breakdown below the lower boundary of the red dashed zone. This breakdown signals that technology stocks could continue to lag behind gold in the months ahead.
Moreover, this sustained decline suggests a deeper structural shift in market performance. In particular, it may reflect growing macroeconomic caution, as capital rotates out of high-growth sectors and into real assets. Additionally, the downward projection on the chart demonstrates ongoing bearish pressure. This development aligns with gold’s continued strength and points to a broader reallocation from equities to commodities.
Conclusion: Gold Structural Strength Signals Broader Capital Shift toward Real Assets
Gold remains in a strong uptrend, supported by a clean breakout and rising channel structure. The breakout above multi-year resistance has established the groundwork for continued gains, supported by clear and consistent price movement. A series of higher highs and higher lows confirms that bullish momentum remains intact. As long as gold holds within the channel, the broader technical structure continues to support further upside potential.
At the same time, the Technology-to-Gold ratio has broken down from a long-standing ascending channel. This reversal suggests that capital is rotating out of growth stocks and into real assets. The failure to reclaim the lower boundary confirms continued weakness in tech relative to gold. This persistent decline reflects a growing caution toward growth-heavy sectors and an increasing demand for assets that preserve value in uncertain conditions.
These developments highlight a clear shift in market preferences toward stability and tangible value. Gold’s strong technical setup points to sustained upside potential, while the weakening performance of technology stocks relative to gold confirms this transition. With macro uncertainty still elevated, capital continues to flow into gold as a dependable store of value. Current conditions suggest that gold is now in the early stages of a strong, multi-year uptrend driven by technical strength and shifting capital flows.
Gold Predictors Premium Membership
Get exclusive short-term and swing trade ideas with precise entry levels, stop-loss, and target prices, including justification and analysis — all delivered directly via WhatsApp.
Our premium service includes deep technical analysis on gold and silver markets. We cover cycle analysis, price forecasting, and key timing levels.
Members also receive a weekly market letter with detailed analysis, commentary from our Chief Analyst, including actionable insights, trade timing, and direction forecasts for gold and silver.
Stay ahead of the market — join our premium community today.