


Structural Breakout in Gold Aligns with Bullish Miner Divergence
Gold (XAUUSD) has returned to a critical resistance level after breaking out of a decade-long consolidation. The price is now testing the same trendline that capped the 2011 rally, marking a potential turning point in its long-term direction. This move follows a confirmed breakout from a multi-year inverted head-and-shoulders pattern, backed by strong momentum and persistent buying interest.
At the same time, the ASA-to-Gold ratio shows early signs of reversal, indicating that mining stocks may begin to outperform. These signals point to renewed strength across the precious metals sector and set the stage for further upside.
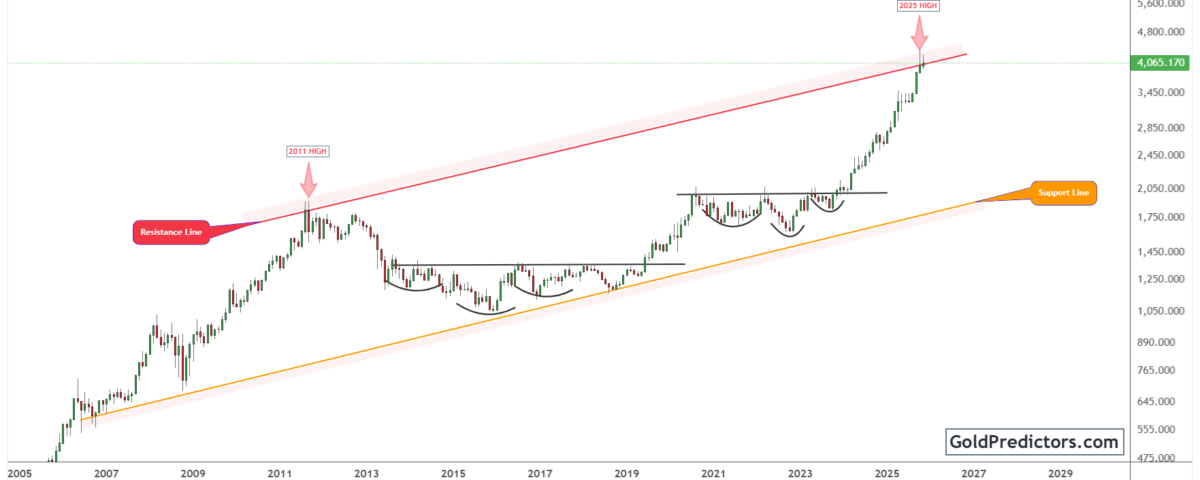
Gold Retests Decade-Long Resistance after Structural Breakout
The gold chart below shows that the price is currently testing a long-standing resistance line drawn from the 2011 high. This resistance capped the major rally in 2011 and has remained intact for over a decade. Gold continues to trade near its 2025 high, but it has yet to close convincingly above resistance. In early 2024, gold decisively closed above neckline resistance, confirming a breakout from a multi-year inverted head-and-shoulders pattern. This move completed a massive, multi-year consolidation structure, indicating the start of a new, long-term bull market phase.
Following the breakout, gold accelerated sharply, with each leg of the rally gaining strength and momentum. The overall structure reflects a steepening trend, driven by increasing momentum and persistent buying pressure. At the same time, price continues to hold above a long-term rising support line from the early 2000s, creating a confirmed structural base for continuation.
Notably, the current setup reflects sustained technical development, supported by strengthening economic trends. It follows years of accumulation, repeated continuation setups, and the successful completion of large inverted head-and-shoulder patterns. This technical alignment is supported by macro drivers, including rate cut expectations, inflation risks, and geopolitical tensions. With price now approaching long-term resistance, the setup favours a breakout and additional upside if current momentum continues to build.
ASA-to-Gold Ratio Reversal Signals New Strength in Mining Stocks
The chart below shows a potential shift in the ASA-to-Gold ratio, suggesting mining stocks may begin to outperform. This ratio tracks the performance of the ASA precious metals fund against gold. It has moved within a broad descending channel for several decades, reflecting the miners’ persistent underperformance. However, a well-defined bottoming structure has now developed near the lower boundary of this long-term channel. This signals a potential shift in leadership within the precious metals sector.
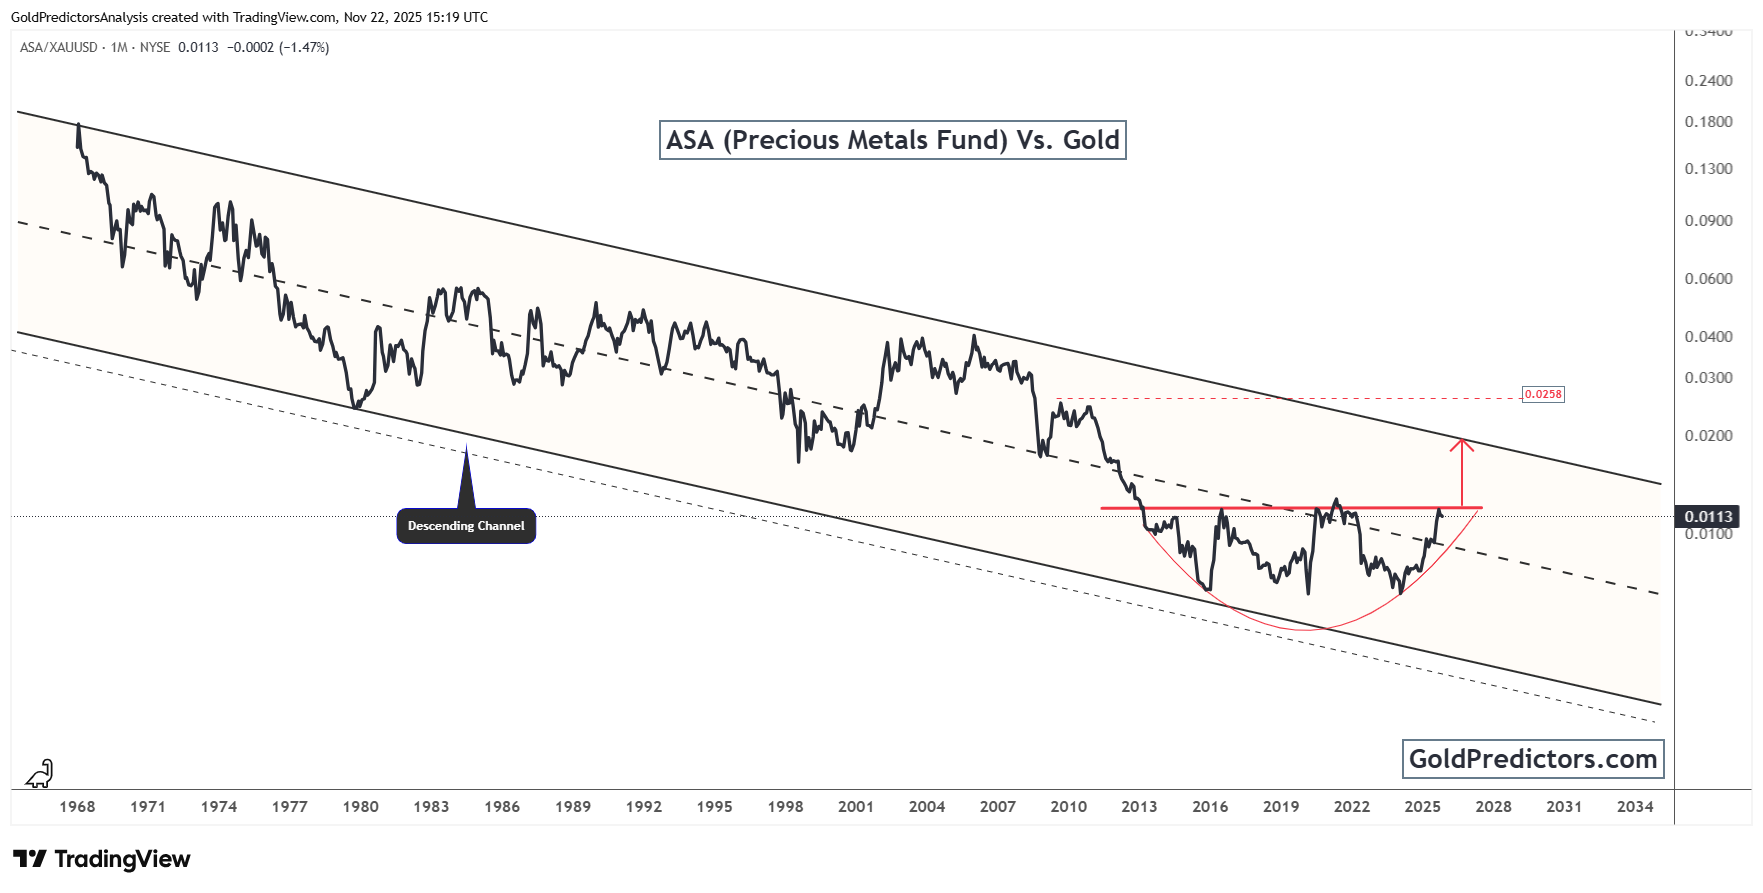
Between 2015 and 2025, the ASA/Gold ratio carved out a classic, rounded bottom structure. This formation suggests a potential reversal after years of decline. The neckline of the pattern lies just above the current level of the ratio. A confirmed breakout above this neckline would validate the bottoming formation and set the stage for a move toward the upper boundary of the long-term channel. A breakout of this kind would signal a major shift in relative performance, with mining stocks likely to outperform gold in the next phase.
Moreover, the broader environment suggests that capital may be shifting toward new areas of opportunity. Mining stocks, which have underperformed for much of the past decade, offer greater sensitivity to price movements and tend to respond more aggressively to rising gold prices. If the ASA-to-Gold ratio continues to stabilise and establish higher lows, it could signal the early stages of a sustained trend in favour of miners. This shift would reflect relative outperformance and increasing capital allocation toward commodity-linked equities.
Conclusion: Gold Retains Momentum as Miners Signal Outperformance Ahead
Gold remains in a powerful uptrend after breaking above a multi-year neckline and entering a steep vertical phase. It is now testing the same long-term resistance line that capped the 2011 rally, a level that has held for over a decade. This retest follows a confirmed breakout from a multi-year inverted head-and-shoulders pattern, backed by strong macro and technical momentum.
At the same time, the ASA-to-Gold ratio is showing early signs of reversal. A well-formed bottoming structure has developed near historic lows. If the ratio breaks above its neckline, it would confirm a new phase of relative strength for mining stocks. This would mark a shift in sector leadership as capital begins flowing into previously underperforming assets.
Overall, the setup shows growing strength in both gold and mining stocks, signalling a broader capital shift. As gold sustains its breakout and miners begin to lead, the environment now favours strategic exposure to both. This dual confirmation strengthens the outlook for continued upside across the precious metals space.
Gold Predictors Premium Membership
Get exclusive short-term and swing trade ideas with precise entry levels, stop-loss, and target prices, including justification and analysis — all delivered directly via WhatsApp.
Our premium service includes deep technical analysis on gold and silver markets. We cover cycle analysis, price forecasting, and key timing levels.
Members also receive a weekly market letter with detailed analysis, commentary from our Chief Analyst, including actionable insights, trade timing, and direction forecasts for gold and silver.
Stay ahead of the market — join our premium community today.


