


Gold Technical Analysis: Structural Breakout and Miner Outperformance Confirm Bull Run
Gold (XAUUSD) has confirmed a significant breakout after years of consolidation. It surged above the long-term resistance levels, including a multi-decade trendline dating back to 1980. This breakout followed a symmetrical triangle that formed between 2011 and 2023. These developments signal a notable shift in the long-term trend. Moreover, strong momentum and rising investor confidence continue to support the rally. Meanwhile, gold miners are also showing renewed strength. These signals suggest that gold has entered a more advanced phase of its long-term bull market.
Gold Breaks Out of Decade-Long Triangle and Surges Above 1980 Resistance Line
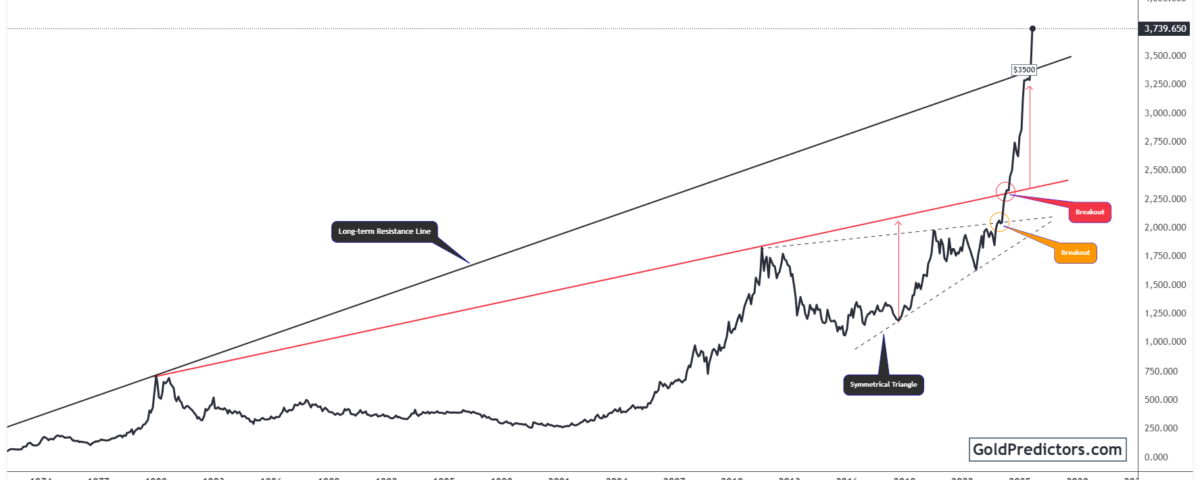
The gold chart below shows a breakout from a multi-year symmetrical triangle that formed between 2011 and 2023. The pattern began developing after gold peaked near $1,900 in 2011. Over the next decade, gold carved out a triangle structure defined by lower highs and higher lows. These formations indicate prolonged consolidation before a decisive breakout.

Following this prolonged consolidation, gold eventually broke out decisively from the triangle. Specifically, the breakout was triggered around the $2,100 level. Then, gold broke above the major resistance trendline that extends from the 1980 high. Notably, this trendline had rejected gold’s advances for over four decades. Therefore, the breakout above this critical level marks a generational shift in market structure.
Consequently, gold has now surged above the $3,500 level, indicating the strength of the breakout. The swift move upward after the breakout highlights strong momentum. This breakout move confirms both the triangle formation and the breach of the long-term trendline. As a result, these patterns now act as firm support, confirming gold’s shift into a new bull-market phase.
Gold Miners Break Out After Decades of Underperformance
The chart below shows the relative strength of mining stocks compared to gold. For over two decades, this ratio has remained in a persistent downtrend. Specifically, a descending trendline connects major lower highs since 2003, reflecting how miners consistently lagged behind gold. This trend underscores how mining stocks have consistently underperformed gold over the long term.

However, the ratio recently broke out above this long-term descending trendline. Notably, this breakout occurred after multiple successful tests of horizontal support. Each test, marked by red arrows, highlighted a strong base forming between 2015 and 2024. The recent surge above the trendline signals that gold miners may finally be entering a period of outperformance relative to gold itself.
Moreover, the sharp rise in the HUI/Gold ratio signals broadening strength across the precious metals sector. Historically, when this ratio rises, it indicates greater investor confidence in the sector and increased profitability for gold miners. As mining stocks begin to outperform gold, it adds further confirmation that the bull cycle has moved into a more mature, momentum-driven phase.
Gold Outlook: Structural Breakout and Miner Outperformance Signal Bull Market Expansion
Gold has entered a powerful new phase in its long-term bull market. Notably, the breakout from the symmetrical triangle and the 1980 trendline confirms a significant structural shift. For decades, these technical barriers had capped price action across multiple cycles. Gold’s decisive breakout signals renewed confidence in its long-term upside. This breakout validates the long-term trend and opens the door to higher price targets.
At the same time, the Gold BUGS Index has also confirmed a breakout relative to gold itself. This move suggests mining stocks are finally beginning to outperform. Historically, this outperformance occurs during periods of strong growth in a gold bull market. Moreover, the rise in the HUI/Gold ratio confirms broader market involvement and growing confidence in mining equities.
Overall, these technical developments point to a more profound structural shift rather than a temporary rally. These signals validate the breakout from a prolonged consolidation and indicate the beginning of a new directional trend. With strong macroeconomic support, rising investor demand, and renewed strength in the mining sector, gold appears well-positioned for sustained gains in the years ahead.
Gold Predictors Premium Membership
Get exclusive short-term and swing trade ideas with precise entry levels, stop-loss, and target prices, including justification and analysis — all delivered directly via WhatsApp.
Our premium service includes deep technical analysis on gold and silver markets. We cover cycle analysis, price forecasting, and key timing levels.
Members also receive a weekly market letter with detailed analysis, commentary from our Chief Analyst, including actionable insights, trade timing, and direction forecasts for gold and silver.
Stay ahead of the market — join our premium community today.


