


Gold vs. Consumer Discretionary: Capital Rotation Fuels Bullish Case for XAUUSD
Gold (XAUUSD) has delivered a decisive breakout after years of structural consolidation. The monthly chart highlights a textbook cup-and-handle formation supported by dual ascending channels. This breakout aligns with a decisive shift in relative performance, as shown in the Consumer Discretionary vs. Gold ratio. Together, the technical and intermarket signals suggest that gold is entering a new long-term bullish phase. With momentum building across asset classes, the yellow metal appears well-positioned for continued strength.
Gold Breaks above Structural Resistance within Multi-Decade Ascending Channel
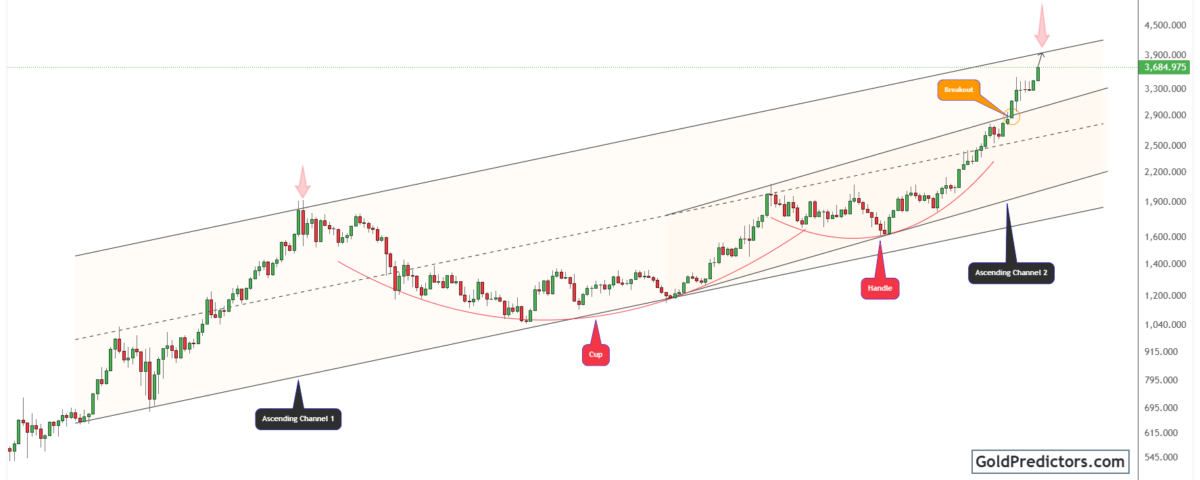
The gold chart below shows multiple ascending channels on a monthly timeframe. Between 2007 and 2011, the price climbed gradually within a rising channel. After peaking near the top boundary, gold entered a multi-year consolidation. This led to the formation of a textbook cup-and-handle structure. After retreating from a significant high, gold formed a classic cup and handle pattern, then entered a handle phase marked by tight price consolidation.
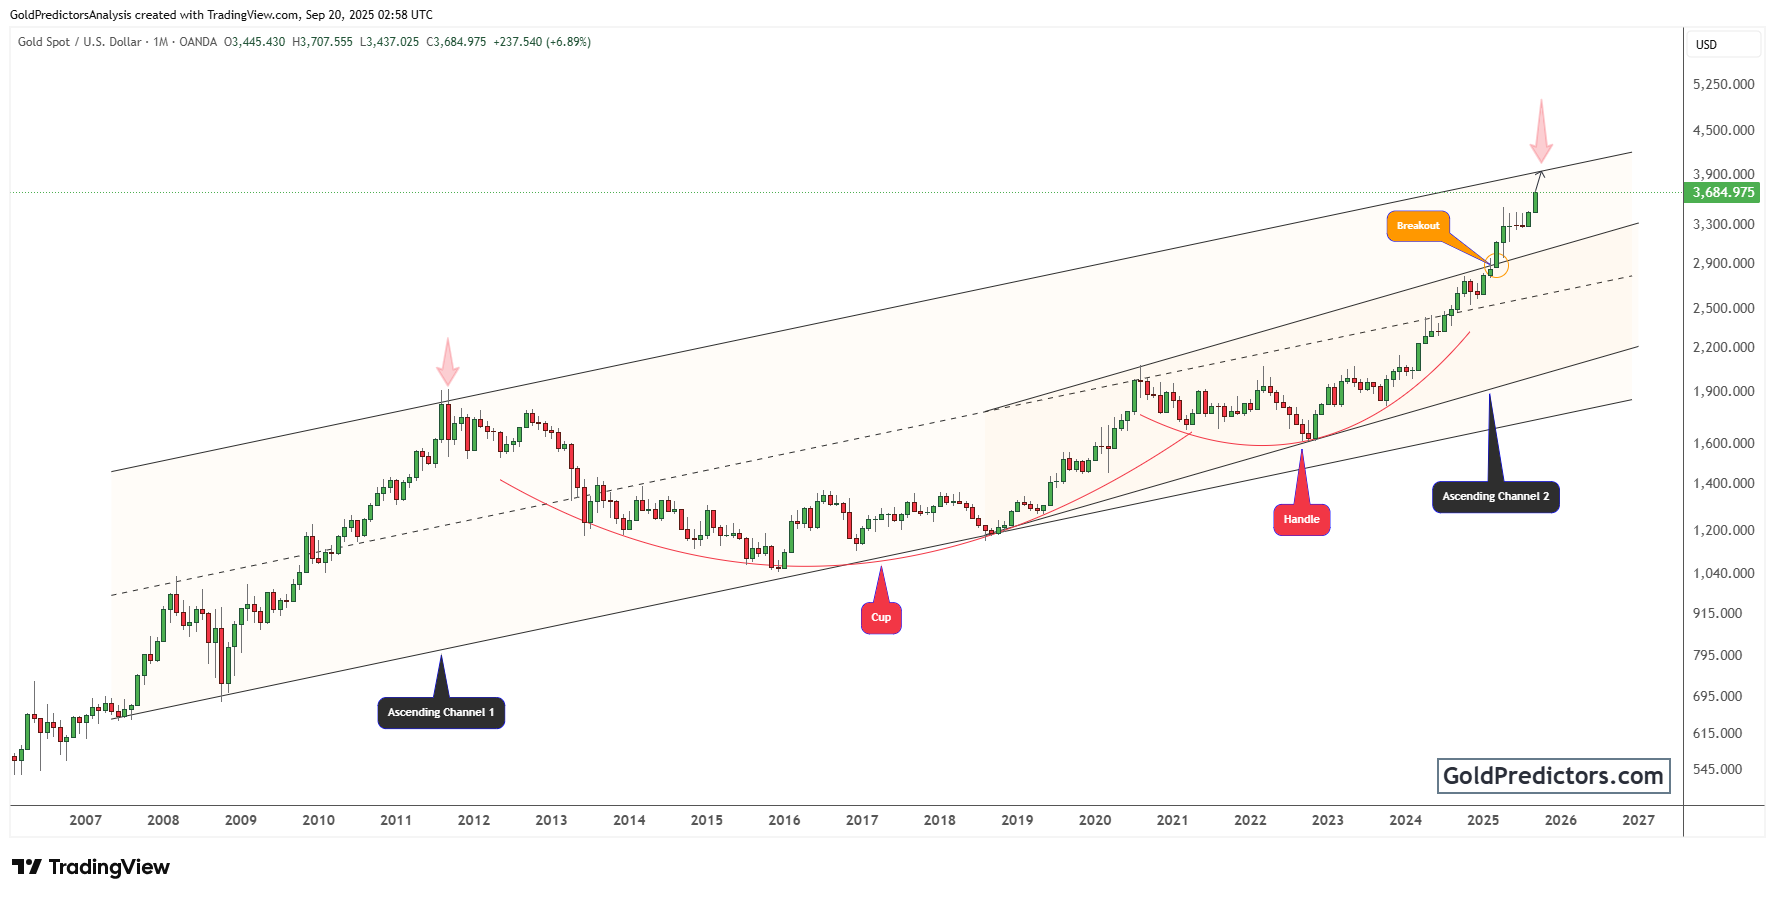
At the beginning of 2025, gold broke out of the handle with strong momentum. Subsequently, the price surged above the midpoint of the second ascending channel and is now trading near the breakout zone. This breakout confirms the technical structure and opens the door for further gains. Gold is now advancing toward the upper boundary of the broader channel. If the move continues, the price could target the $4,000–$4,300 zone based on the height of the cup and the width of the channel.
Furthermore, the decisive breakout above the handle and channel midpoint signals a major bullish continuation. Following this breakout, gold exits consolidation and enters a sustained rally. In addition, price action remains well-supported, indicating persistent strength in the ongoing uptrend. As momentum builds, gold appears set to advance further within its broader bullish trend.
Gold’s Outperformance over Discretionary Confirms Capital Rotation Trend
The chart below shows the Consumer Discretionary (XLY) to gold ratio, emphasising the sector’s relative performance. Notably, it highlights a clear structural breakdown, with gold now outperforming discretionary equities. Since peaking in 2022, the ratio has entered a steady decline. Following a breakdown of its multi-year support in early 2025, the XLY/Gold ratio signalled a sustained bearish trend.

Consequently, the trend suggests a defensive shift, with investors reallocating capital from equities to gold. Moreover, the decline signals reduced exposure to discretionary sectors in favour of more stable, value-preserving assets. Typically, these rotations occur in late-cycle environments, particularly during periods of monetary easing or heightened macroeconomic uncertainty.
Additionally, the prominent red arrow points to ongoing weakness in the ratio, suggesting that gold may continue to outperform discretionary stocks in the near term. This deepening shift highlights gold’s increasing importance as a defensive asset in uncertain market conditions. More broadly, it reflects a move toward assets that offer stability, protection, and long-term value preservation.
Gold Outlook: Breakout Structure and Capital Flows Reinforce Bullish Trend
Gold has entered a powerful new phase after breaking out of its multi-year cup-and-handle formation. This move confirms the end of a prolonged consolidation and signals the beginning of a sustained uptrend. The breakout above the handle and midpoint of the broader channel indicates firm technical conviction, supporting a bullish continuation. Price action remains well-supported, with rising momentum suggesting further upside potential.
At the same time, gold’s outperformance against the Consumer Discretionary sector reinforces the macro case for hard assets. Meanwhile, the ongoing drop in the XLY/Gold ratio signals a clear shift away from growth stocks toward gold. This weakening trend reflects capital rotation driven by rate cuts and heightened market volatility. As market conditions become increasingly unpredictable, interest in stable, value-retaining assets like gold is on the rise.
Looking ahead, gold appears well-positioned for continued gains. The combined weight of technical patterns, market relationships, and macroeconomic forces suggests further upside. With the $4,000–$4,300 zone approaching, gold remains a top-performing asset in today’s evolving macro environment.
Gold Predictors Premium Membership
Get exclusive short-term and swing trade ideas with precise entry levels, stop-loss, and target prices, including justification and analysis — all delivered directly via WhatsApp.
Our premium service includes deep technical analysis on gold and silver markets. We cover cycle analysis, price forecasting, and key timing levels.
Members also receive a weekly market letter with detailed analysis, commentary from our Chief Analyst, including actionable insights, trade timing, and direction forecasts for gold and silver.
Stay ahead of the market — join our premium community today.


