


Silver Technical Analysis: Multi-Decade Breakout Targets $50 as Momentum Builds
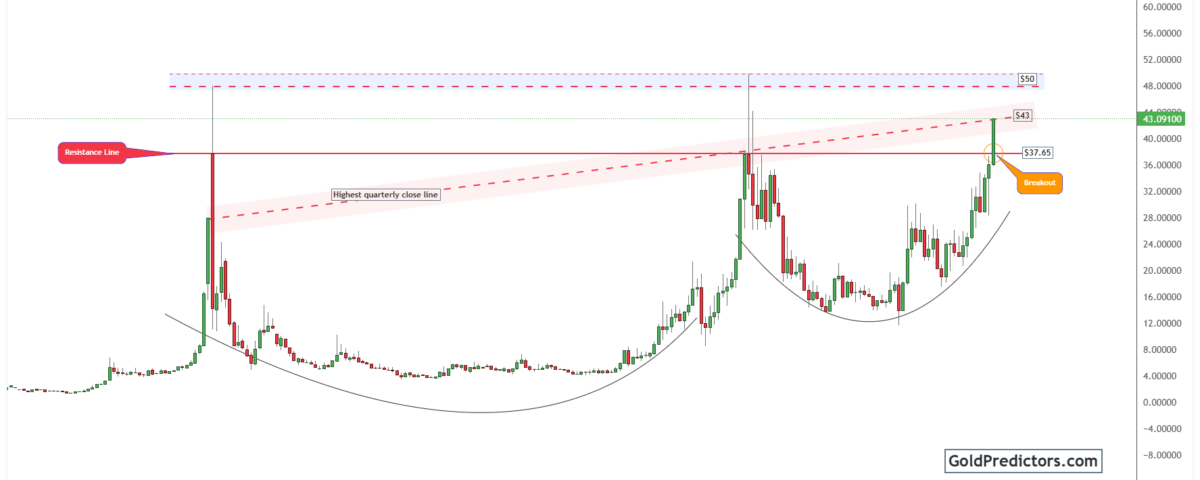
Silver (XAGUSD) has delivered a major technical breakout after decades of consolidation. The metal broke through a key resistance level, marking a significant change in market dynamics. A long-term cup formation provides strong structural support for this move. Moreover, the push toward $43 validates the breakout and sets the stage for additional upside.
At the same time, the Silver/Dow ratio is rising, signalling silver’s growing strength relative to equities. This development underscores silver’s outperformance over key levels and benchmarks, which is drawing increased attention from market participants. This breakout could signal the start of a sustained long-term uptrend.
Silver Confirms Multi-Decade Breakout from Long-Term Resistance Zone
The silver chart below shows a multi-decade cup formation that has been developing since the sharp 1980 peak. Over the past four decades, silver has moved within this rounded arc. The highs in 1980 and 2011 mark the upper boundary of this structure. This prolonged structure highlights a period of extended consolidation, setting the stage for a potential breakout.

Recently, silver decisively broke above the key resistance zone near $37.65. Notably, this level represented not only the highest quarterly close but also a central horizontal ceiling that had capped prices for years. Consequently, silver rallied to $43 with strong momentum, signalling a confirmed breakout above long-standing resistance. This technical breakout reflects a structural shift and signals renewed strength in the market.
Importantly, this breakout is significant from both a technical and psychological perspective. After decades of consolidation, silver has finally breached a generational resistance level. The current momentum suggests silver could reprice quickly, with $50 now appearing as the next primary target. Furthermore, the cup formation and sustained momentum strengthen the bullish case for silver’s long-term outlook. Historically, similar breakout patterns in 1980 and 2011 resulted in rapid gains, supporting the outlook for a sustained long-term advance.
Silver Set to Outperform Equities as Historical Ratio Approaches Breakout
The chart below shows the Silver/Dow Jones Industrial Average ratio, highlighting silver’s relative performance against equities. A rising ratio indicates that silver is outperforming the broader stock market. It provides valuable insight into how capital rotates between hard assets and the broader stock market. The ratio often captures larger macroeconomic developments such as rising inflation, shifting monetary policy, or increased market uncertainty.

Notably, the chart displays a long-term base structure characterized by a triangular pattern that has been evolving since the 1990s. Over the past few years, the ratio has been coiling within this structure and is now approaching a key resistance level near 0.0012.
Additionally, the setup resembles a double-bottom or rounded base, which further reinforces the underlying strength of the pattern. If the ratio breaks above 0.0012, it could then trigger a sharp move toward the 0.004 level. Historically, similar breakouts in silver-to-equity ratios have signalled strong commodity performance. These movements also tend to reflect broader macro shifts, particularly in inflationary or uncertain economic environments.
Moreover, the rising trend in this ratio strengthens the broader case for silver outperformance. Silver is strengthening not only in absolute terms but also relative to broader equity indices. These conditions make silver a more compelling hedge and alternative store of value. Traditionally, it performs well in environments shaped by dovish central banks, policy realignments, or global risk events.
Silver Outlook: Bullish Momentum Builds toward $50 Target
Silver has entered a new phase after breaking through a multi-decade resistance zone. This breakout confirms the completion of a massive structural base that took shape over 40 years. Its current position near $43 reinforces the breakout and suggests silver is now in the early stages of a long-term upward cycle.
Furthermore, silver’s strength is evident not just in its price action, but also in its rising edge over traditional equity benchmarks. The Silver/Dow ratio is rising and approaching a key breakout point. This suggests a possible rotation of capital from equities into hard assets like silver, particularly during periods of macro uncertainty. A confirmed breakout in this ratio could accelerate silver’s relative performance and reinforce its leadership in a changing market landscape.
Technically, silver maintains a strong position. The parabolic formation, rising Silver/Dow ratio, and sustained breakout all suggest room for further upside. Silver is well-positioned to outperform as it eyes the $50 level, supported by monetary easing, inflation concerns, and evolving market dynamics.
Gold Predictors Premium Membership
Get exclusive short-term and swing trade ideas with precise entry levels, stop-loss, and target prices, including justification and analysis — all delivered directly via WhatsApp.
Our premium service includes deep technical analysis on gold and silver markets. We cover cycle analysis, price forecasting, and key timing levels.
Members also receive a weekly market letter with detailed analysis, commentary from our Chief Analyst, including actionable insights, trade timing, and direction forecasts for gold and silver.
Stay ahead of the market — join our premium community today.


