


Silver Surges on Technical Breakout—Why $50 Could Be Just the Start
Silver (XAGUSD) is displaying strong bullish momentum in 2025, supported by clear technical and macroeconomic signals. On both the weekly and long-term charts, the metal has broken decisively above decade-long resistance levels, marking a significant shift in market structure. A successful retest of the breakout zone has reinforced this move, adding to its credibility. Moreover, the inverse head and shoulders and a cup and handle formation point toward the development of a powerful upward trend. The increment in the trading volumes and a constructive price structure further strengthen this outlook. These factors suggest that silver may be entering a sustained and potentially significant bull cycle.
Silver Price Breaks Resistance with Inverse Head and Shoulders Pattern
The silver chart below shows a decisive breakout above a long-standing resistance trendline. This trendline connects significant peaks from 2016 and 2020 and was recently tested again in 2025. Silver broke above this resistance and moved close to $44 before slightly pulling back to the $36.65 level. This correction appears to be a retest of the breakout zone. It is a common occurrence in technical analysis that precedes a larger move.
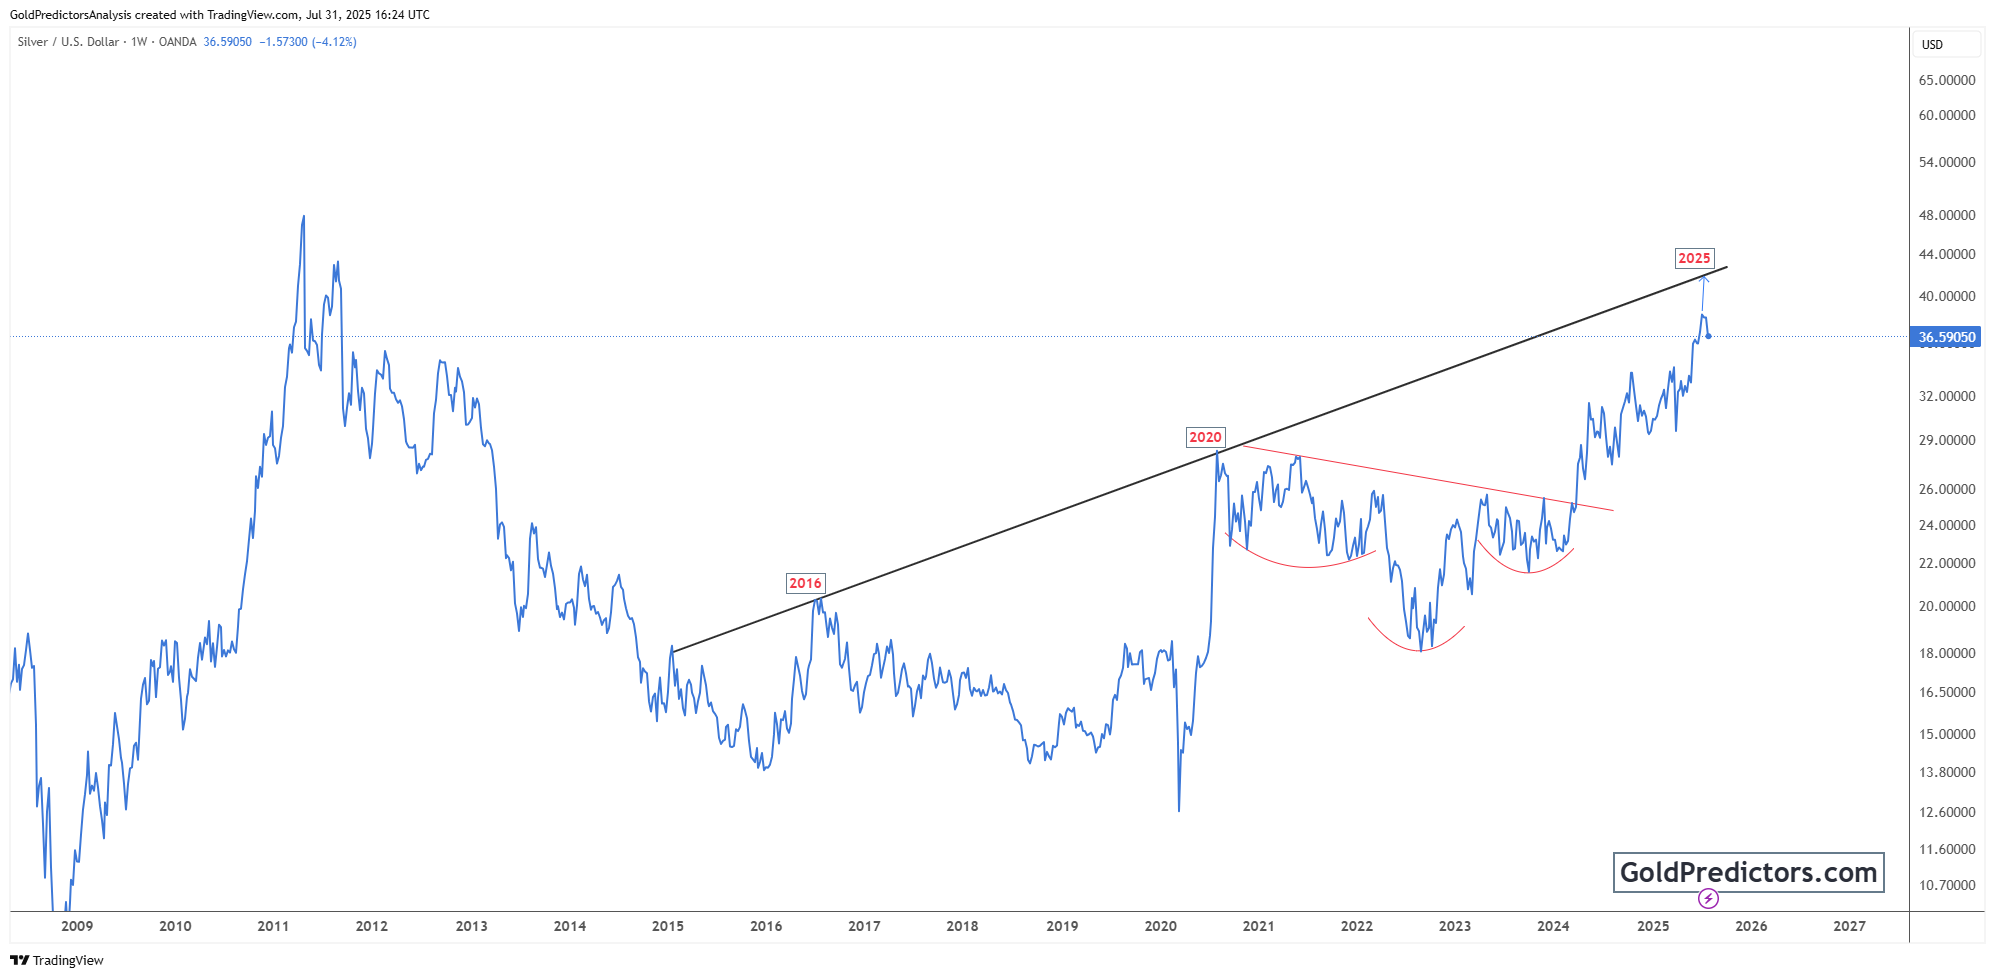
The chart also displays a multi-year inverse head and shoulders pattern that formed between 2021 and 2024. This bullish reversal pattern further strengthens the case for continued upside. The breakout above the neckline in early 2024 triggered a rally that led to the recent highs. The psychological level of $36 now acts as a support level, and holding this range will be key for bulls.
The price structure suggests strong momentum, especially since silver has broken out of a consolidation range that lasted several years. If the breakout holds, silver could revisit and even surpass its 2011 highs near $50 in the coming months.
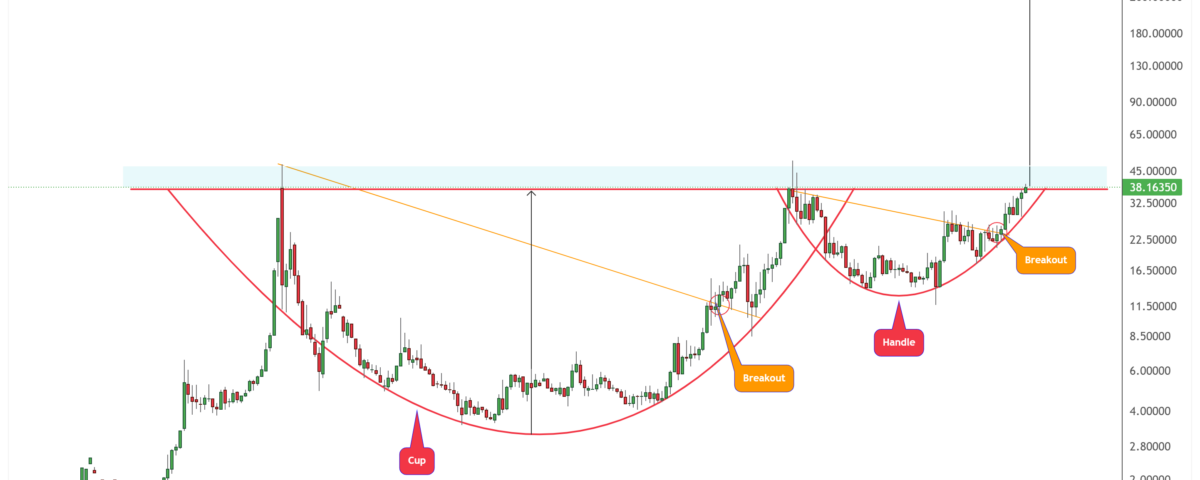
Long-Term Cup and Handle Pattern Suggest Silver Surge
The silver chart below shows a large-scale formation of the cup-and-handle pattern, indicating a strong bullish trend. This pattern began to form in the late 1970s, with the cup rounding out over several decades, and the handle emerging in recent years. In 2025, silver decisively broke out above the handle resistance zone, which historically capped prices near the $35–$40 range.
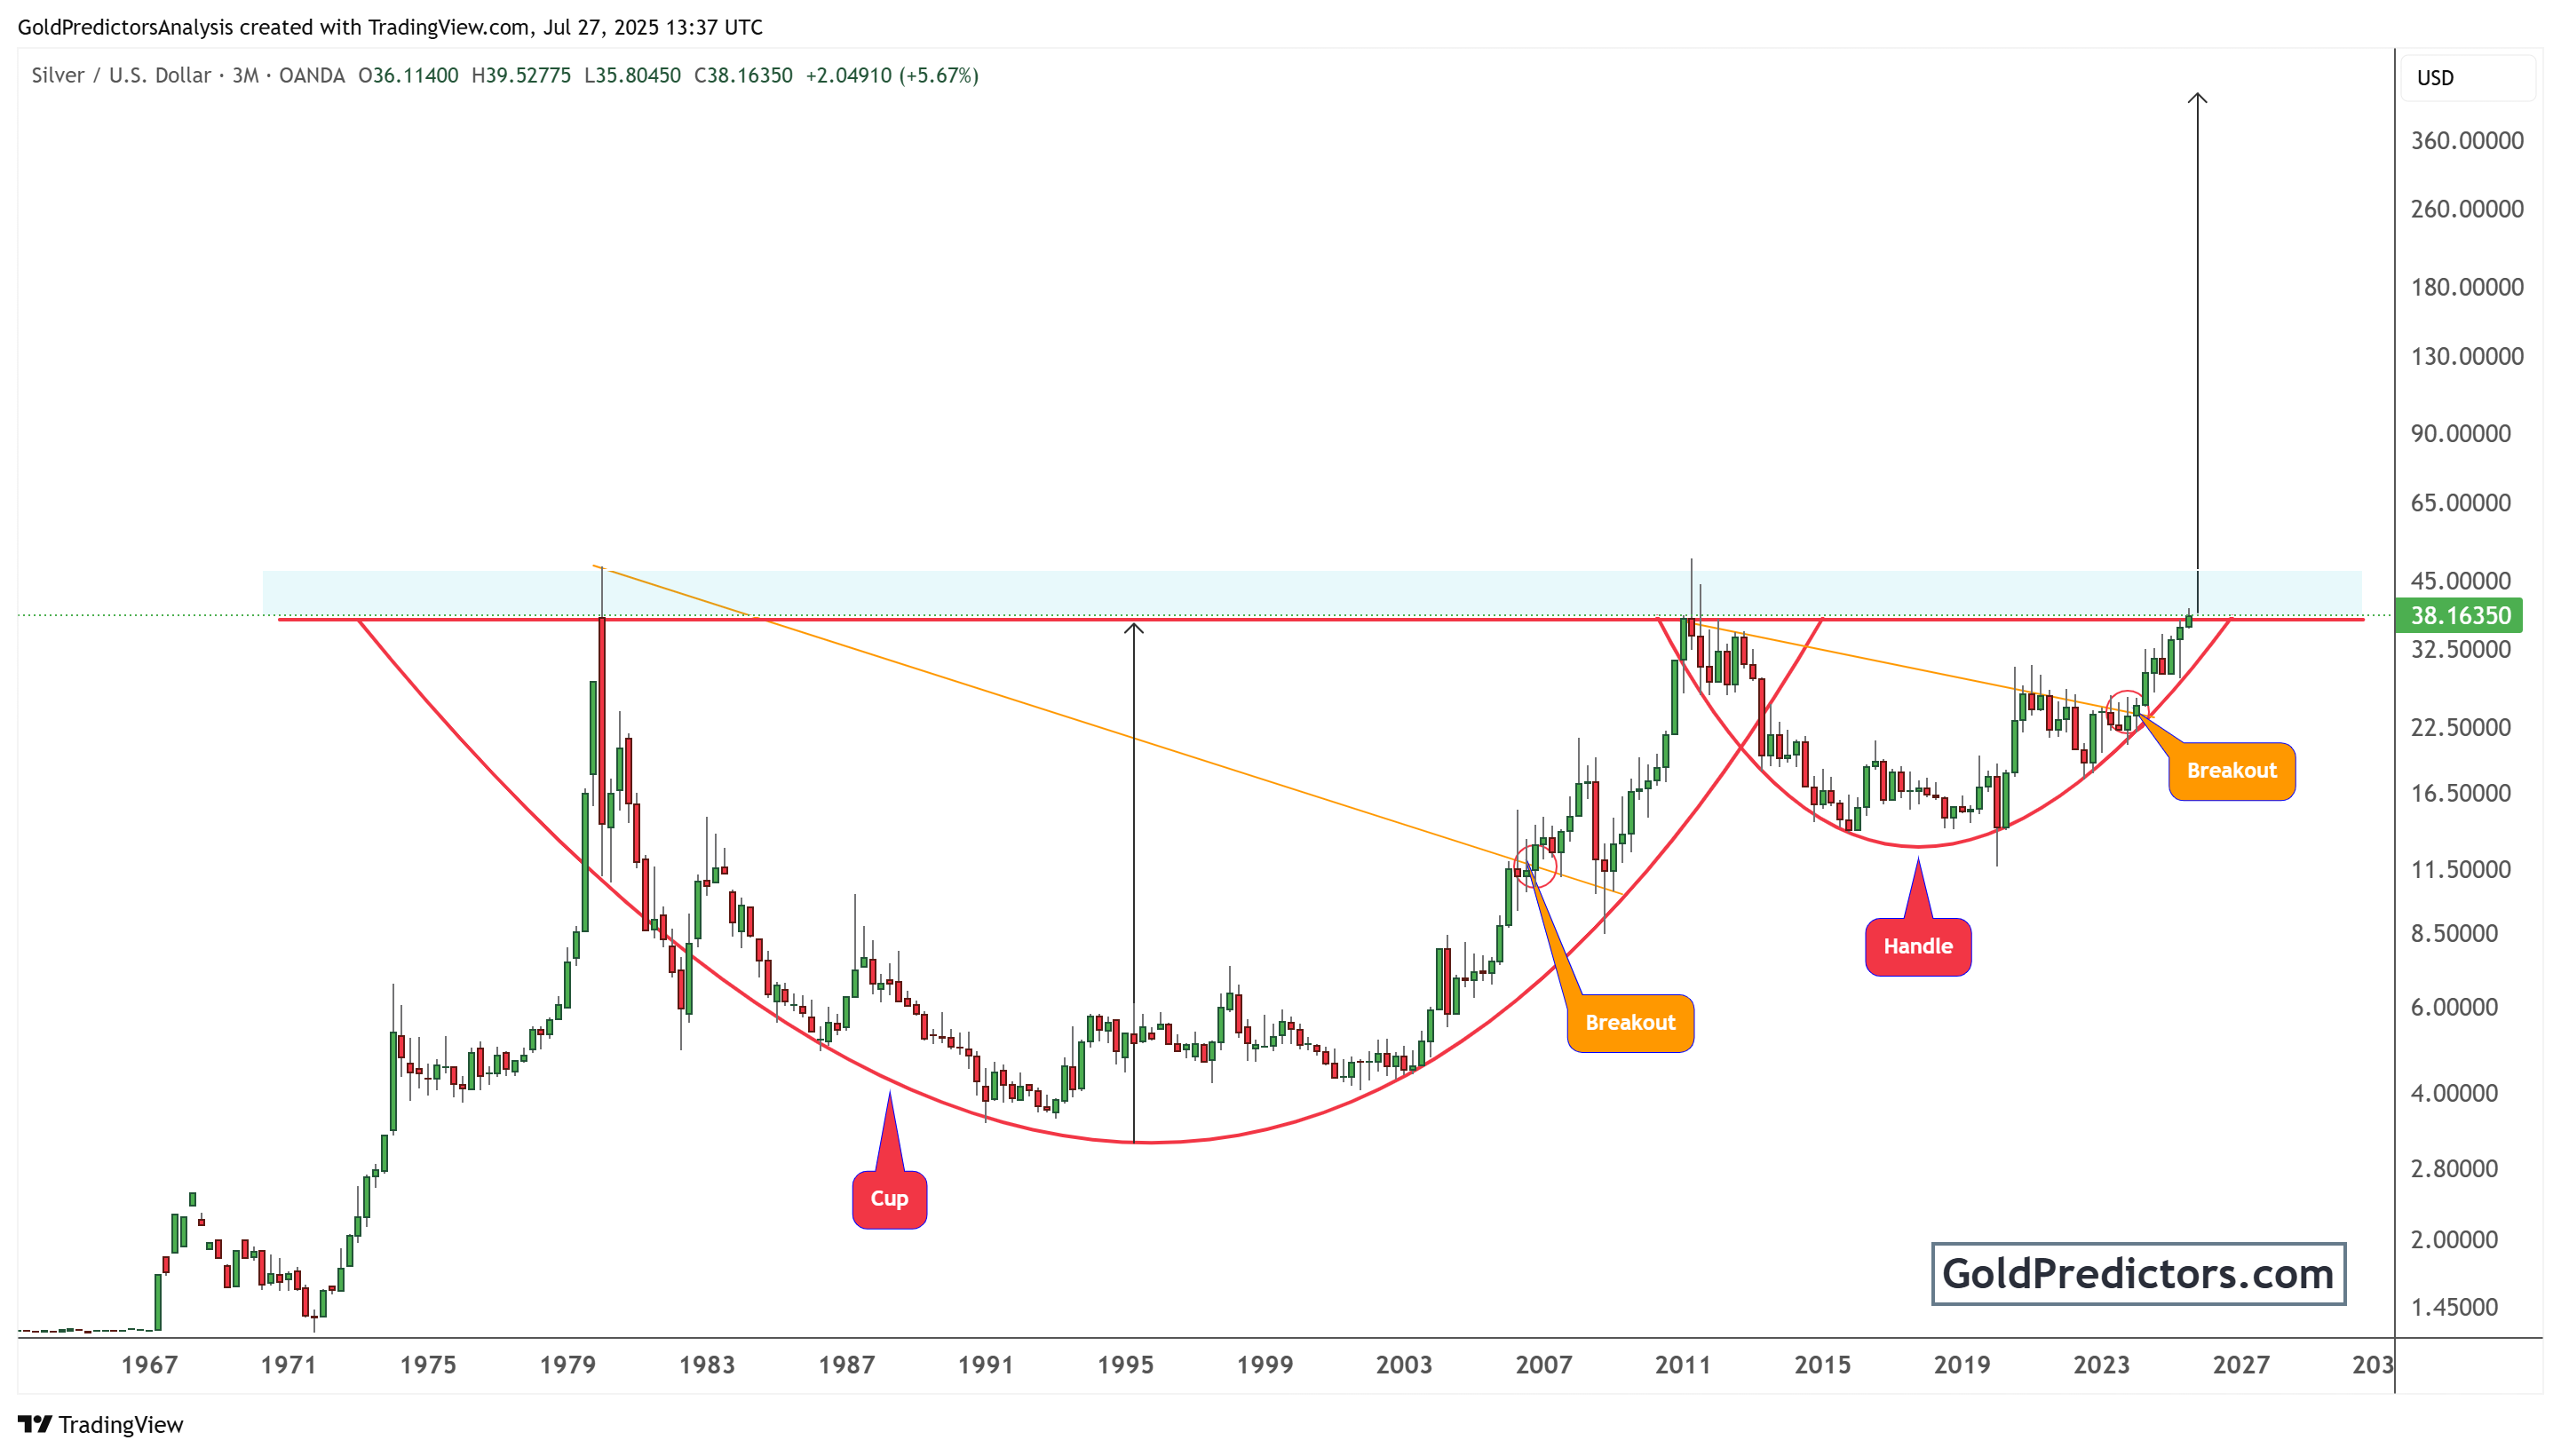
This breakout is significant not just because of its technical validity, but also due to the massive base it represents. The height of the cup suggests a potential long-term price target of over $100. Rising volume and a series of higher lows add strength to the breakout signal.
The chart reveals two significant breakout moments. One occurred around 2006–2007 and led to the rally toward $49 in 2011. Another breakout in 2025 could similarly fuel a decisive move. These patterns typically signal the start of an intense bullish phase in commodity cycles. Silver’s function in both the industrial sector and as an inflation shield amplifies the relevance of this setup. It could align with macroeconomic drivers such as shifts in monetary policy and rising demand for green technologies.
Conclusion: Silver’s 2025 Breakout Confirms Bullish Outlook and Long-Term Upside Potential
Silver’s breakout in 2025 marks a significant turning point for both its technical and market outlook. The metal has decisively cleared long-standing resistance levels, confirming a bullish reversal backed by well-recognised chart patterns. Notably, the inverse head and shoulders formation and a successful retest near the $36 level highlight a solid base for further upside.
The long-term cup and handle pattern adds weight to the bullish case. This decades-long formation points to significant upside potential well above past highs. Historically, similar breakouts have triggered explosive rallies, and the current setup in 2025 may follow the same path. Rising trading volumes and a series of higher lows reflect strong market participation and growing investor confidence.
Silver’s unique position as both an industrial commodity and a hedge against inflation makes this breakout especially important. Structural trends, such as the global shift toward green energy and changes in monetary policy, could accelerate the rally. If silver maintains its breakout zone, the stage is set for a robust and sustained bull run. A move toward $50—and potentially beyond—now appears increasingly likely.
Gold Predictors Premium Membership
Get exclusive short-term and swing trade ideas with precise entry levels, stop-loss, and target prices, including justification and analysis — all delivered directly via WhatsApp.
Our premium service includes deep technical analysis on gold and silver markets. We cover cycle analysis, price forecasting, and key timing levels.
Members also receive a weekly market letter with detailed analysis, commentary from our Chief Analyst, including actionable insights, trade timing, and direction forecasts for gold and silver.
Stay ahead of the market — join our premium community today.


