


Gold to Silver Ratio Reversal: Why Silver Could Outperform Gold in 2025
Gold has broken out of a decades-long cup and handle pattern, signalling the start of a powerful long-term bull run. This bullish breakout developed at $2,075 and pushed prices to $3,500 in 2025, with targets now ranging to $4,000 and from $6,000. At the same time, the Gold to Silver Ratio has reversed from historic highs, pointing to a stronger bullish phase for silver. These combined technical signals suggest a major opportunity in precious metals. Gold shows steady long-term strength, while silver appears poised for faster and more aggressive gains.
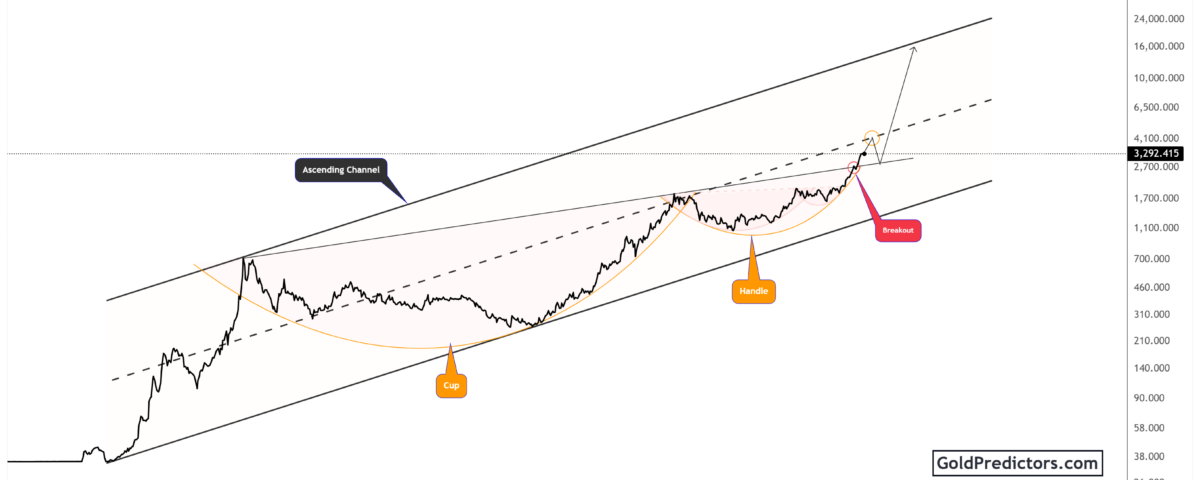
Gold’s Multi-Decade Cup and Handle Breakout Signals Long-Term Bull Market
The gold chart below shows a long-term view of the market, stretching back to the 1960s. This chart highlights a massive ascending channel, within which gold has been trading for decades. What stands out is the clear formation of a cup and handle pattern, which is a well-known bullish continuation formation.
The cup formed between 1980 and 2011, with a gradual U-shaped recovery that bottomed around the 1990s. The handle emerged in the years following 2011, marked by a period of consolidation and a reaccumulation phase. This classic formation has now resulted in a breakout above the handle, as shown on the chart. The breakout confirms a strong long-term bullish trend and suggests the beginning of a new phase of price discovery for gold.
The breakout was developed around the $2,075 and $2,400 levels, and pushed gold to record levels. This price movement aligns with the upper boundary of the channel, signalling further upside potential. Projections based on the channel pattern and breakout momentum suggest gold could reach $4,000 in 2025. Based on the bullish price action, the targets of $6,000 and $10,000 are not imaginary. The ongoing geopolitical conditions and global trade war could create an economic crisis, which could push gold to those targets. This technical setup provides long-term investors with a strong case to remain bullish on gold.
Gold to Silver Ratio Reversal Signals Silver’s Outperformance Ahead
The chart below shows the Gold to Silver Ratio (GTS), a key indicator that compares the relative strength of gold against silver. Historically, when the GTS peaks and begins to decline, it signals a period when silver tends to outperform gold. This inverse relationship has made the GTS a reliable tool for anticipating shifts in precious metals performance.
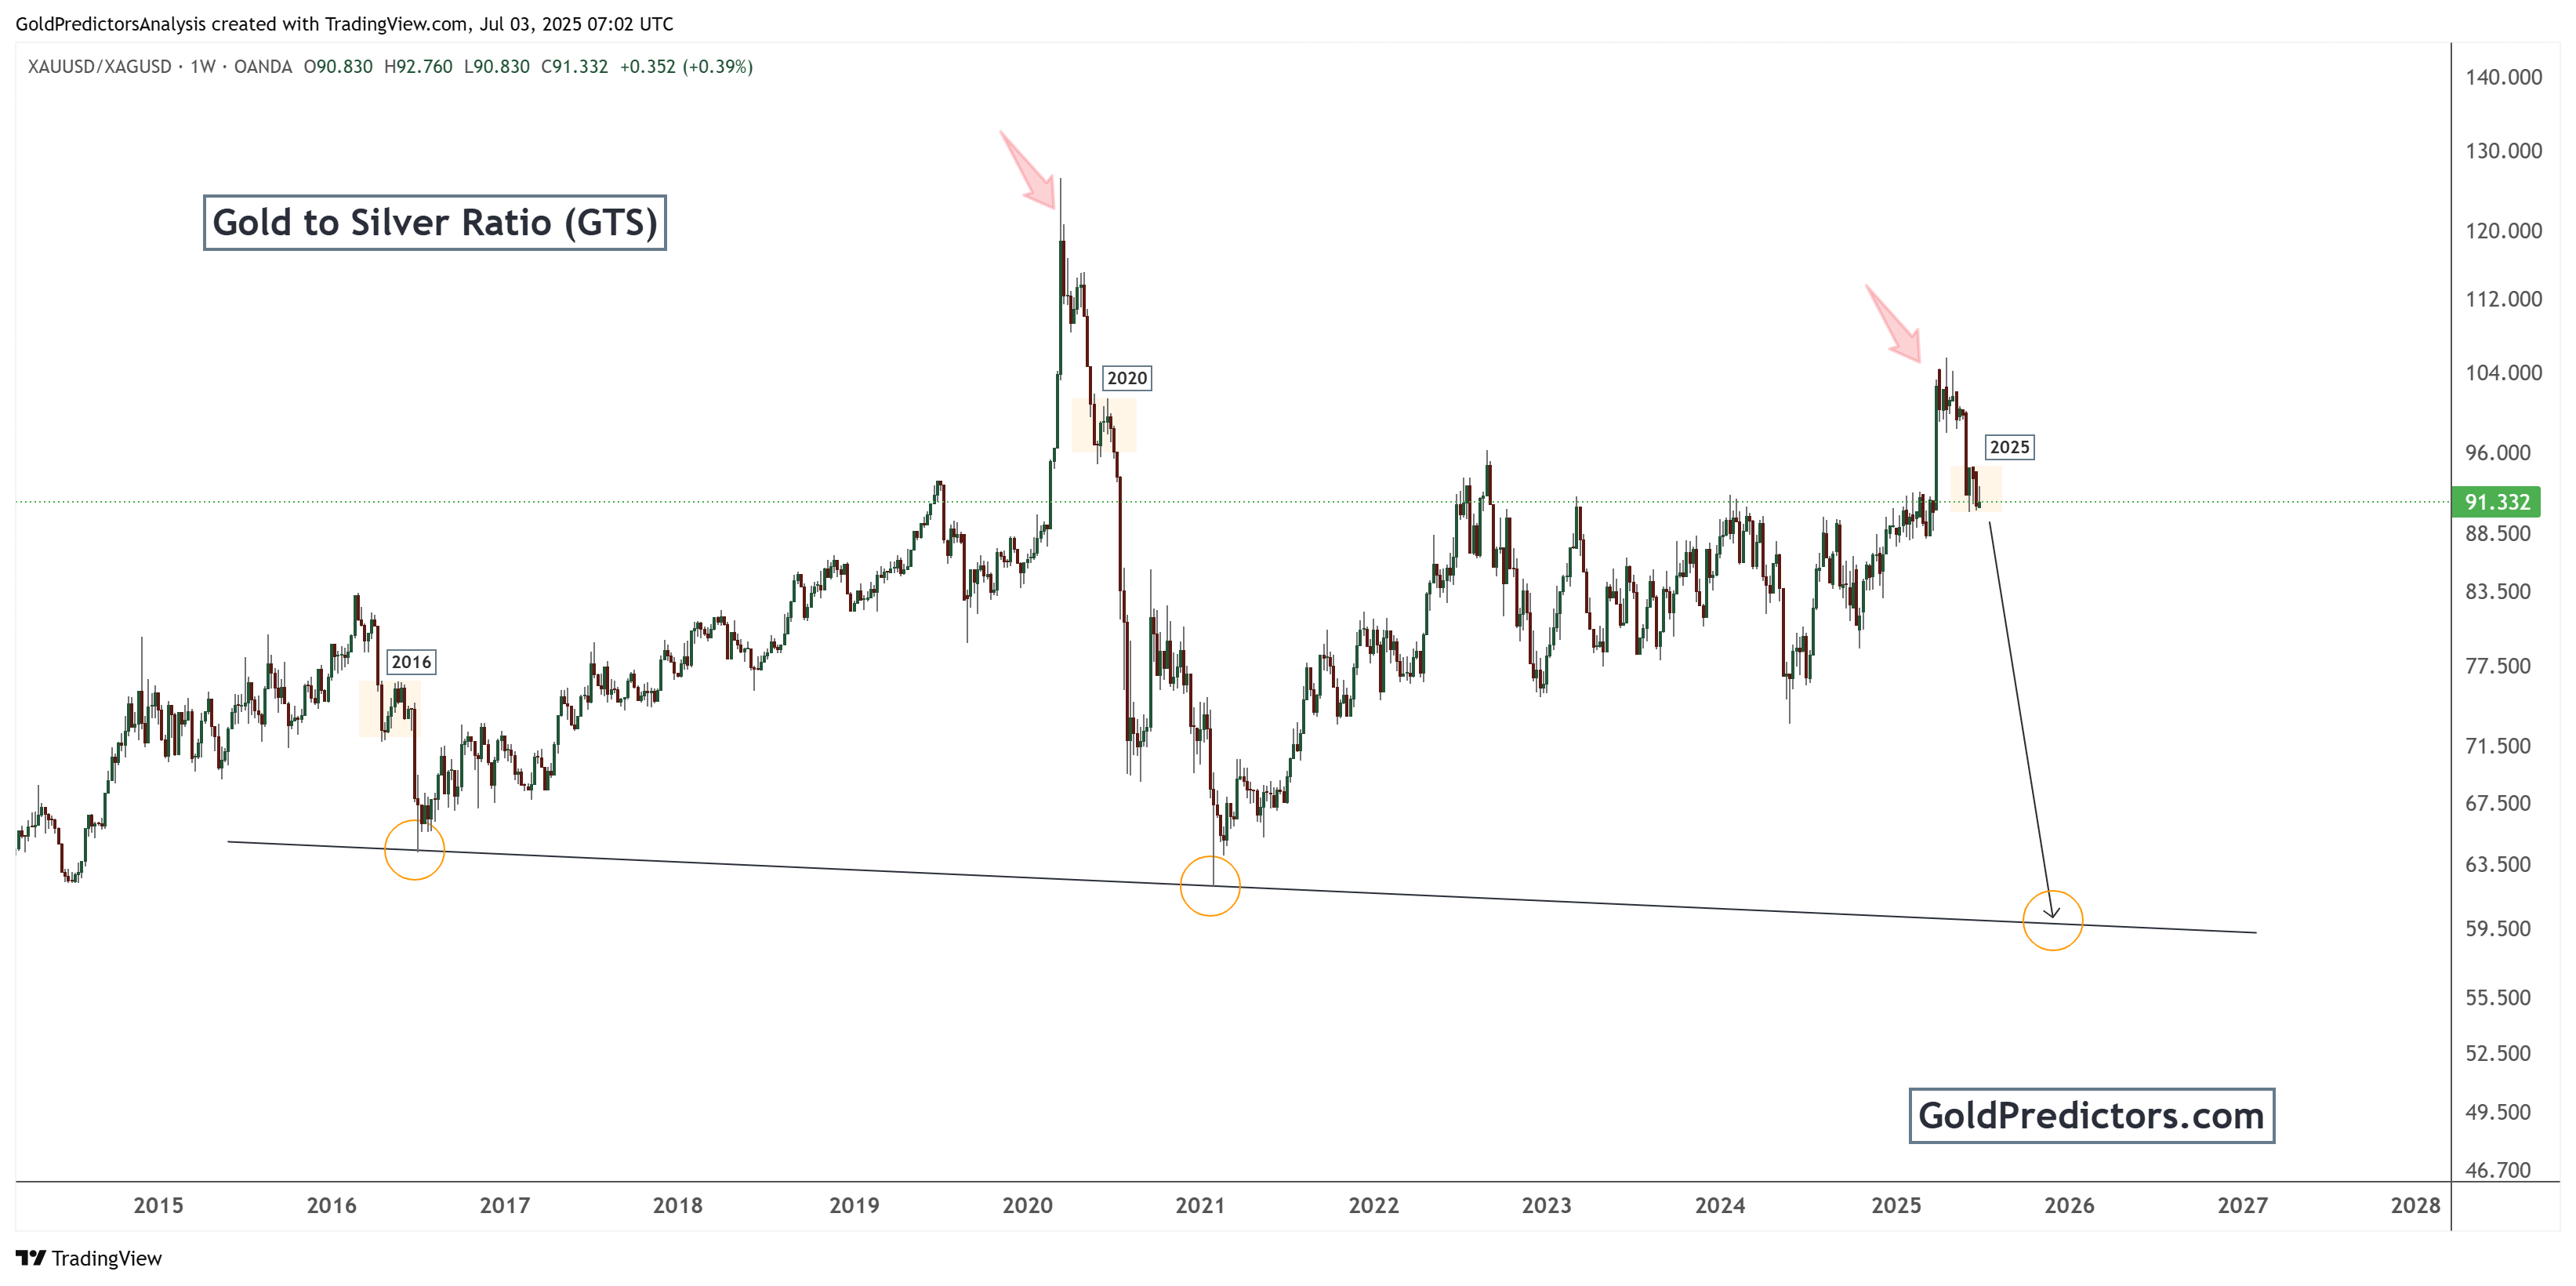
The chart highlights three major peaks in the GTS, occurring in 2016, 2020, and most recently in 2025. Each of these peaks was followed by a sharp decline, indicating silver’s relative strength. In 2025, the ratio rose above 100 before starting to fall sharply, now sitting near 91. Based on past behaviour and the lows marked by orange circles on the chart, a further drop toward the 60–65 range appears likely.
This trend suggests that silver may be entering a stronger bullish phase than gold, with the potential for faster and larger gains. The downward-sloping trendline connecting previous lows adds further weight to this analysis. If the ratio continues its descent toward that line, silver could significantly outperform, driven by rising industrial demand and renewed retail interest.
Conclusion: Gold Breakout and Silver Strength Confirm Precious Metals Bull Market
Gold’s long-term technical setup points to a sustained bullish trend. The breakout from the decades-long cup and handle formation supports strong upside momentum. This pattern signals a shift into a new phase of long-term price discovery, with targets ranging from $6,000 to as high as $10,000 per ounce.
At the same time, the Gold to Silver Ratio indicates a powerful reversal in silver’s favour. Historical peaks in the ratio have reliably preceded strong silver rallies. With the ratio now declining from above 100 toward historical support levels, silver is likely to outperform gold in the coming years. The biggest barrier in silver is $50. A break above $50 in spot silver will take silver for a parabolic ride.
Together, these signals suggest a major opportunity for precious metals investors. Gold appears primed for a steady climb, while silver may offer faster, more aggressive returns. Investors should closely monitor these patterns as both metals move into their next major cycle.
Gold Predictors Premium Membership
Get exclusive short-term and swing trade ideas with precise entry levels, stop-loss, and target prices, including justification and analysis — all delivered directly via WhatsApp.
Our premium service includes deep technical analysis on gold and silver markets. We cover cycle analysis, price forecasting, and key timing levels.
Members also receive a weekly market letter with detailed analysis, commentary from our Chief Analyst, including actionable insights, trade timing, and direction forecasts for gold and silver.
Stay ahead of the market — join our premium community today.


