Silver Price Poised for Major Surge as Long-Term Patterns Align | Gold Predictors - Forecasting Gold Prices

New York

London

Sydney

Tokyo

Log In

  • Register
  • Lost your password?
gold predictorsgold predictorsgold predictorsgold predictors
  • HOME
  • ABOUT US
    • About Us
    • Social Networks
    • Industry Links
    • Testimonials
    • News & Updates
  • RESEARCH
    • Scientific Trade Strategies
    • Gold Hub
    • Gold Importance
    • Silver Importance
  • GOLD HUB
  • GOLD ANALYSIS
    • Gold Analysis
    • Technical Analysis
      • Trend Identification
      • Phase Identification
      • Important Levels
      • Volatility Measurement
    • Gold Cycle
      • Short Term Cycles
      • Medium Term Cycles
      • Long Term Cycles
    • Price Action Analysis
      • Phase Identification
      • Historical Pattern Identification
      • Candlestick Pattern Identification
    • Fundamental Analysis of Gold
    • Gold Related Markets Analysis
    • Gold Seasonal
  • TRADING METHODOLOGY
    • Gold Analysis
      • Technical Analysis
      • Gold Cycle
      • Price Action Strategy
      • Fundamental Analysis
      • Gold Related Markets Analysis
      • Gold Seasonal
    • Measure Signal Strength
      • Weak Signal
      • Strong Signal
      • Confirmed Signal
    • Trading Decision
    • Trading Rules
      • Basic Trading Rules
      • Gold Predictors Trading Rules
    • Trade Examples
    • Performance
  • LIVE CHARTS
  • MEMBERSHIPS
    • Free Membership
    • Premium Membership
    • SignUp
  • MEMBERS AREA
    • Free Article
    • Premium Article
    • Trading Signals
    • Long Term Signals
    • Forex Reports
    • Crypto Reports
  • FOREX REPORTS
  • HELP
    • FAQ
    • Contact Us
Login / Register

Silver Price Poised for Major Surge as Long-Term Patterns Align

0
Published by admin at May 23, 2025
Categories
  • Free Articles
Tags
  • day trading
  • dollar
  • forex
  • silver
  • trading signal
  • US Dollar
silver pattern

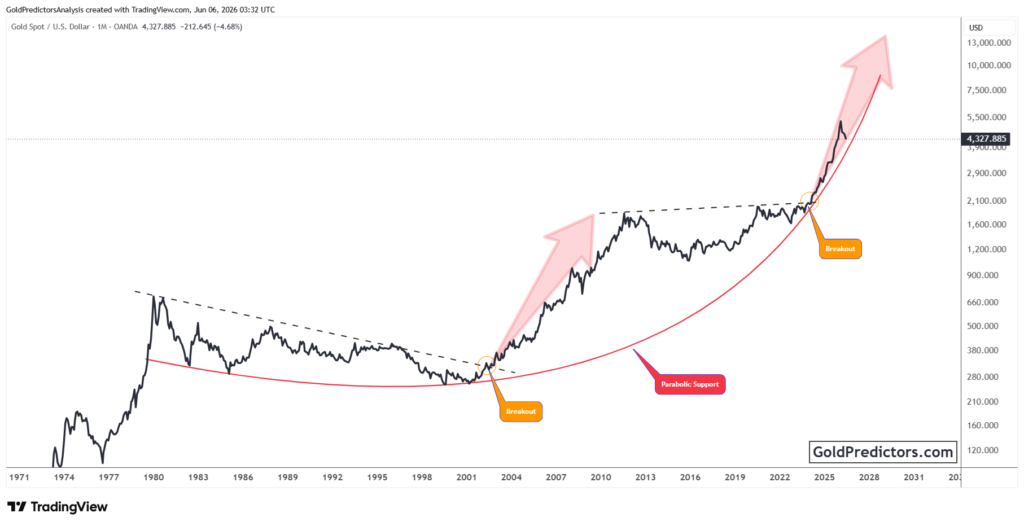
Silver (XAGUSD) has remained one of the most-watched commodities for investors and traders. With recent movements in the global economy and shifts in investor sentiment, the price of silver is gaining traction once again. Technical analysis offers strong clues about the future direction of silver. The strong price consolidation in silver prices despite the strong rally in the gold market indicates a strong price surge ahead.

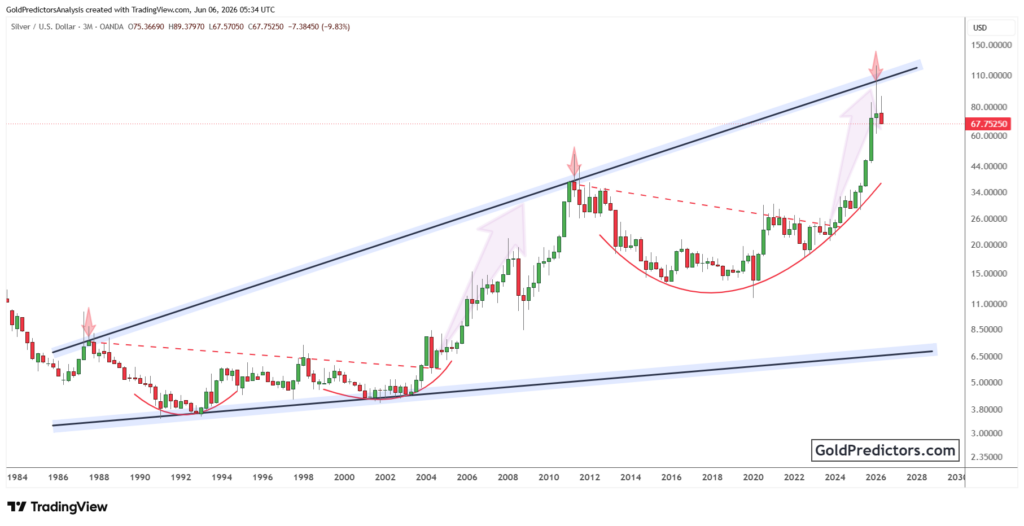
Silver Breaks Out of Long-Term Triangle Pattern, Signaling Major Surge

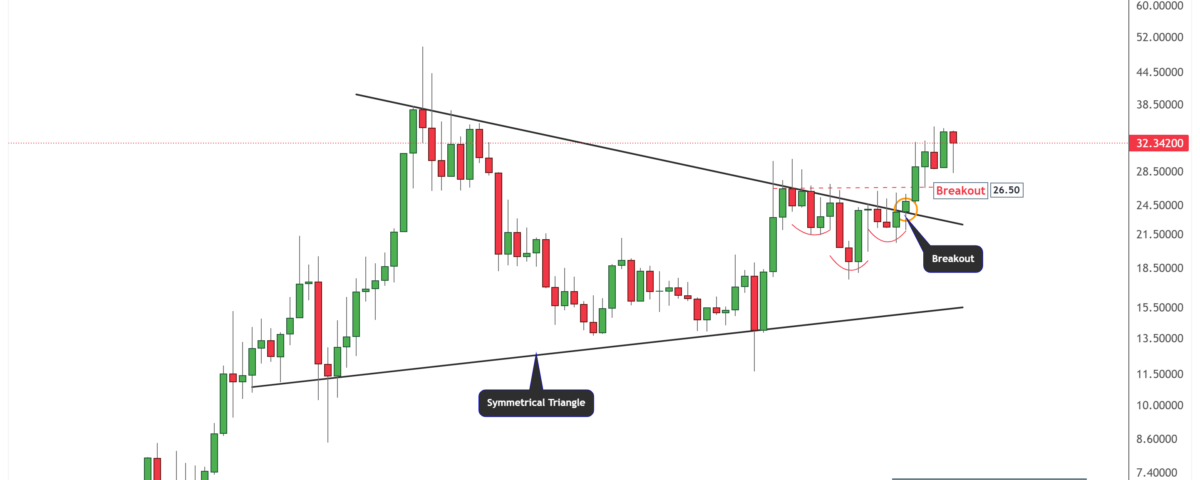
The silver chart below shows a compelling long-term breakout on the quarterly time frame. This chart shows the formation of a symmetrical triangle pattern. Symmetrical triangles are continuation patterns that typically signal a strong move once a breakout occurs. Silver has broken out of this triangle decisively above the $26.50 level, confirming the bullish breakout.

silver pattern

This breakout is significant for several reasons. First, the resistance trend line that was holding silver back since 2011 has now been breached. Second, the breakout happened on high volume and strong momentum, adding further credibility to the pattern. The previous resistance level of $26.50 has now turned into strong support. As of the latest data, silver is trading around $32.34, which is a 5.13% decline from the high, yet it remains well above the breakout zone.

This bullish breakout marks the beginning of a new long-term uptrend. Based on the height of the triangle and the duration of consolidation, the long-term target for silver could reach between $50 to $60 over the next couple of years if momentum sustains. Historically, such symmetrical triangle breakouts result in large multi-year rallies, and silver appears to be following a similar path.

Bullish Channel Keeps Silver on Track for $50 Target

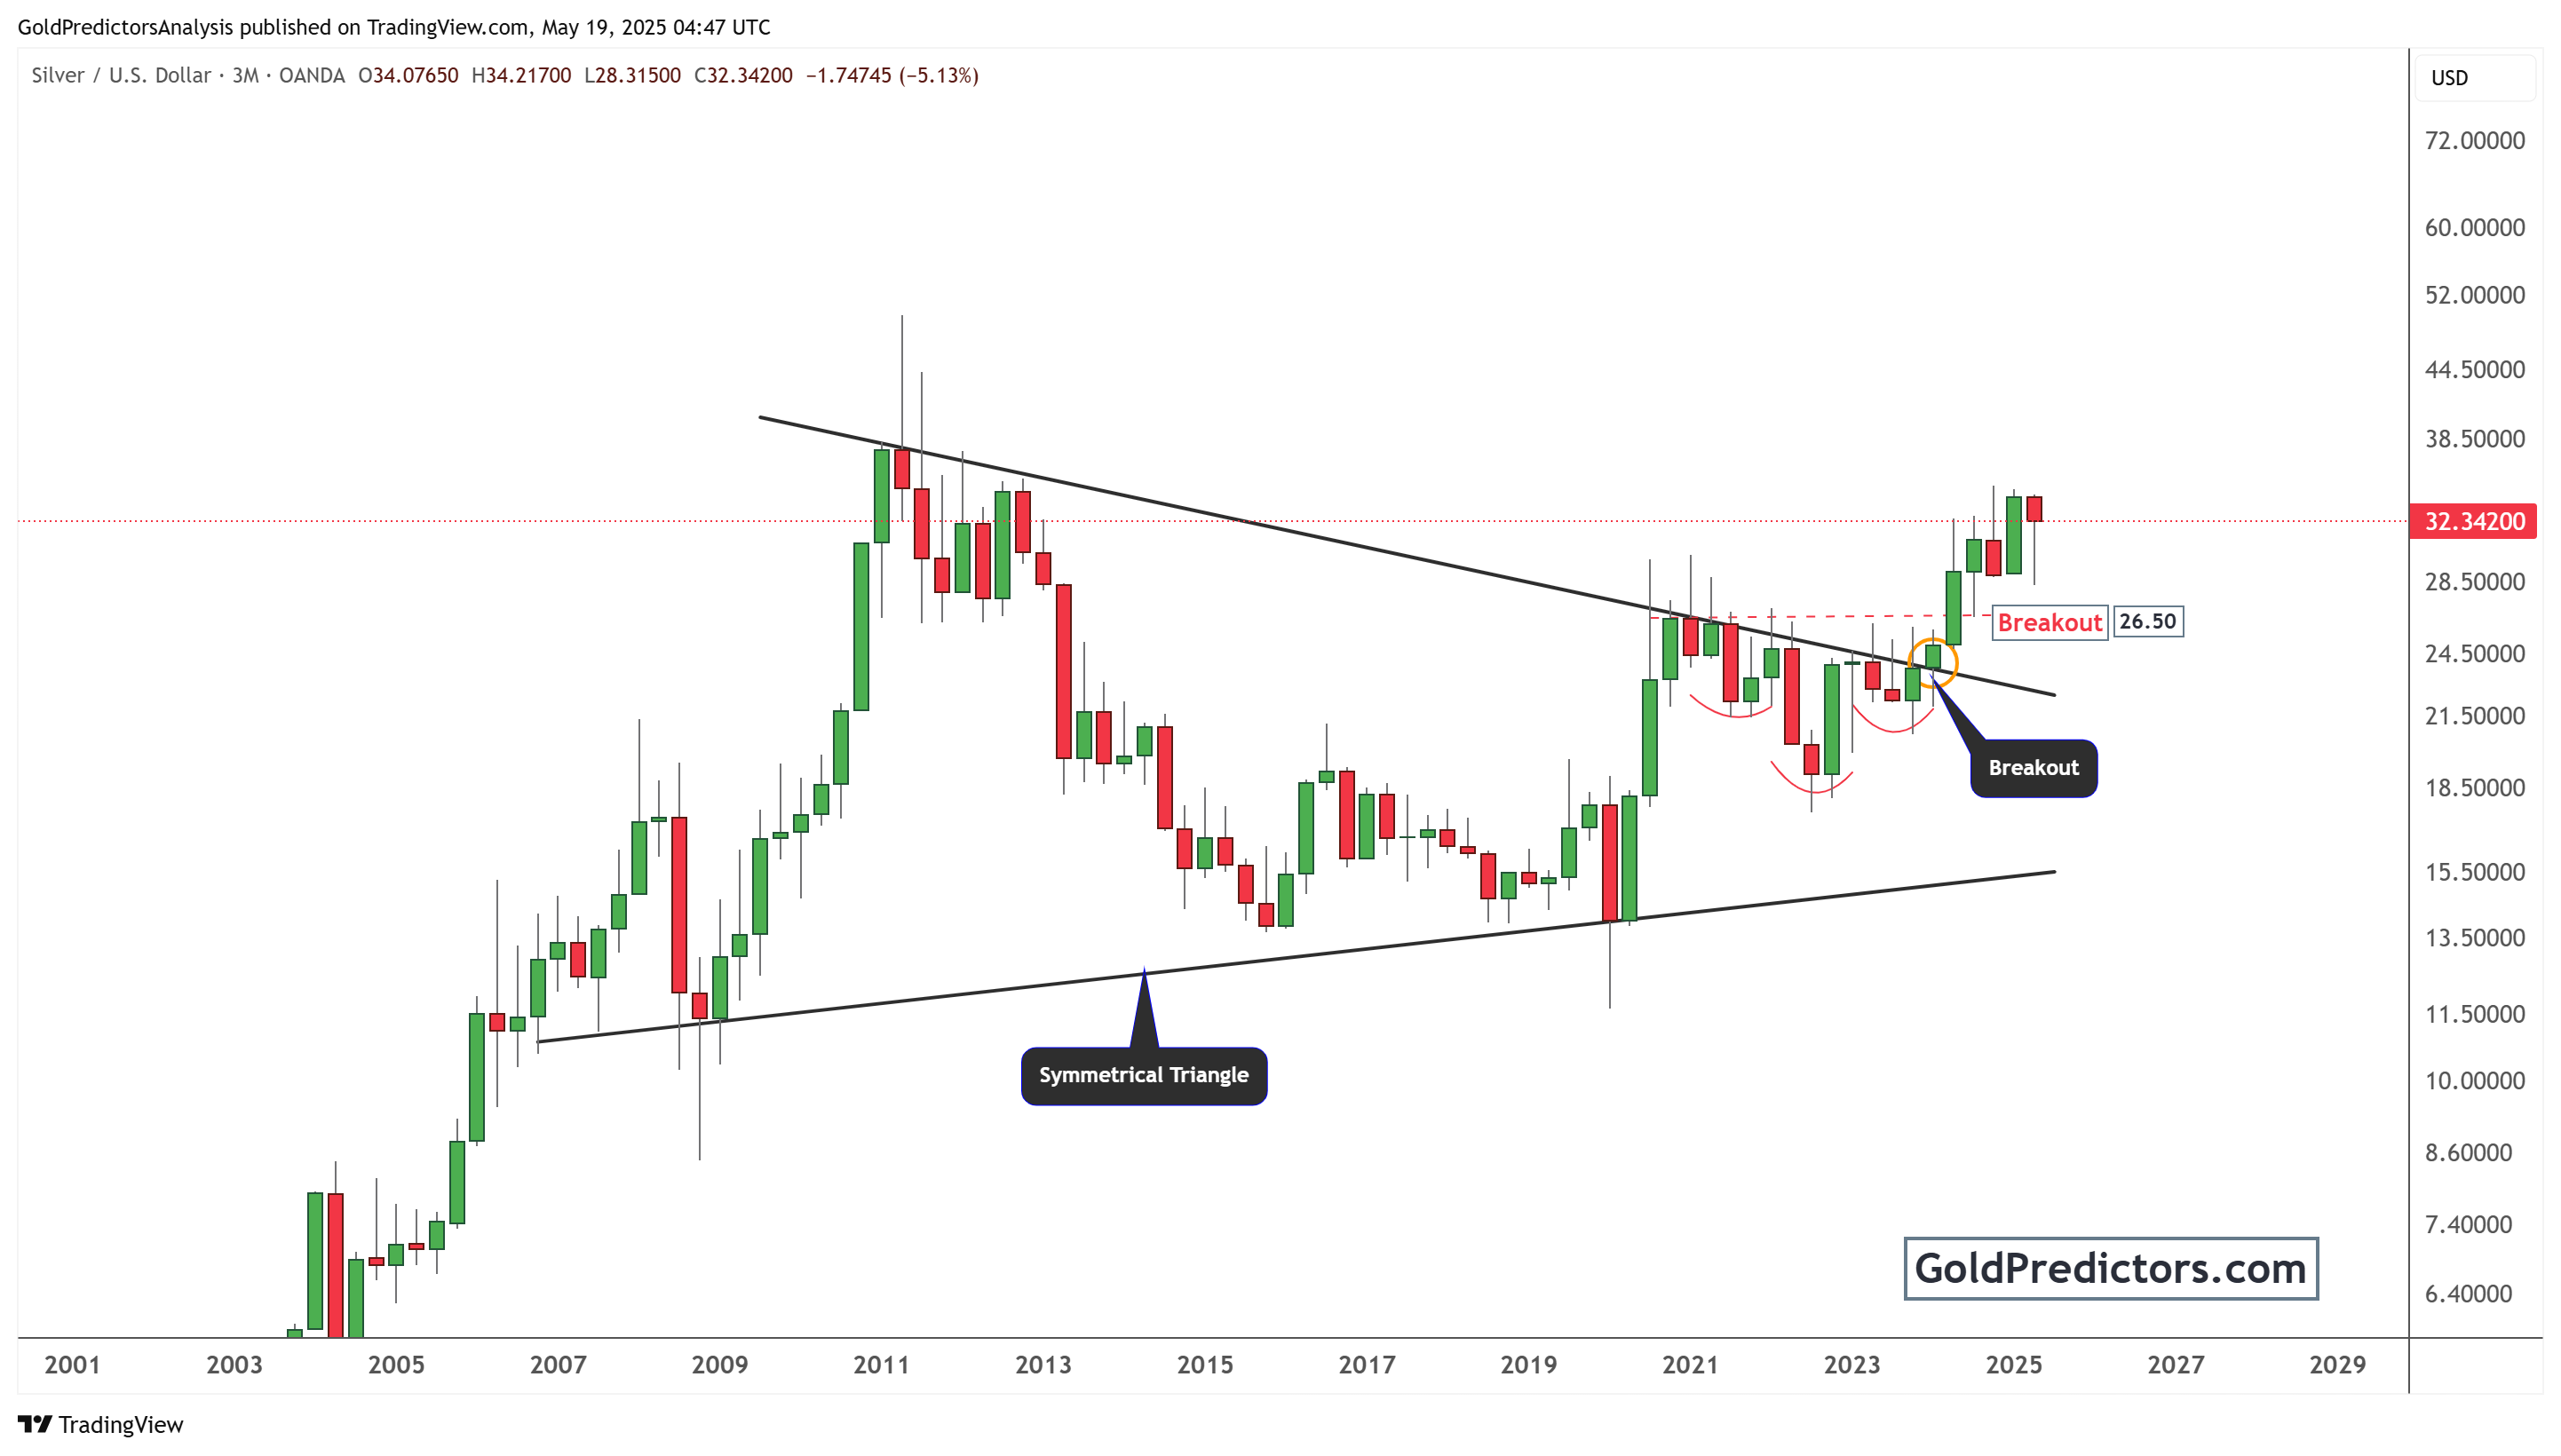
The silver chart below shows another important bullish pattern known as an ascending channel. This pattern shows that silver has been trading in a steadily rising channel since mid-2022. The price has respected the upper resistance and lower support lines of the channel consistently, making it a reliable trend structure.

silver pattern

Currently, silver is trading near the mid-point of this ascending channel at around $33.11. This level acts as a psychological and technical barrier. If silver continues to gain strength, the next key resistance lies near the upper boundary of the channel, around $35.00 to $36.00. A breakout above this resistance zone could accelerate the upward move toward the long-term targets discussed earlier.

The lower boundary of the ascending channel, currently around $27.00 to $28.00, provides a strong support level in case of any short-term corrections. The weekly chart also shows increasing volatility but consistent higher lows, which is a classic bullish signal. As long as the price stays inside this channel and respects its support levels, the medium-term outlook remains bullish.

Silver Outlook 2025: Technical Breakouts Support Long-Term Bullish Case

The chart analysis clearly shows strong bullish patterns for silver in the long and medium term. The long-term breakout from the symmetrical triangle confirms a major shift in trend. This move signals the beginning of a potential multi-year rally, with targets reaching as high as $60 if momentum holds.

In the medium term, the ascending channel offers steady guidance for support and resistance levels. Silver’s consistent respect for this channel shows the strength of the current trend. As long as the price remains above key support levels, the outlook stays positive.

Both patterns point to continued upside potential for silver in 2025. Investors and traders should watch these levels closely for signs of acceleration or correction. With strong technical foundations, silver looks ready to shine in the coming years.

Gold Predictors Premium Membership

Get exclusive short-term and swing trade ideas with precise entry levels, stop-loss, and target prices, including justification and analysis — all delivered directly via WhatsApp.

Our premium service includes deep technical analysis on gold and silver markets. We cover cycle analysis, price forecasting, and key timing levels.

Members also receive a weekly market letter with detailed analysis, commentary from our Chief Analyst, including actionable insights, trade timing, and direction forecasts for gold and silver.

Stay ahead of the market — join our premium community today.

Premium Membership Trading Performance

Latest Post

Free Articles

Silver Price Analysis: Breakout Above Multi-Decade Resistance Signals Major Upside

Silver breaks multi-decade resistance as Bitcoin ratio turns higher, signaling improving long-term momentum and potential expansion ahead …
Read More
April 1, 2026 / admin
Free Articles

Silver Price Breaks Decade-Long Resistance as Silver-to-Palladium Ratio Reverses Higher

Silver clears decade-long resistance as the silver-to-palladium ratio turns higher, signaling strong momentum in precious …
Read More
March 31, 2026 / admin
Free Articles

Gold Clears Decades-Long Resistance as Dollar-to-Gold Ratio Breaks Support

Gold breaks decades-long resistance as dollar-to-gold ratio slips below support, signaling structural shift favoring higher …
Read More
February 26, 2026 / admin
Free Articles

Silver Breaks Long-Term Compression as Dollar-to-Silver Ratio Turns Lower

Silver exits long-term compression as breakouts hold and dollar-to-silver ratio turns lower, supporting price expansion …
Read More
February 25, 2026 / admin
Free Articles

Gold Price Outlook: Long-Term Strength and Leadership Rotation Support Higher Prices

Gold holds rising channel as breakouts persist and relative strength improves, signaling leadership rotation and …
Read More
February 24, 2026 / admin
Free Articles

Gold Breaks Out of Multi-Decade Triangle as Industrials Lose Ground

Gold clears multi-decade resistance as price holds above $3,000 and industrials lose relative strength, confirming …
Read More
February 20, 2026 / admin

Related posts

silver pattern
April 1, 2026

Silver Price Analysis: Breakout Above Multi-Decade Resistance Signals Major Upside


Read more
Silver Pattern
March 31, 2026

Silver Price Breaks Decade-Long Resistance as Silver-to-Palladium Ratio Reverses Higher


Read more
gold pattern
February 26, 2026

Gold Clears Decades-Long Resistance as Dollar-to-Gold Ratio Breaks Support


Read more

Comments are closed.

ABOUT US

  • About Us
  • Social Networks
  • Industry Links
  • Testimonials
  • Terms & Conditions

TECHNICAL ANALYSIS

  • Technical Analysis
  • Trend Identification
  • Phase Identification
  • Important Levels
  • Volatility Measurement

CYCLE ANALYSIS

  • Gold Cycle
  • Short Term Cycles
  • Medium Term Cycles
  • Long Term Cycles

PRICE ACTION ANALYSIS

  • Price Action Analysis
  • Phase Identification
  • Historical Pattern Identification
  • Candlestick Pattern Identification
© 2017 Gold Predictors. All Rights Reserved.
  • Remember Me
    Lost your password?
    Dont have an account?Sign Up