Gold Price Hits $3,500 in 2025: Bullish Patterns Signal Long-Term Rally Ahead | Gold Predictors - Forecasting Gold Prices

New York

London

Sydney

Tokyo

Log In

  • Register
  • Lost your password?
gold predictorsgold predictorsgold predictorsgold predictors
  • HOME
  • ABOUT US
    • About Us
    • Social Networks
    • Industry Links
    • Testimonials
  • RESEARCH
    • Scientific Trade Strategies
    • Gold Hub
    • Gold Importance
    • Silver Importance
  • GOLD HUB
  • GOLD ANALYSIS
    • Gold Analysis
    • Technical Analysis
      • Trend Identification
      • Phase Identification
      • Important Levels
      • Volatility Measurement
    • Gold Cycle
      • Short Term Cycles
      • Medium Term Cycles
      • Long Term Cycles
    • Price Action Analysis
      • Phase Identification
      • Historical Pattern Identification
      • Candlestick Pattern Identification
    • Fundamental Analysis of Gold
    • Gold Related Markets Analysis
    • Gold Seasonal
  • TRADING METHODOLOGY
    • Gold Analysis
      • Technical Analysis
      • Gold Cycle
      • Price Action Strategy
      • Fundamental Analysis
      • Gold Related Markets Analysis
      • Gold Seasonal
    • Measure Signal Strength
      • Weak Signal
      • Strong Signal
      • Confirmed Signal
    • Trading Decision
    • Trading Rules
      • Basic Trading Rules
      • Gold Predictors Trading Rules
    • Trade Examples
    • Performance
  • LIVE CHARTS
  • MEMBERSHIPS
    • Free Membership
    • Premium Membership
    • SignUp
  • MEMBERS AREA
    • Free Article
    • Premium Article
    • Trading Signals
    • Long Term Signals
    • Forex Reports
    • Crypto Reports
  • FOREX REPORTS
  • HELP
    • FAQ
    • Contact Us
Login / Register

Gold Price Hits $3,500 in 2025: Bullish Patterns Signal Long-Term Rally Ahead

0
Published by admin at May 16, 2025
Categories
  • Free Articles
Tags
  • day trading
  • dollar
  • forex
  • gold
  • trading signal
  • US Dollar
  • US Dollar rally
  • USD
gold pattern

Gold (XAUUSD) has always been a reliable hedge against inflation and economic uncertainty. In 2025, gold prices have shown an exceptional surge, reflecting global investor confidence in the precious metal. This article discusses the recent rally in gold prices and its historical pattern against the US dollar.  The analysis highlights that prices have reached the pivotal $3,500 level, but the emergence of a cup and handle pattern in the Gold to US Dollar ratio suggests that the correction should be viewed as a buying opportunity for the next move higher.

Gold Price Surge in 2025 Confirms Structural Bull Market

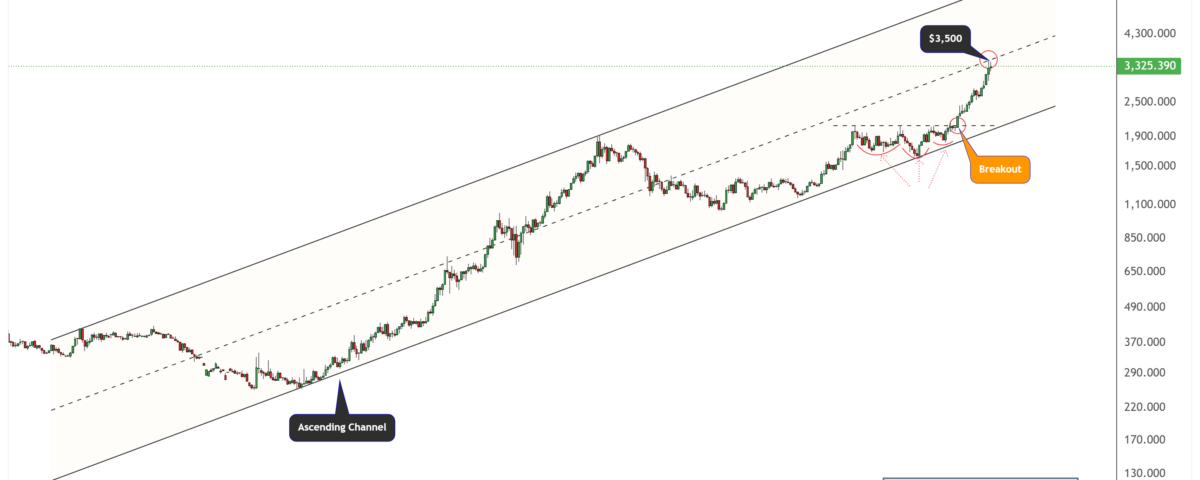
The monthly gold chart below shows the price action since the early 1990s. The price consistently moved within an ascending channel for over 30 years. The long-term structure shows higher highs and lows, indicating a strong uptrend. This pattern provided significant resistance near the upper boundary of the channel.

gold pattern

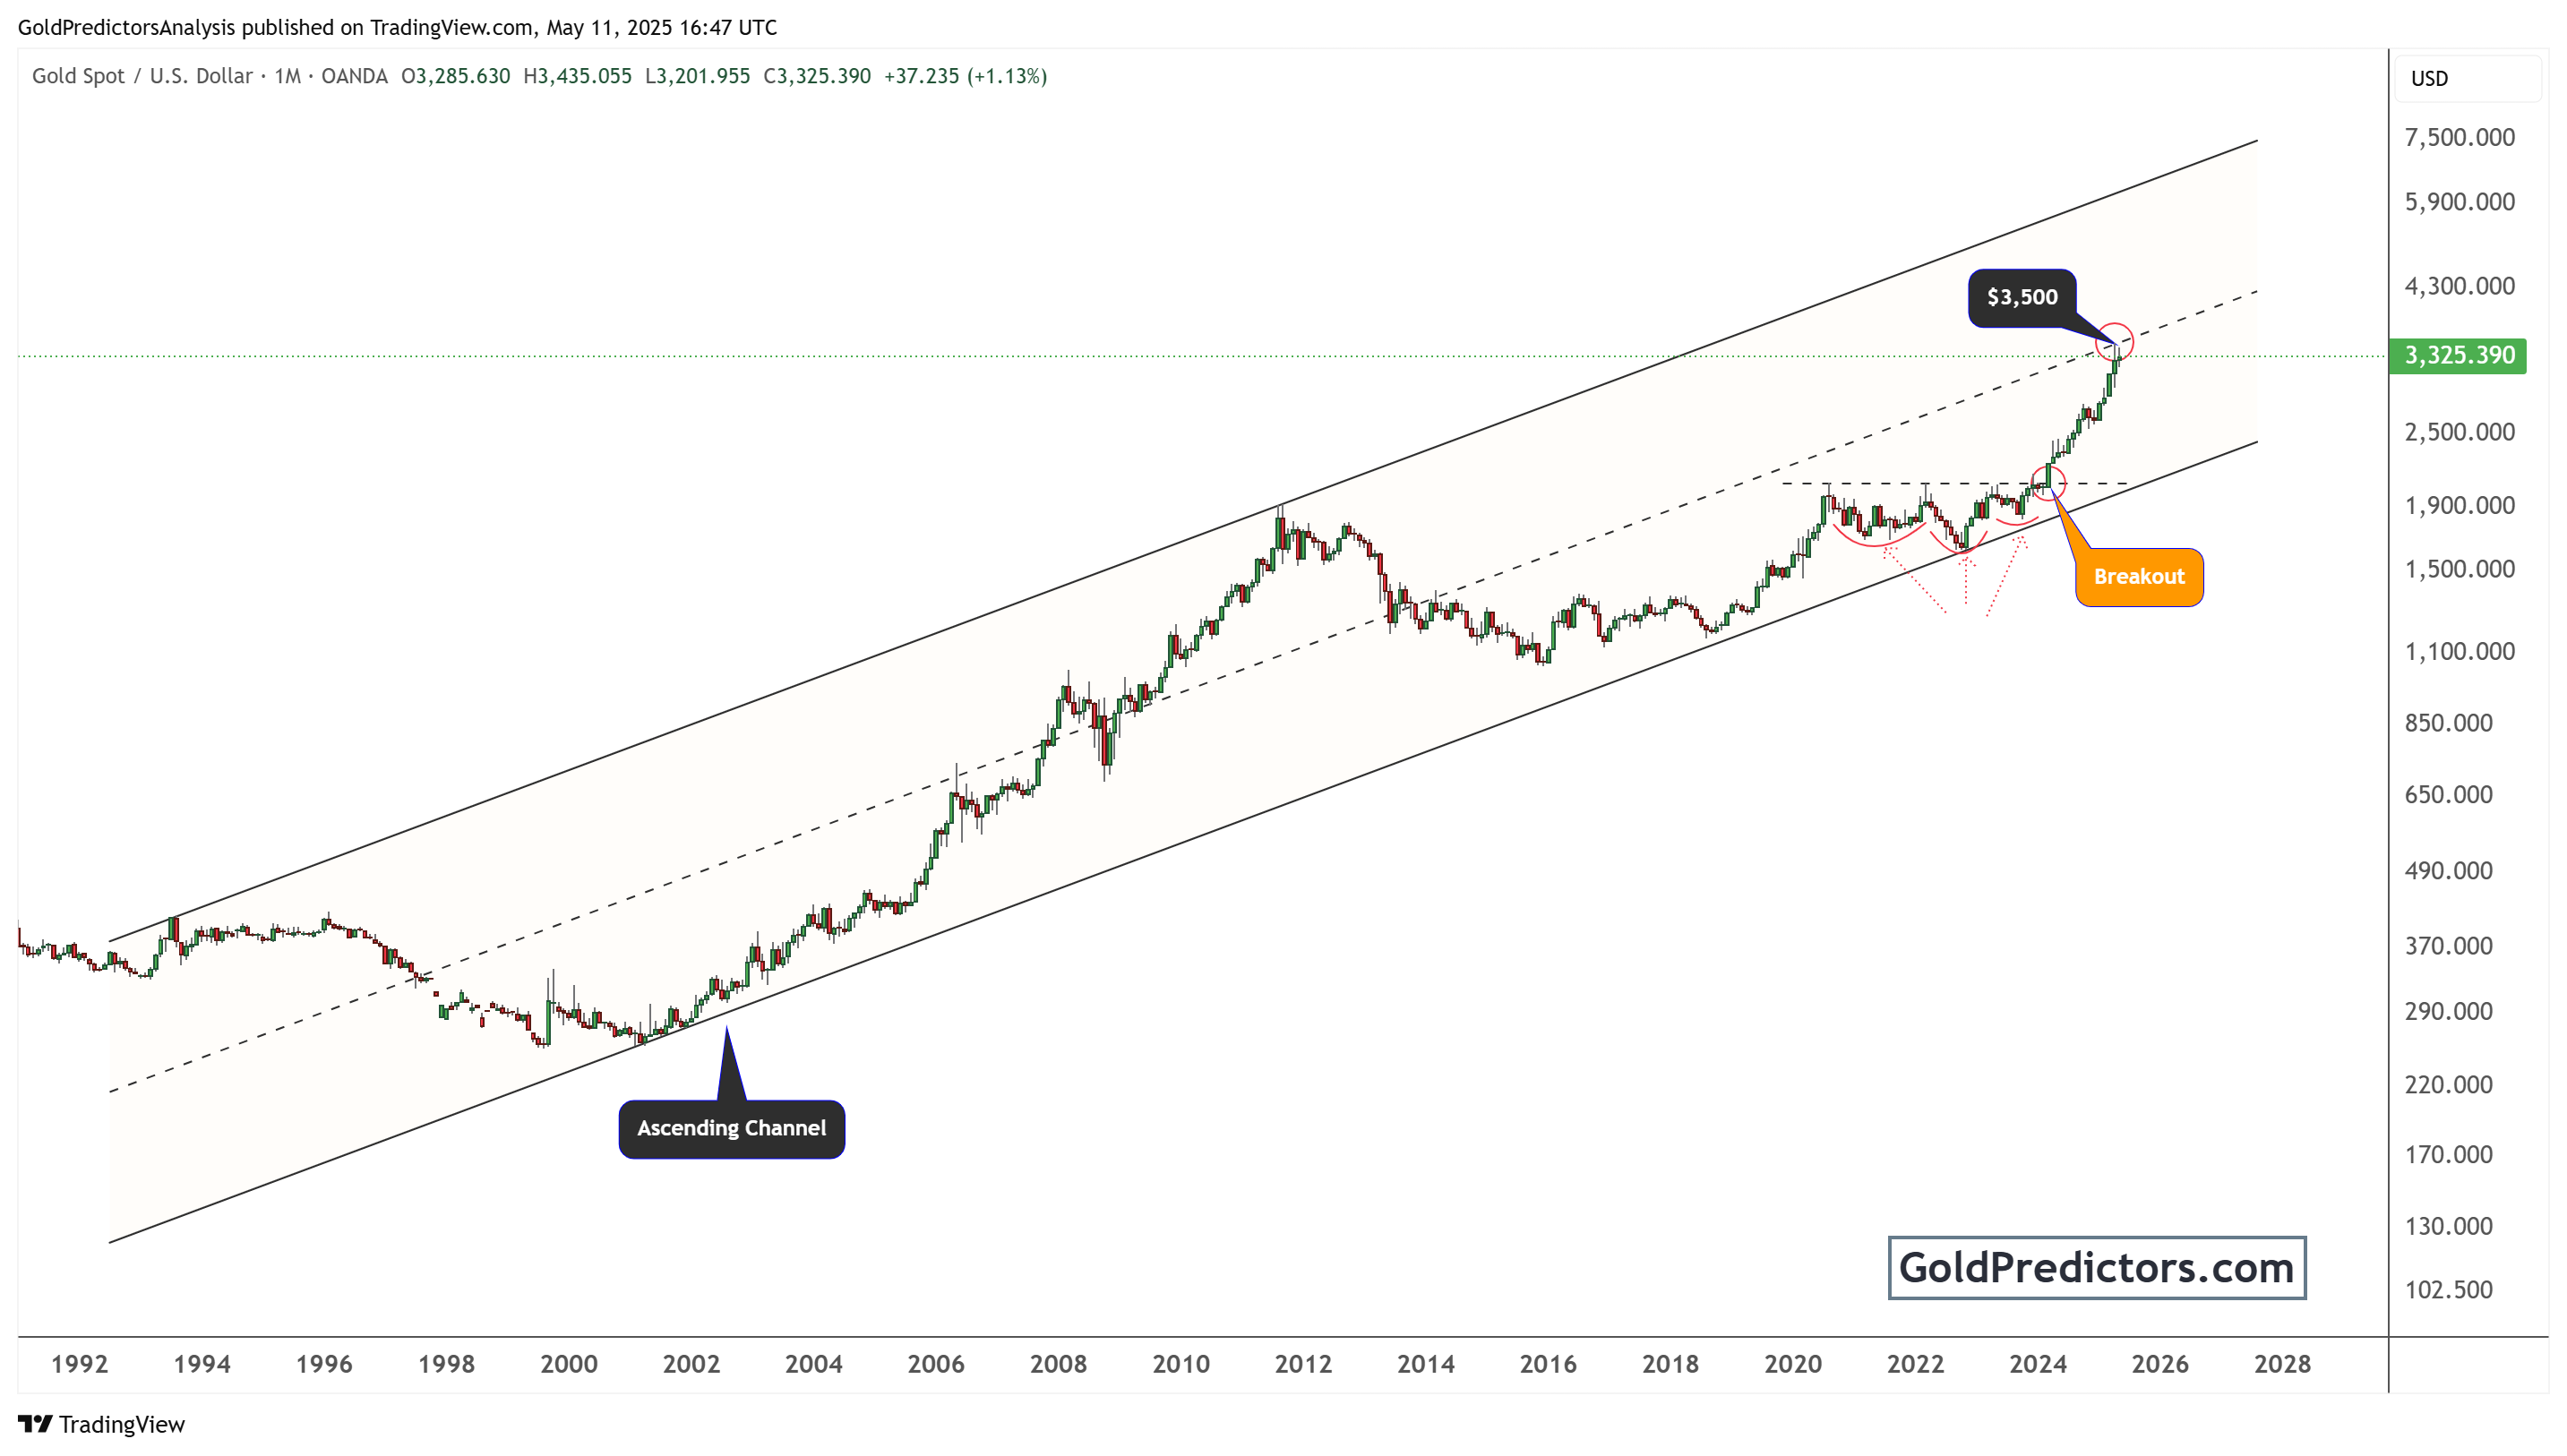
In early 2024, gold emerged from this long-term ascending channel with a strong upward move. The breakout occurred around the $2,100 mark, pushing prices to a new high of around $3,500 in April 2025. This strong move is significant because it happened after the formation of an inverted head and shoulders at the support of this ascending channel.

The chart points to a near-term target of $3,500, suggesting further upside potential. Once gold crossed the $2,100-$2,200 resistance level, a new leg of the bull market began. The emergence of head and shoulders patterns confirms that the breakout from $2,100 is not a temporary spike, but part of a broader bull market cycle.

Massive Cup and Handle Pattern in Gold/USD Ratio Confirms Long-Term Bullish Outlook

The chart below shows a historical perspective of gold’s performance against the U.S. Dollar Index (DXY) from the 1970s to 2025. It reveals a massive cup and handle pattern, a classic bullish formation. This pattern has developed over two decades, with the “cup” forming between 2011 and 2020 and the “handle” forming between 2020 and 2023.

gold pattern

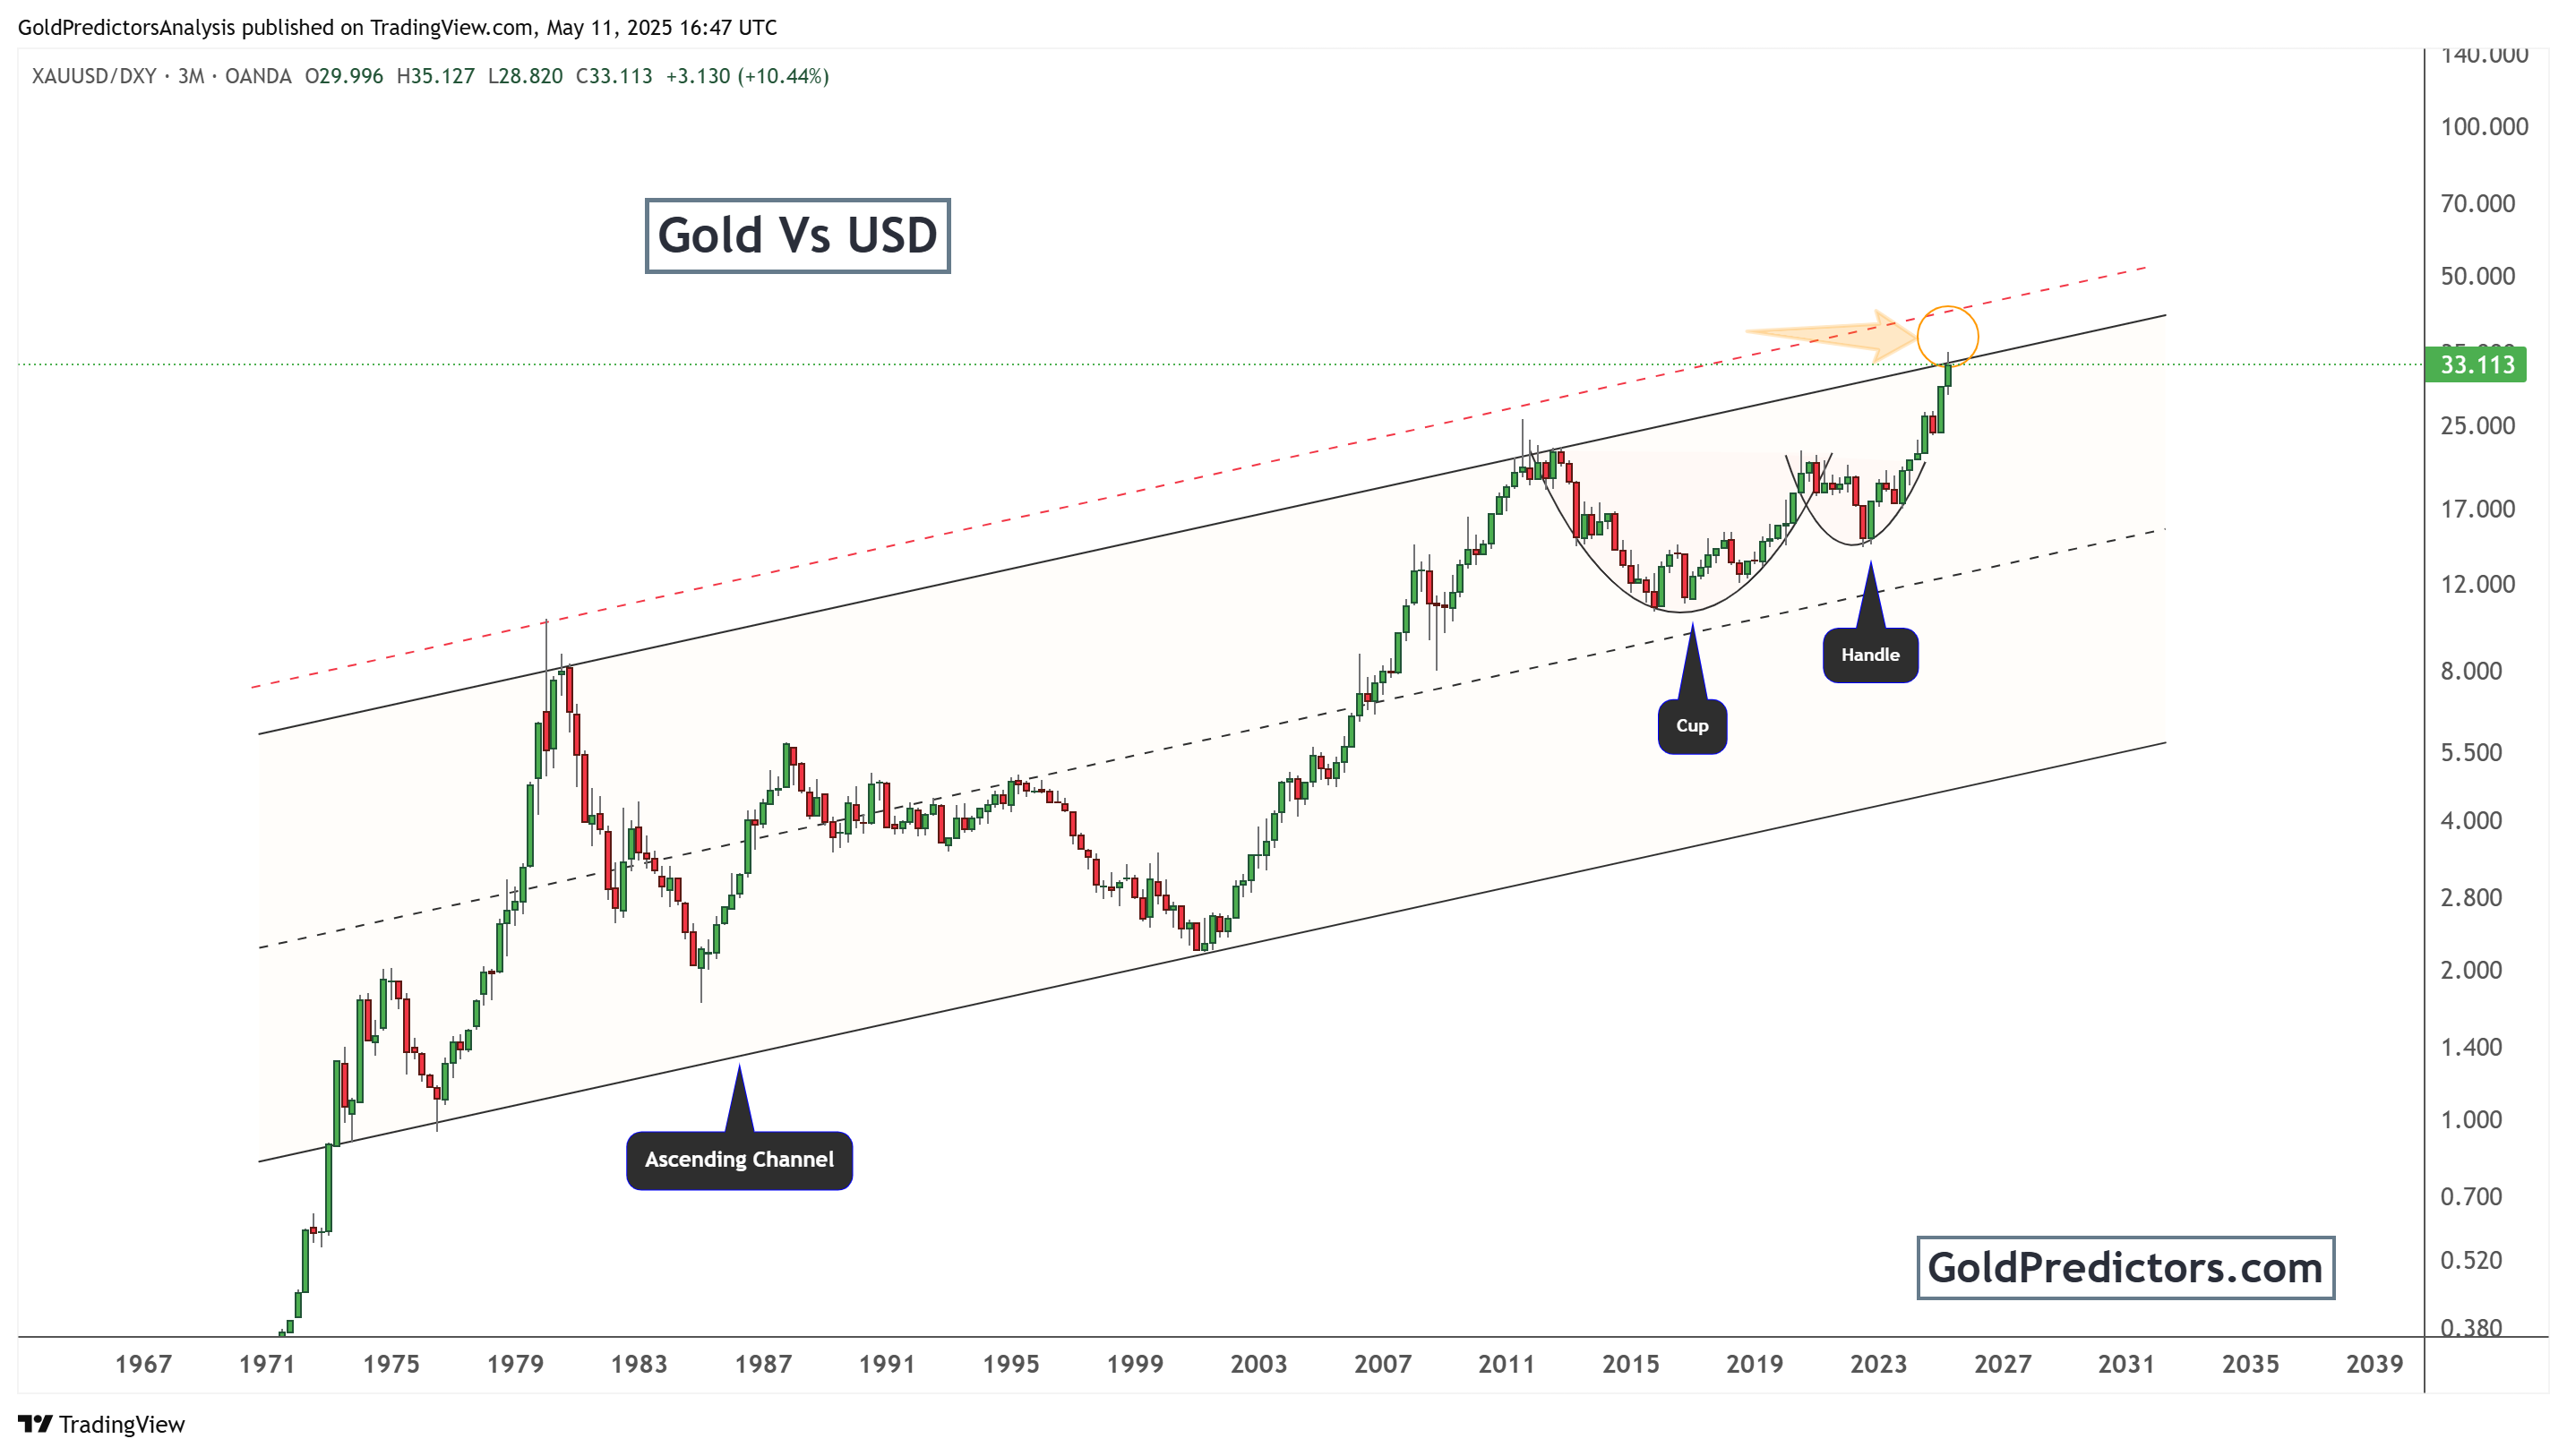
By 2024, gold successfully broke above the handle, confirming the pattern. The breakout area aligns with the upper boundary of the long-term ascending channel. As of May 2025, gold is testing the upper resistance of this channel at around 33.11. If gold successfully breaks this area in 2025, much higher targets are likely in the following years.

This chart also aligns with the above analysis. Both confirm that gold has entered an intense bull phase. The breakout from the inverted head and shoulder pattern at $2,100 within the ascending channel indicates a strong bullish move. This strong move will likely outperform the US dollar, especially during inflation or monetary easing periods.

Conclusion: Gold’s Multi-Decade Patterns Validate Strong Upside Potential Ahead

The strong rally in gold in 2025 signals a significant shift in market dynamics. This strong move within the long-term ascending channel confirms a powerful bullish trend. The technical analysis shows the long-term structural strength. Moreover, the cup and handle pattern against the US dollar further validates the bullish outlook. This decades-long formation has now completed, with gold breaking above key resistance levels. Since the price has reached strong resistance at $3,500, near the midline of the ascending channel, a correction is underway. To get the exact timing and price levels of this correction, please subscribe to the premium membership.

Gold Predictors Premium Membership

Get exclusive short-term and swing trade ideas with precise entry levels, stop-loss, and target prices, including justification and analysis — all delivered directly via WhatsApp.

Our premium service includes deep technical analysis on gold and silver markets. We cover cycle analysis, price forecasting, and key timing levels.

Members also receive a weekly market letter with detailed analysis, commentary from our Chief Analyst, including actionable insights, trade timing, and direction forecasts for gold and silver.

Stay ahead of the market — join our premium community today.

Premium Membership Trading Performance

Latest Post

Free Articles

Gold Price Hits $3,500 in 2025: Bullish Patterns Signal Long-Term Rally Ahead

Gold’s breakout in 2025 signals a major bull run, with prices surging past $3,300. Key technical patterns, including a 30-year …
Read More
May 16, 2025 / admin
Free Articles

Silver Bullish Structure Points to Explosive Move Amid Gold Ratio Breakout

Silver is gaining momentum in 2025, with a bullish chart pattern and an extreme gold-to-silver …
Read More
May 13, 2025 / admin
Free Articles

Silver Bullish Patterns Signal Move Toward $50

Silver has broken out of a 12-year base, completing a bullish cup and handle pattern …
Read More
May 9, 2025 / admin
Free Articles

Gold Breaks Multi-Decade Resistance as Gold/Silver Ratio Nears Historic Turning Point

Gold breaks multi-decade resistance as the gold/silver ratio nears a breakout—signaling a potential long-term bull …
Read More
May 8, 2025 / admin
Free Articles

Gold Price Breakout 2025: Long-Term Patterns Point to $4,000 and Beyond

Gold has broken above $3,200, confirming a major breakout driven by long-term bullish patterns—an ascending …
Read More
May 7, 2025 / admin
Free Articles

Gold Breakout and Dollar Decline: Why Gold Could Rally Toward $6,000

Gold breaks historic resistance as the dollar weakens, signaling a strong bullish trend ahead …
Read More
May 6, 2025 / admin

Related posts

gold pattern
May 16, 2025

Gold Price Hits $3,500 in 2025: Bullish Patterns Signal Long-Term Rally Ahead


Read more
silver pattern
May 13, 2025

Silver Bullish Structure Points to Explosive Move Amid Gold Ratio Breakout


Read more
silver pattern
May 9, 2025

Silver Bullish Patterns Signal Move Toward $50


Read more

Comments are closed.

ABOUT US

  • About Us
  • Social Networks
  • Industry Links
  • Testimonials
  • Terms & Conditions

TECHNICAL ANALYSIS

  • Technical Analysis
  • Trend Identification
  • Phase Identification
  • Important Levels
  • Volatility Measurement

CYCLE ANALYSIS

  • Gold Cycle
  • Short Term Cycles
  • Medium Term Cycles
  • Long Term Cycles

PRICE ACTION ANALYSIS

  • Price Action Analysis
  • Phase Identification
  • Historical Pattern Identification
  • Candlestick Pattern Identification
© 2017 Gold Predictors. All Rights Reserved.
  • Remember Me
    Lost your password?
    Dont have an account?Sign Up