


Silver Market Looks Higher
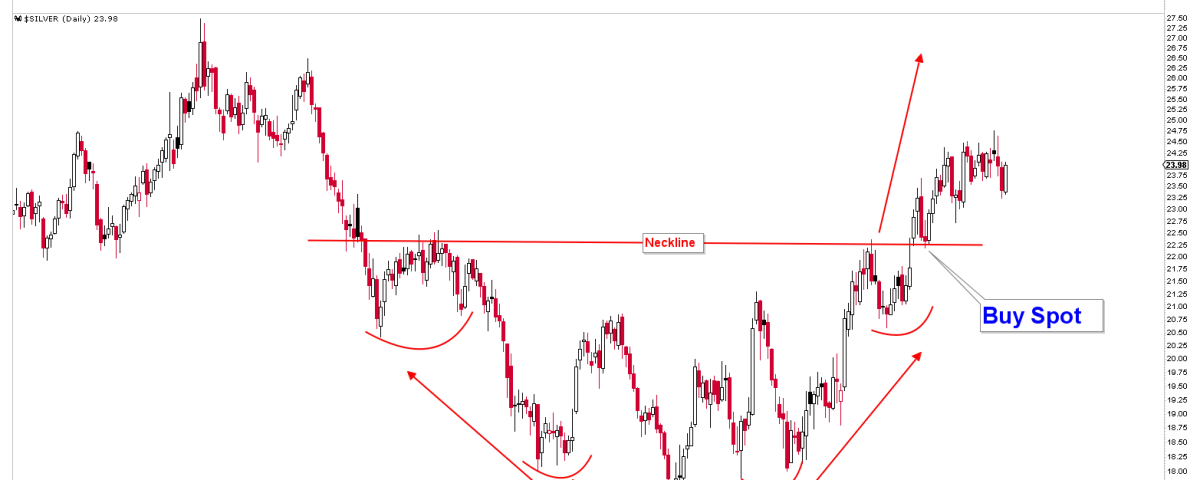
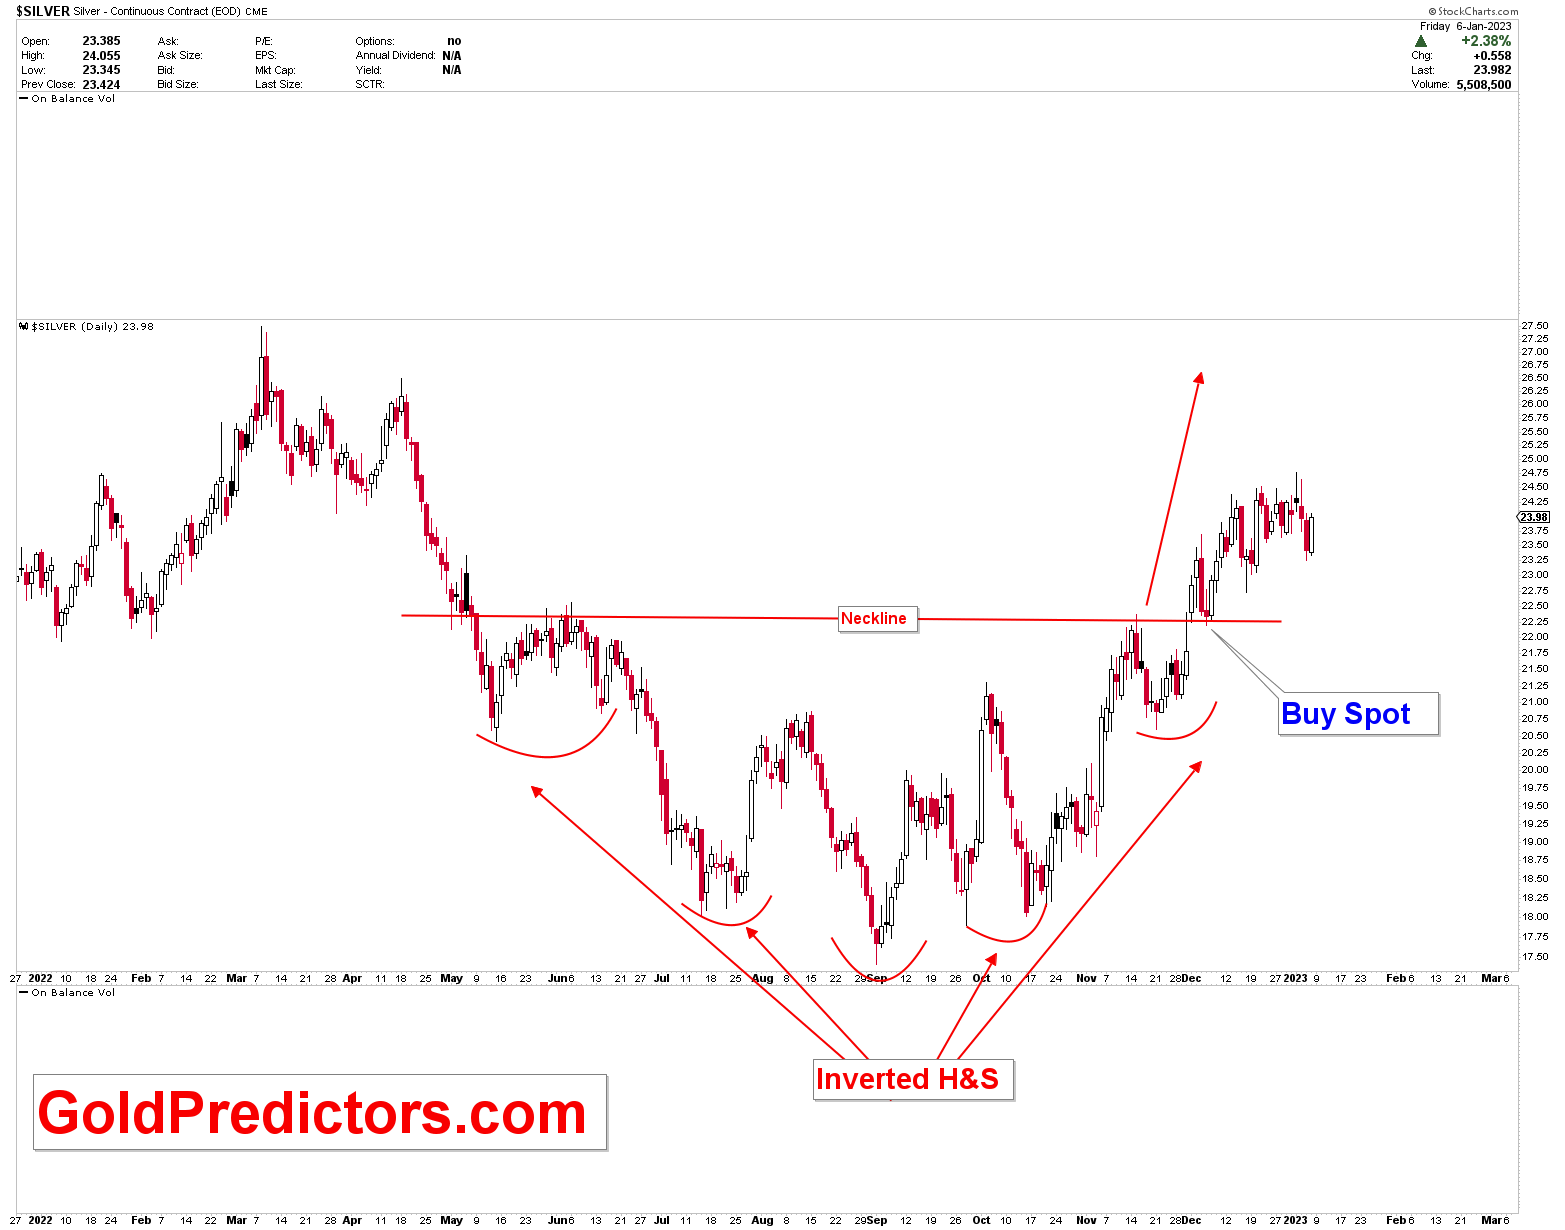
Daily Silver Chart
The silver market has produced a bottom between $17 and $18 and is exploding higher with robust momentum. As previously stated, December is expected to be a positive month with choppy price fluctuations. December was slightly positive with bullish price action. Inflation and interest rate increases in the United States have contributed to the development of strong bottom in the silver market. The silver advance during the last quarter of 2022 was not unexpected. The development of an inverted head and shoulders on the weekly and daily charts for silver was identified. Based on these patterns, strong upward move was expected a few months ago.
What is Next in Silver Market?
The silver market has exceeded the resistance level at $22.25 and moved higher. The formation of inverted head and shoulder are powerful bullish patterns that aim for $27 as the short-term resistance. The next resistance was $30, which is also a long-term pivot. The inverted head and shoulder formation was developed in such a way that the head of these patterns consists of a triple bottom. The triple bottom indicates that silver may begin to encounter long-term resistance around $30 and then $35.
The long-term support for the silver market has been identified as $17.60, where the market has not closed below this level on weekly basis. Since silver is more volatile than gold, if precious metals bottom in 2022 due to fears of higher inflation and recession, silver could outperform gold in 2023, thereby increasing the likelihood of reaching the $50 long-term objective. The daily updated silver chart is shown below.
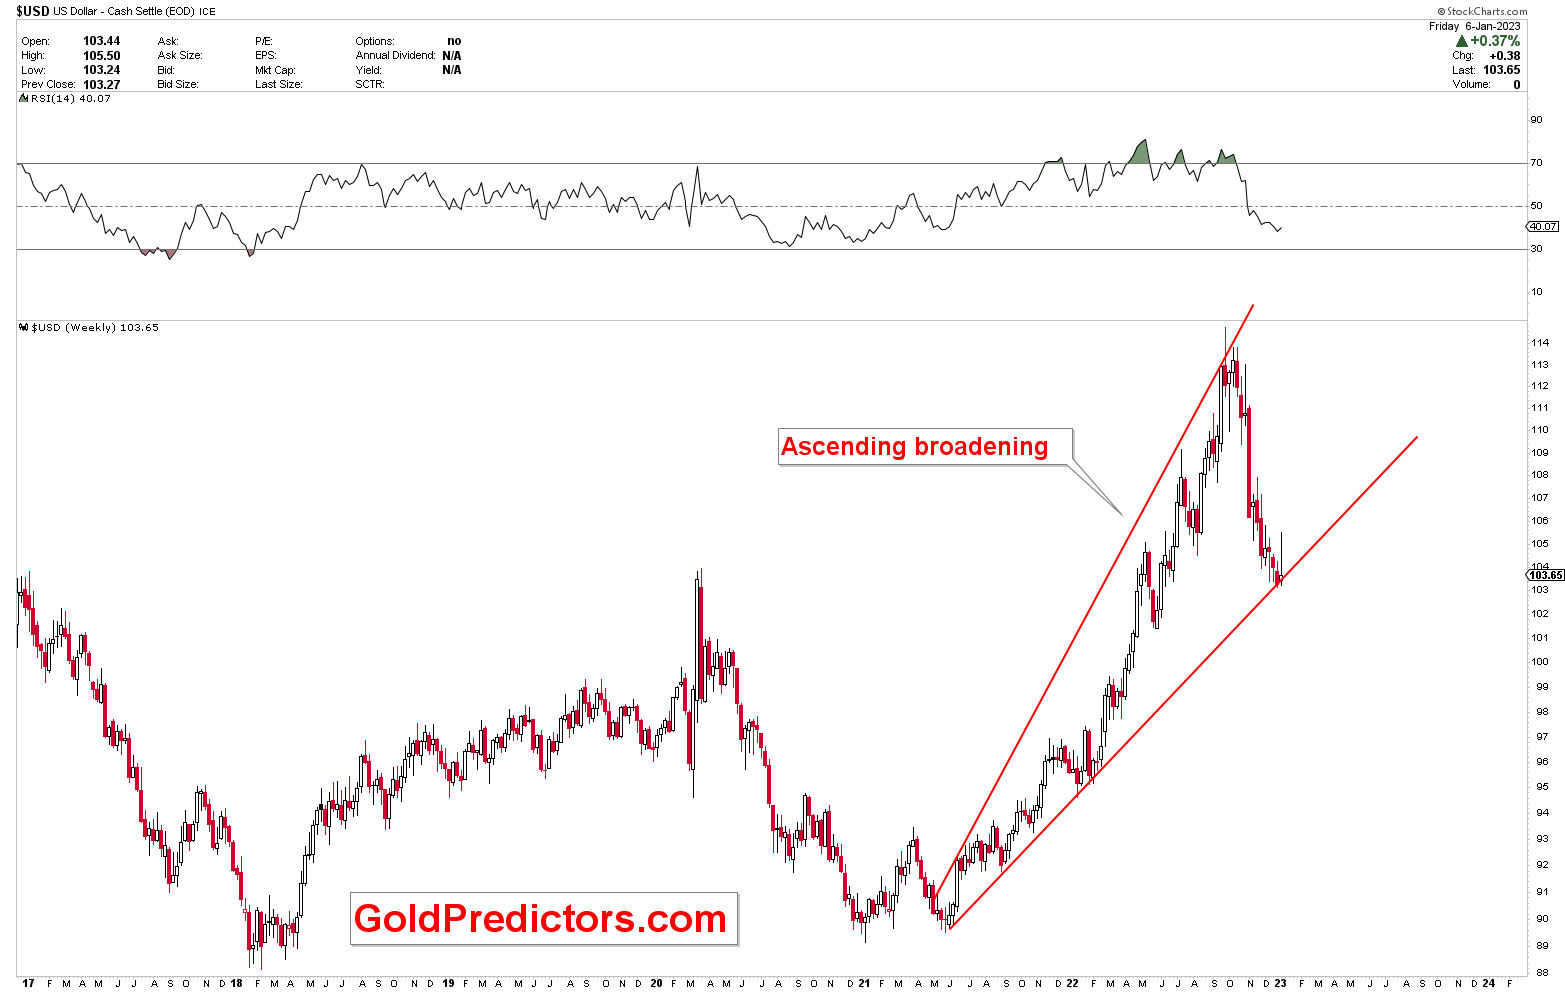
The weakening of the U.S. dollar index will add further strength to the silver prices. Following the formation of ascending broadening patterns on the chart below, the US dollar index is about to break to the downside. A decline from here will decrease the value of the US dollar, which will increase the demand for silver. A decline from the ascending broadening is likely to extend the dollar’s long-term decline to the 88-92 levels.
To receive Free and Premium Articles, and Website and WhatsApp Trading Signals, please subscribe to the link below.