Gold with Another Bullish December

Gold prices extend gains to reach the strong resistance level of 1833, which was the prior pivot point in the spot gold market. It has been discussed numerous times, December has been a hectic month for the gold market with positive momentum. The month of December has shown the expected behavior. Several nations have required Covid testing for Chinese travelers as the number of reported cases of the virus increases. During these holidays, government officials have warned of the spread of a virus throughout China. On the other hand, the Russia-Ukraine conflict has escalated since Russia rejected the peace agreement. This conflict has further boosted market sentiment.
Increased geopolitical activities in the market have had an indirect effect on the monetary system. Which is insensitive to real-time data, resulting in the Fed adjusting monetary policy. The rate hikes are having a negative effect on the economy, and the results will not be seen for at least a year. Higher interest rates intended to control inflation have been found to be ineffective. The CPI has declined over the past three months, but this decline is merely a retracement and inflation remains out of control.
Technical Analysis of Gold Market
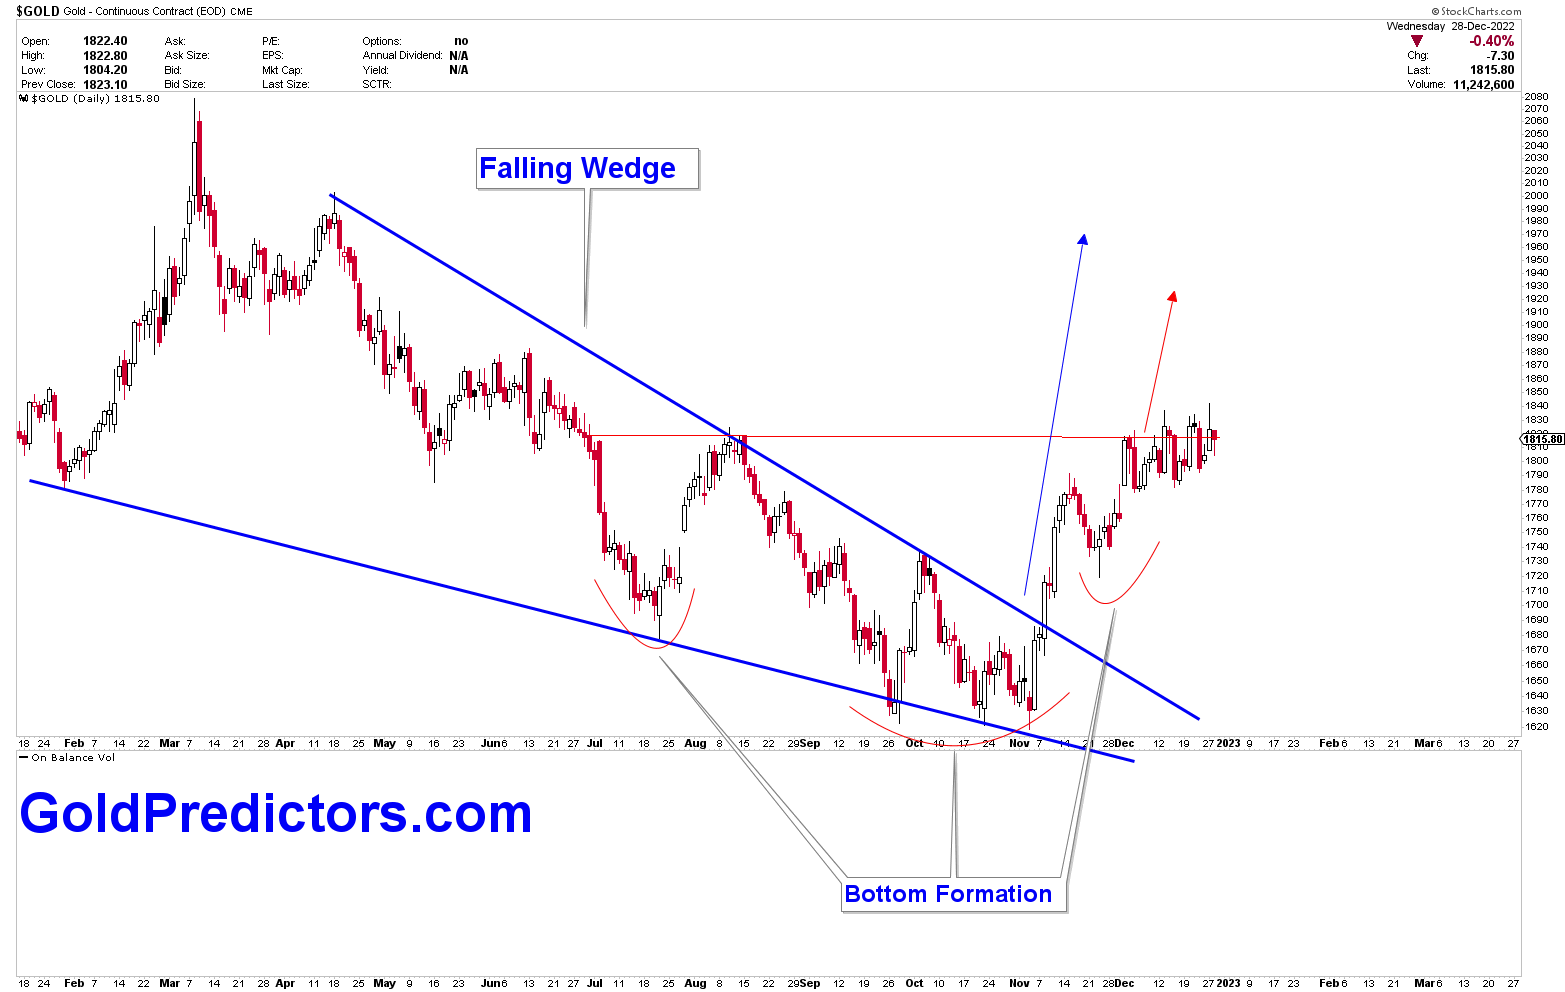
The gold market has broken the falling wedge triangle. The gold bottom was supported by an inverted head-and-shoulder (H&S) pattern and a triple bottom. The neckline of H&S with the neckline located at approximately $1,833 levels. A breakout from $1,833 would be extremely bullish for gold in the near-term. This falling wedge’s target is $2,000 levels. A break above $2,075 is a strong bullish signal for the gold market in 2023, with targets of $2,500-$3,000.
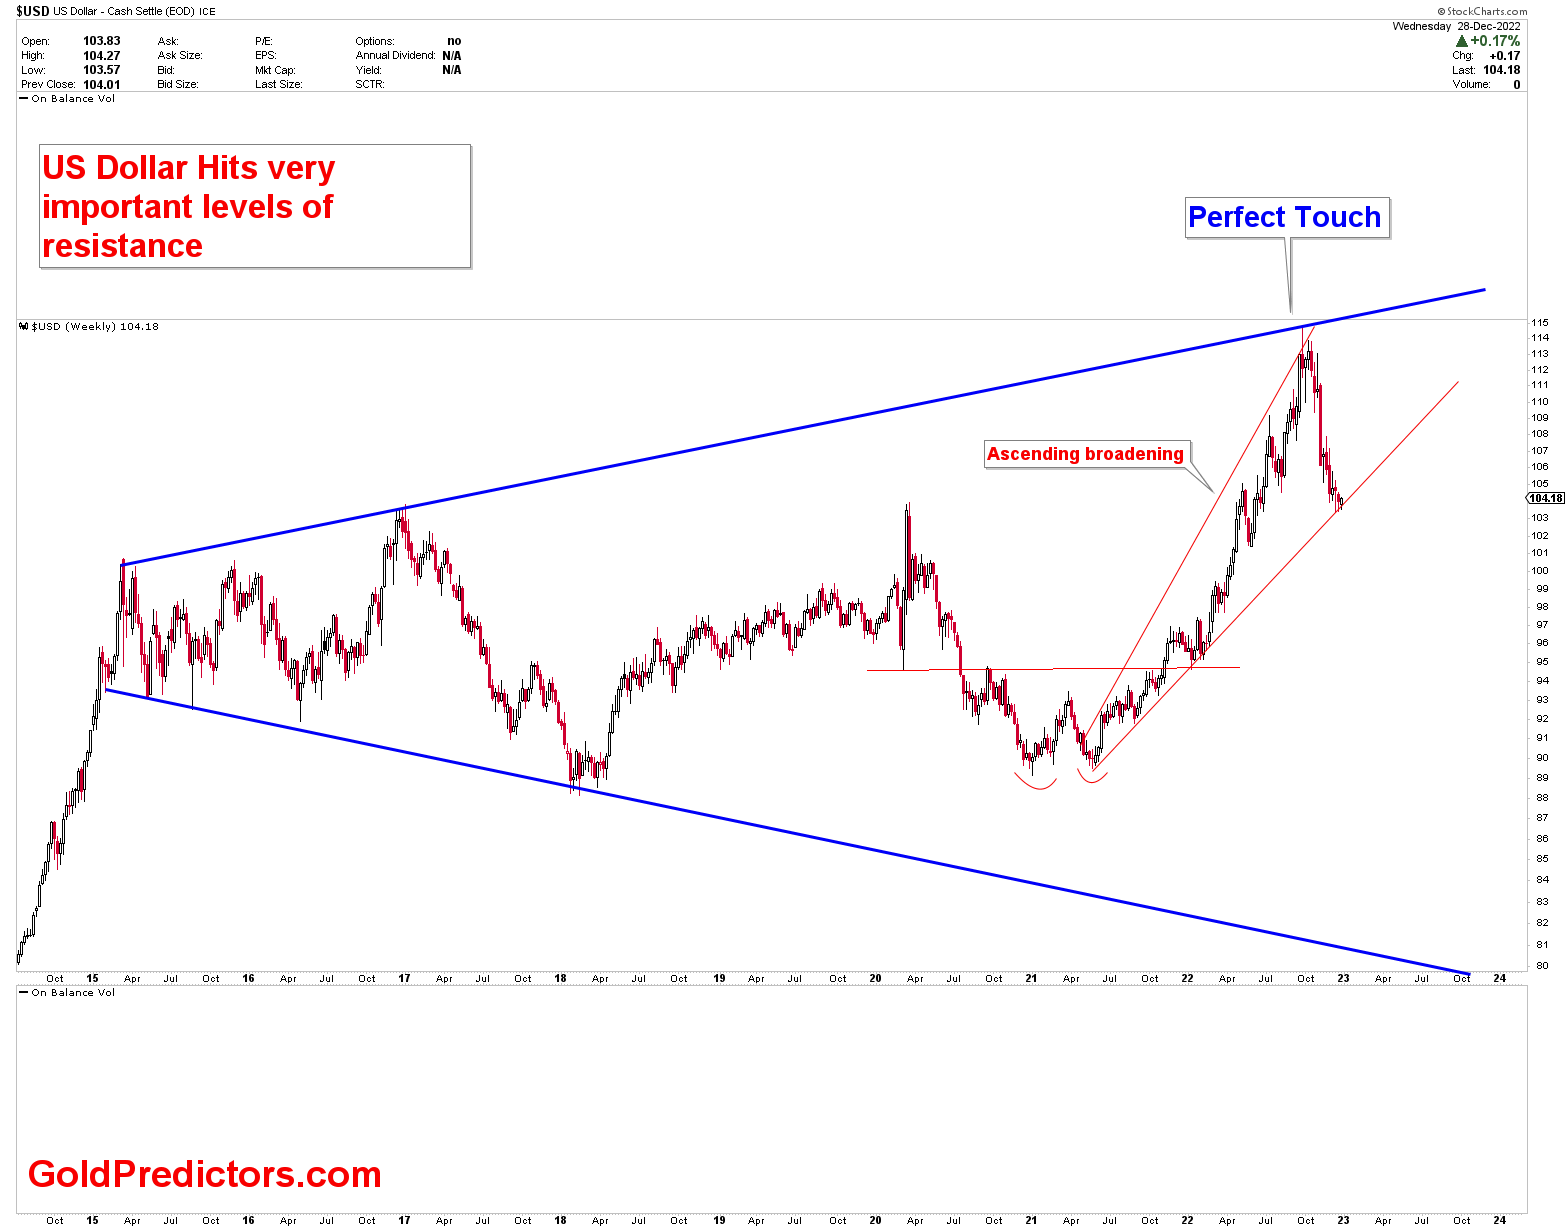
The formation of symmetrical broadening wedge patterns on the weekly chart indicates that the US dollar index will reach its target. Within the symmetrical broadening wedge, an ascending broadening triangle has formed, indicating that the US dollar could decline once the US dollar index is broken. The decline in the US dollar index is viewed as buying opportunity in gold market.
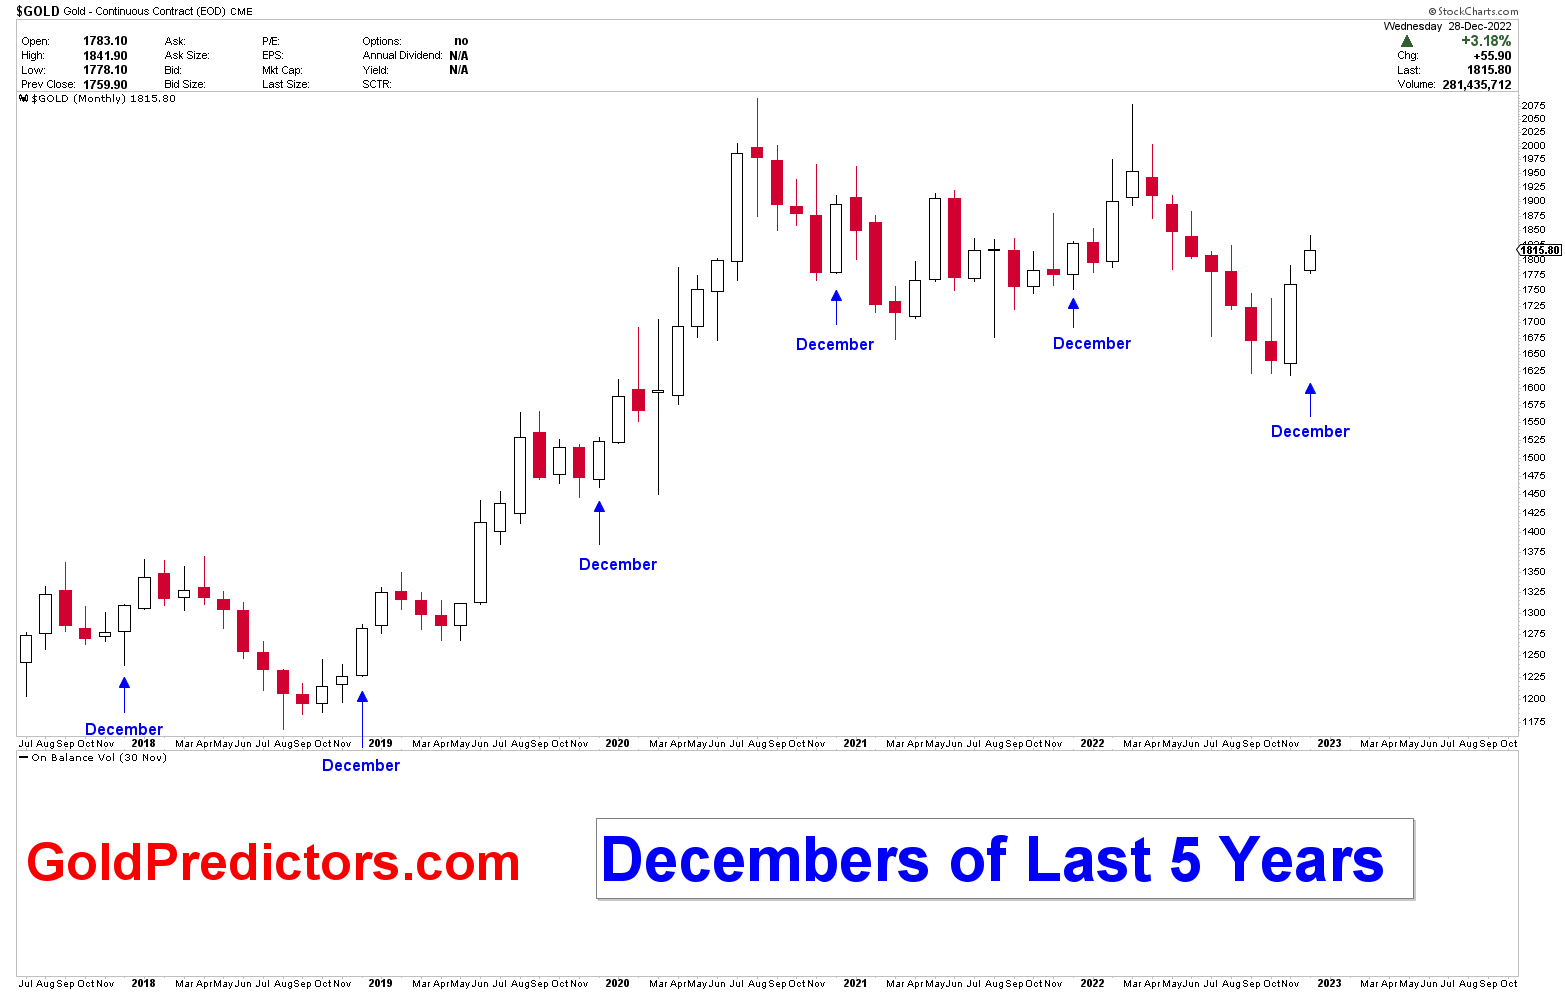
Below is an up-to-date chart for the month of December. The chart illustrates that December has been a positive month for the gold market. There are currently two days left to close the yearly candle on the gold chart. Positive choppy behavior is observed in the gold market due to the holiday season and the closure of major businesses across the globe.
Please subscribe to the link below to receive free updates.


