


Why Gold Could Soar in 2025 After the 2024 Technical Breakout
Gold has witnessed a significant breakout in 2024, pushing its price beyond key resistance levels. This development signals a potential long-term uptrend. Meanwhile, the Gold/Dow ratio has also broken out from a crucial resistance, indicating a shift in market trends. Investors are now keen to understand where gold prices are headed in 2025. This article will analyze these breakout patterns and their implications for future price movements.
Gold Breakout in 2024 Signals Start of a Long-Term Bull Run
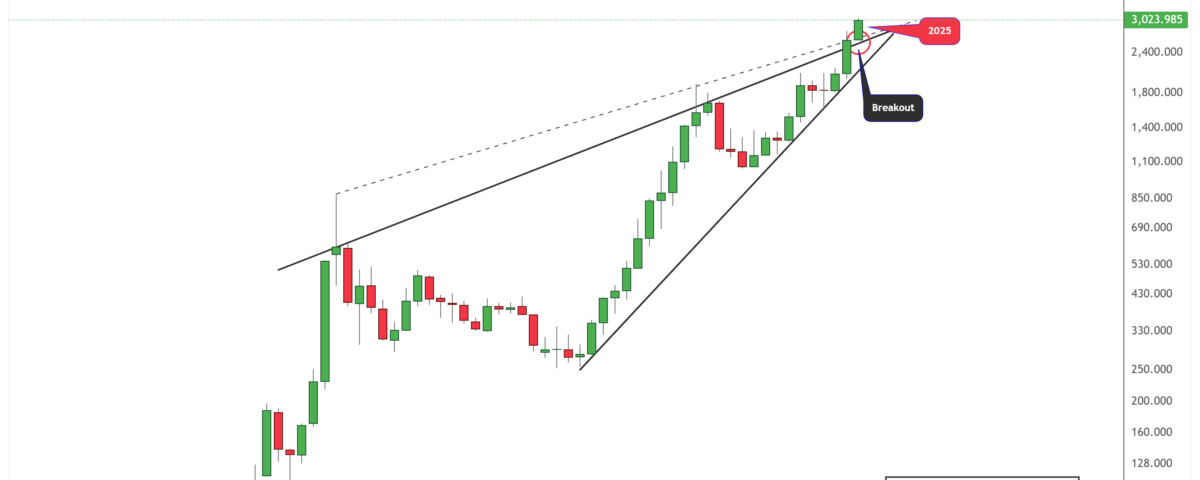
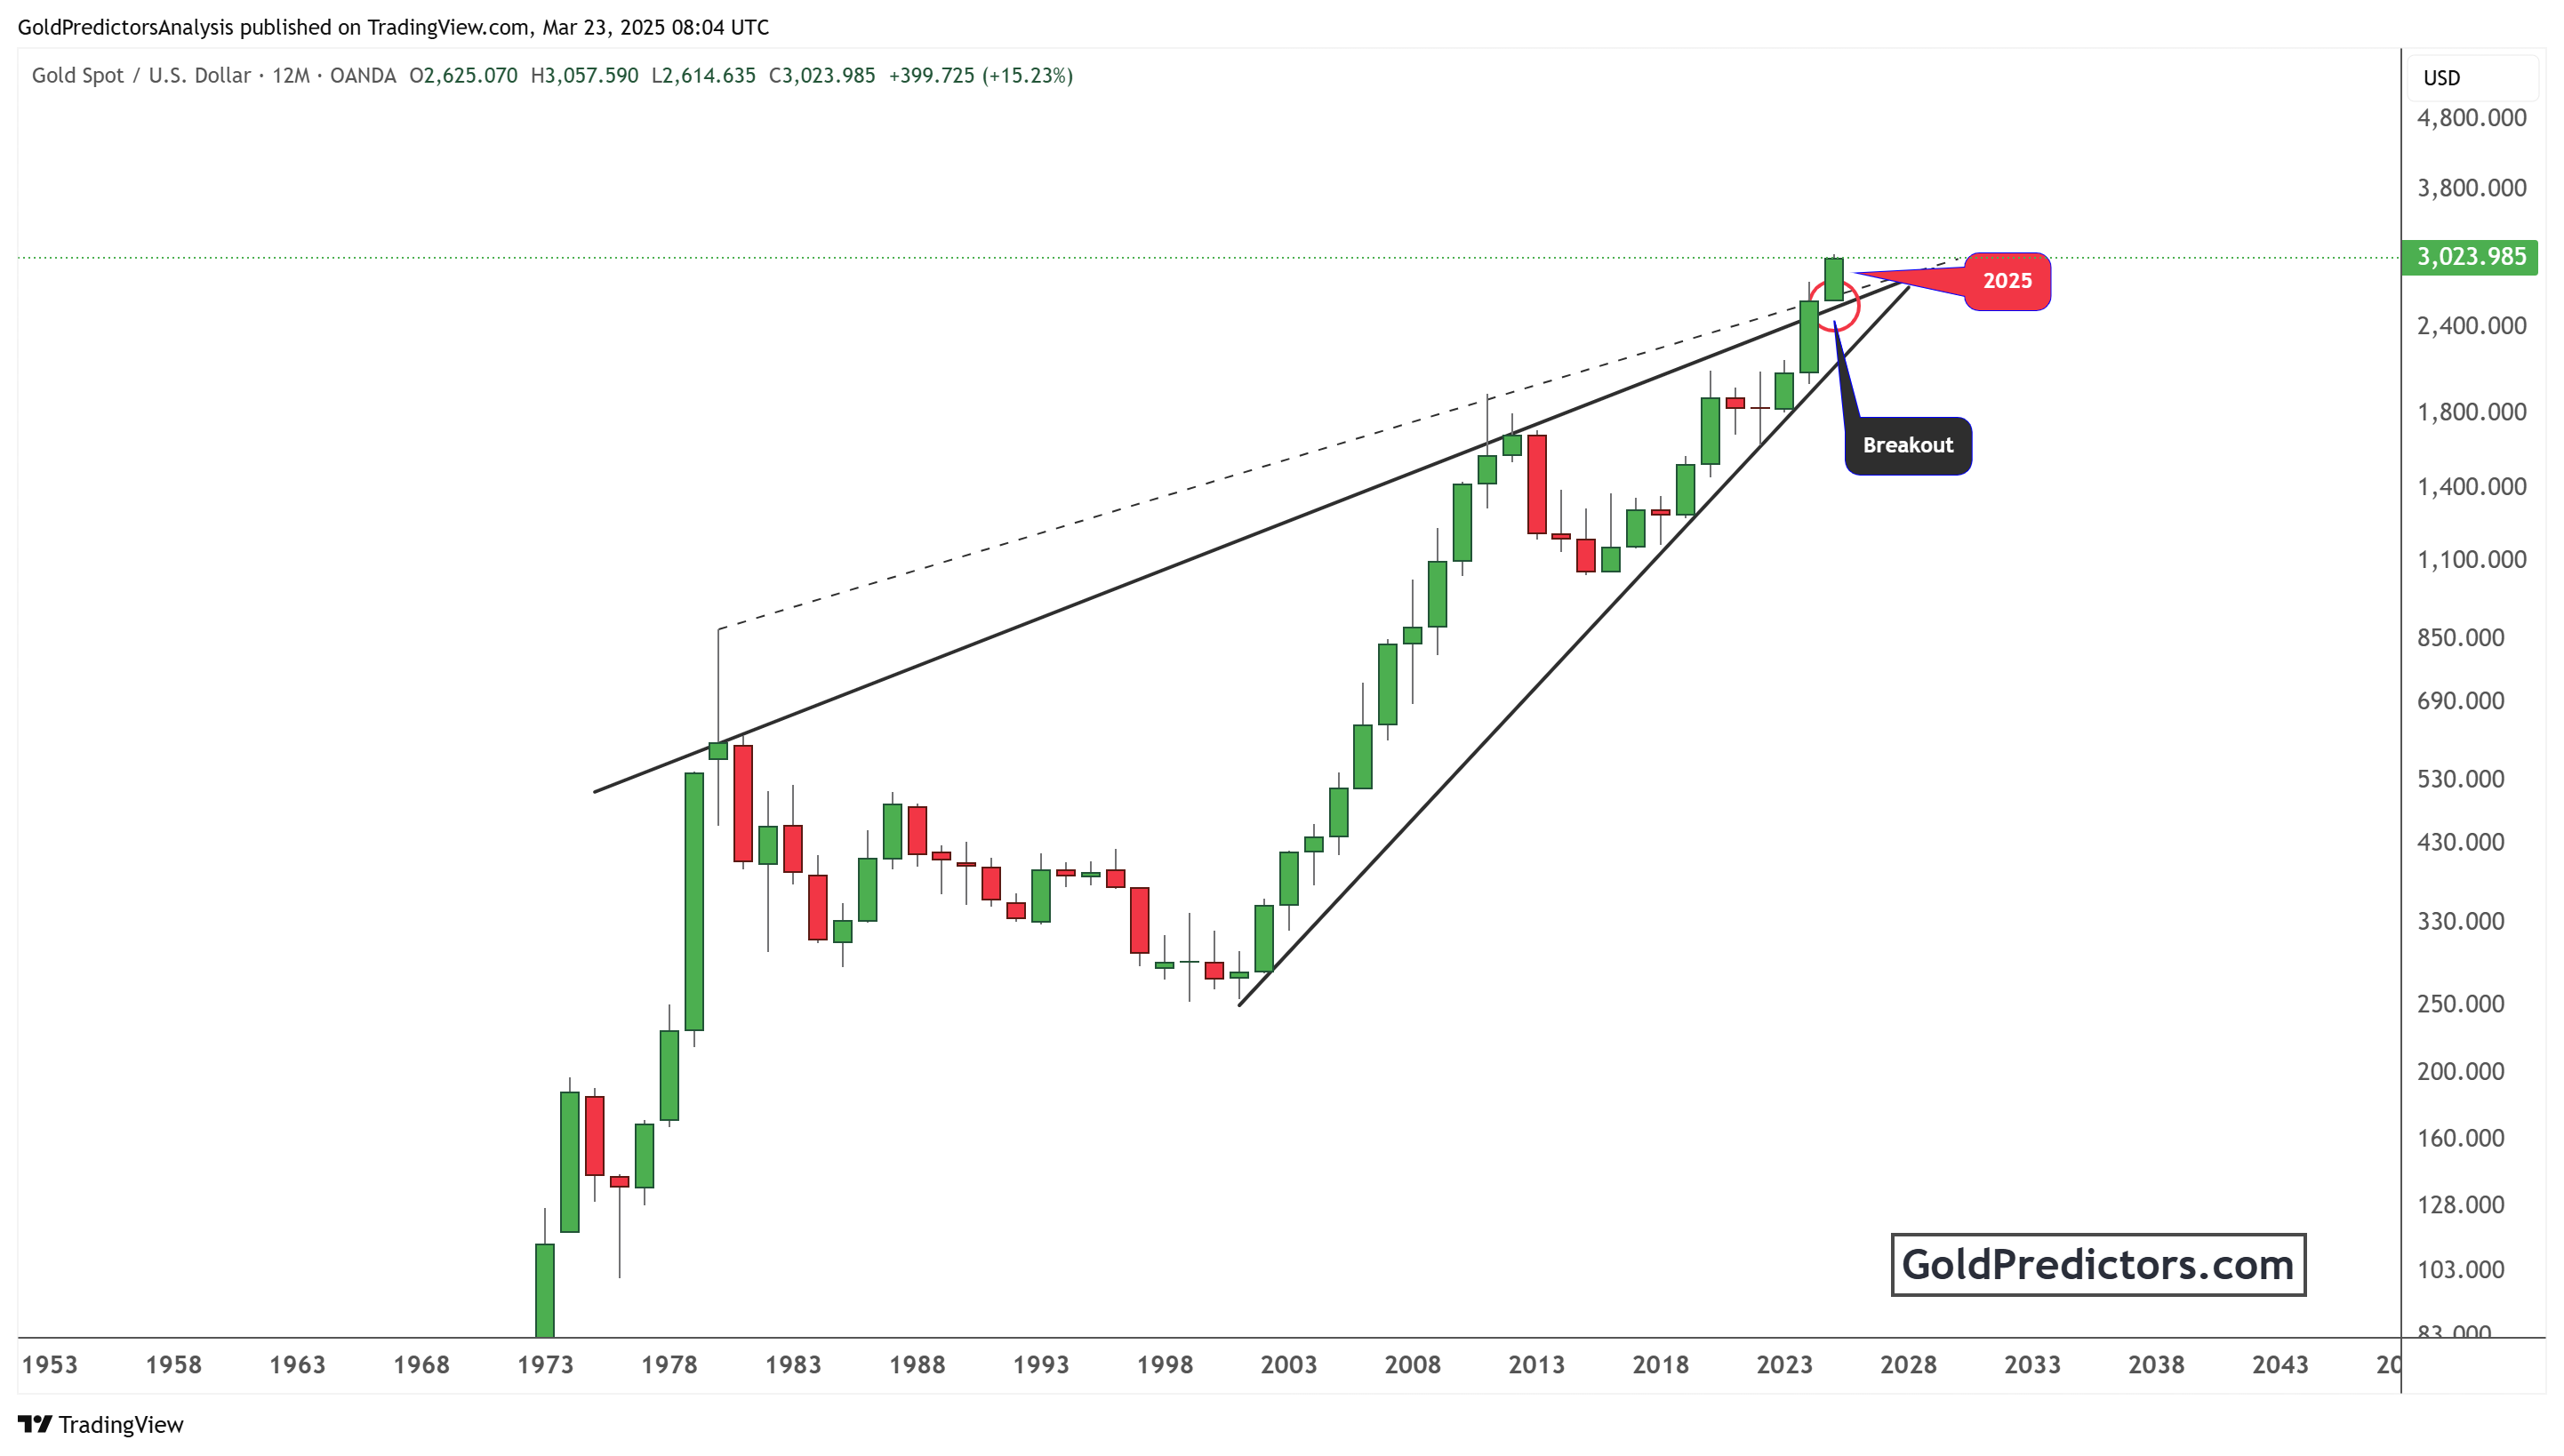
The yearly gold chart below highlights a significant breakout in gold prices in 2024. Gold has been in a rising wedge pattern for decades, and the latest breakout in 2024 and push higher in 2025 suggests a continuation of the long-term bullish trend. The price has surged above the black and dotted trend lines in 2025, indicating strong bullish momentum.
The historical trend shows that gold prices have respected key trend lines. Previous breakouts led to exponential price increases, as seen in the 1970s and early 2000s. The 2025 breakout follows a similar pattern. The breakout above the upper resistance of the wedge pattern suggests that gold could see further gains. If this trend holds, gold could target higher levels in the coming years.
Why Gold Is Poised for a New Bull Run in 2024
The sharp rally in gold in the 1970s was due to high inflation, a weakening U.S. Dollar, and geopolitical tensions. The collapse of the Bretton Woods system in 1971 removed the dollar’s gold backing, allowing prices to float freely. As inflation surged past 10% and oil prices spiked, investors rushed to gold as a hedge. The Federal Reserve’s delayed response to inflation further weakened confidence in fiat currencies. By 1980, gold reached a then-record high of $850 per ounce, driven by economic instability and fear.
In the 2000s, gold rose again due to rising debt levels, loose monetary policy, and the 2008 global financial crisis. Central banks slashed interest rates and launched quantitative easing, eroding real cash and bond returns. Investors turned to gold as a store of value amid growing concerns about currency debasement and systemic risk. Between 2001 and 2011, gold surged to over $1,900 per ounce. This rally was fueled by financial uncertainty and strong demand from emerging markets.
Based on these patterns, gold is likely to rise from 2024 onward. Inflation remains sticky, global debt has reached record levels, and geopolitical risks are intensifying. Central banks continue to buy gold, while many investors seek protection from currency volatility and economic shocks. With real interest rates still low and trust in fiat money weakening, the long-term drivers that pushed gold higher in past decades are back in play. The breakout on the yearly chart in 2024 has opened the door for a gold rally similar to those seen in the past.
Gold/Dow Ratio Breakout: Indicating a Shift in Market Trends
The Gold/Dow ratio further validates the gold long-term breakout. Gold/Dow ratio measures gold’s performance relative to the stock market. The weekly chart for this ratio shows that a breakout from a long-term downtrend signals a shift in investor sentiment.
The chart shows a symmetrical triangle pattern that has been forming since 2018. This pattern represents a period of consolidation before a significant price movement. The breakout in 2025 confirms that gold is gaining strength against the Dow Jones Industrial Average.
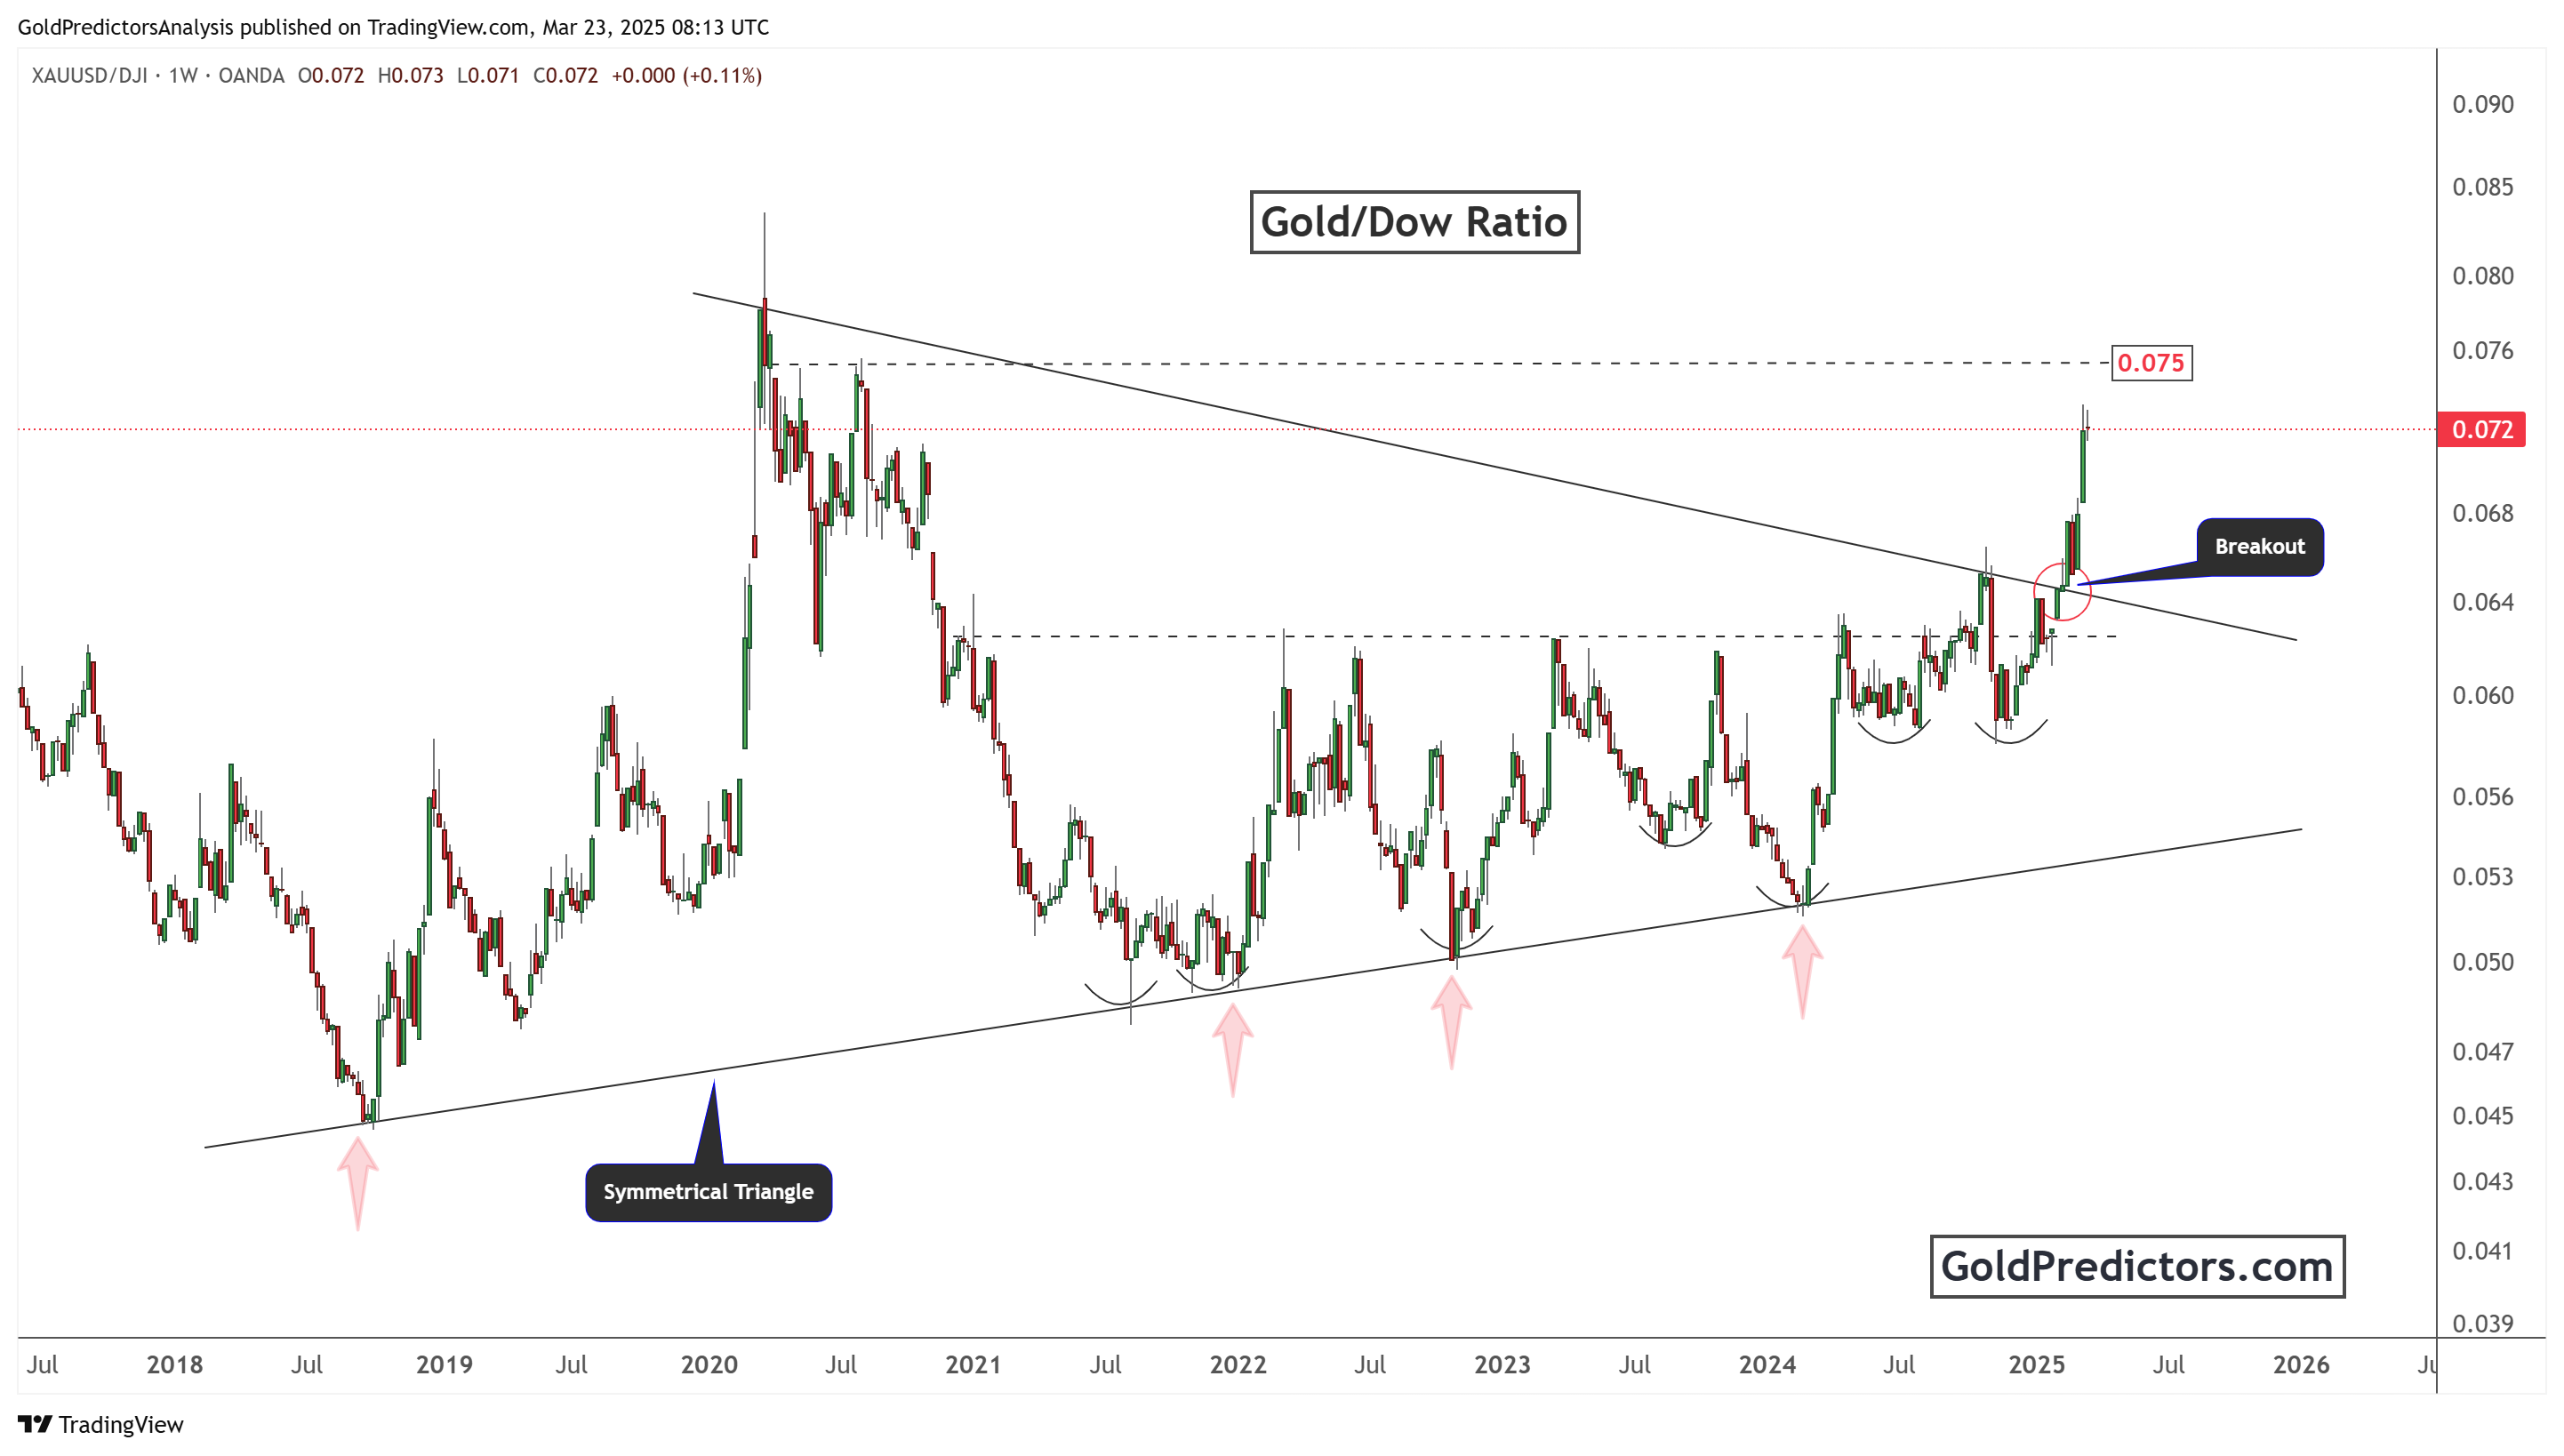
This ratio historically rises during economic uncertainty, inflation, and stock market weakness. The recent breakout suggests that gold is becoming a preferred asset compared to equities. If this trend continues, it could mean a period of stock underperformance while gold strengthens.
How to Trade Gold During Economic Uncertainty?
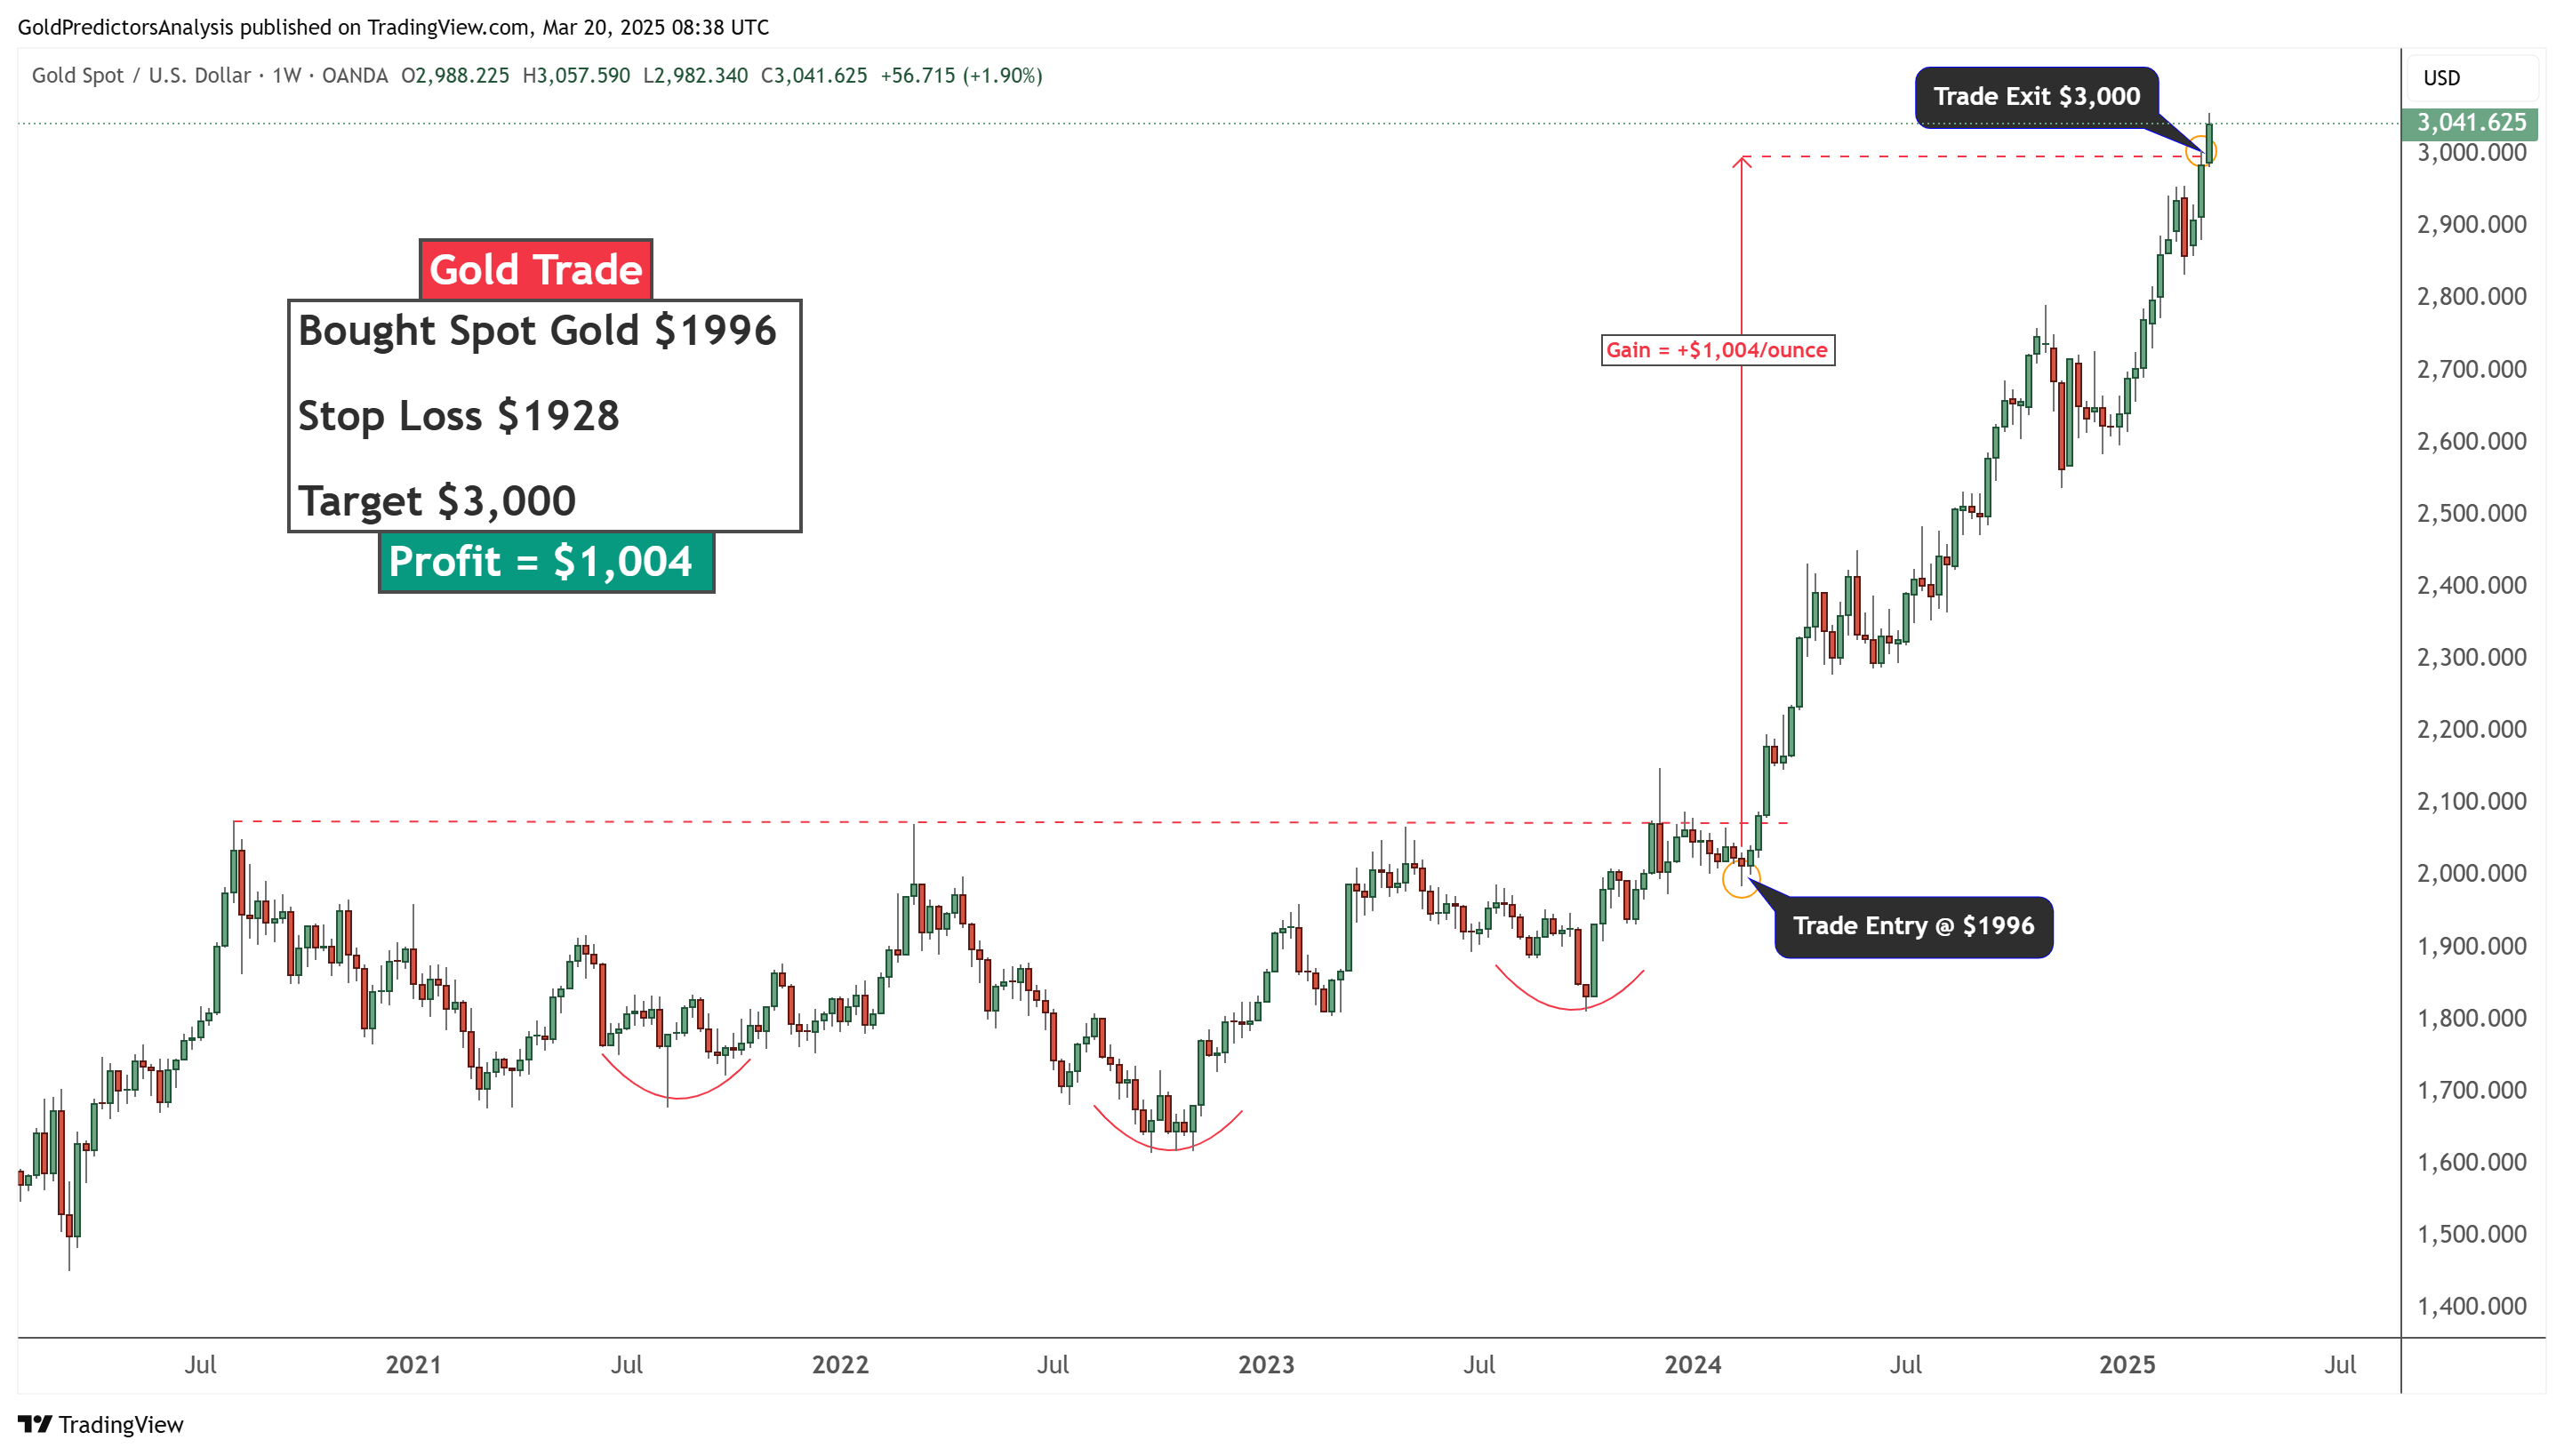
There are multiple strategies to benefit from the ongoing gold crisis and economic uncertainties. The preferred long-term approach is executing swing trades in the gold market. The chart below shows a swing trade delivered to premium members via email. The market bottomed just two days after the trade was issued. This trade generated a profit of $1,004 per ounce. It was entered at $1,996, and the target was hit at $3,000. The trade identified the market’s top and bottom, capturing multiple short-term swings. Despite these fluctuations, the trade ensured a profitable outcome.
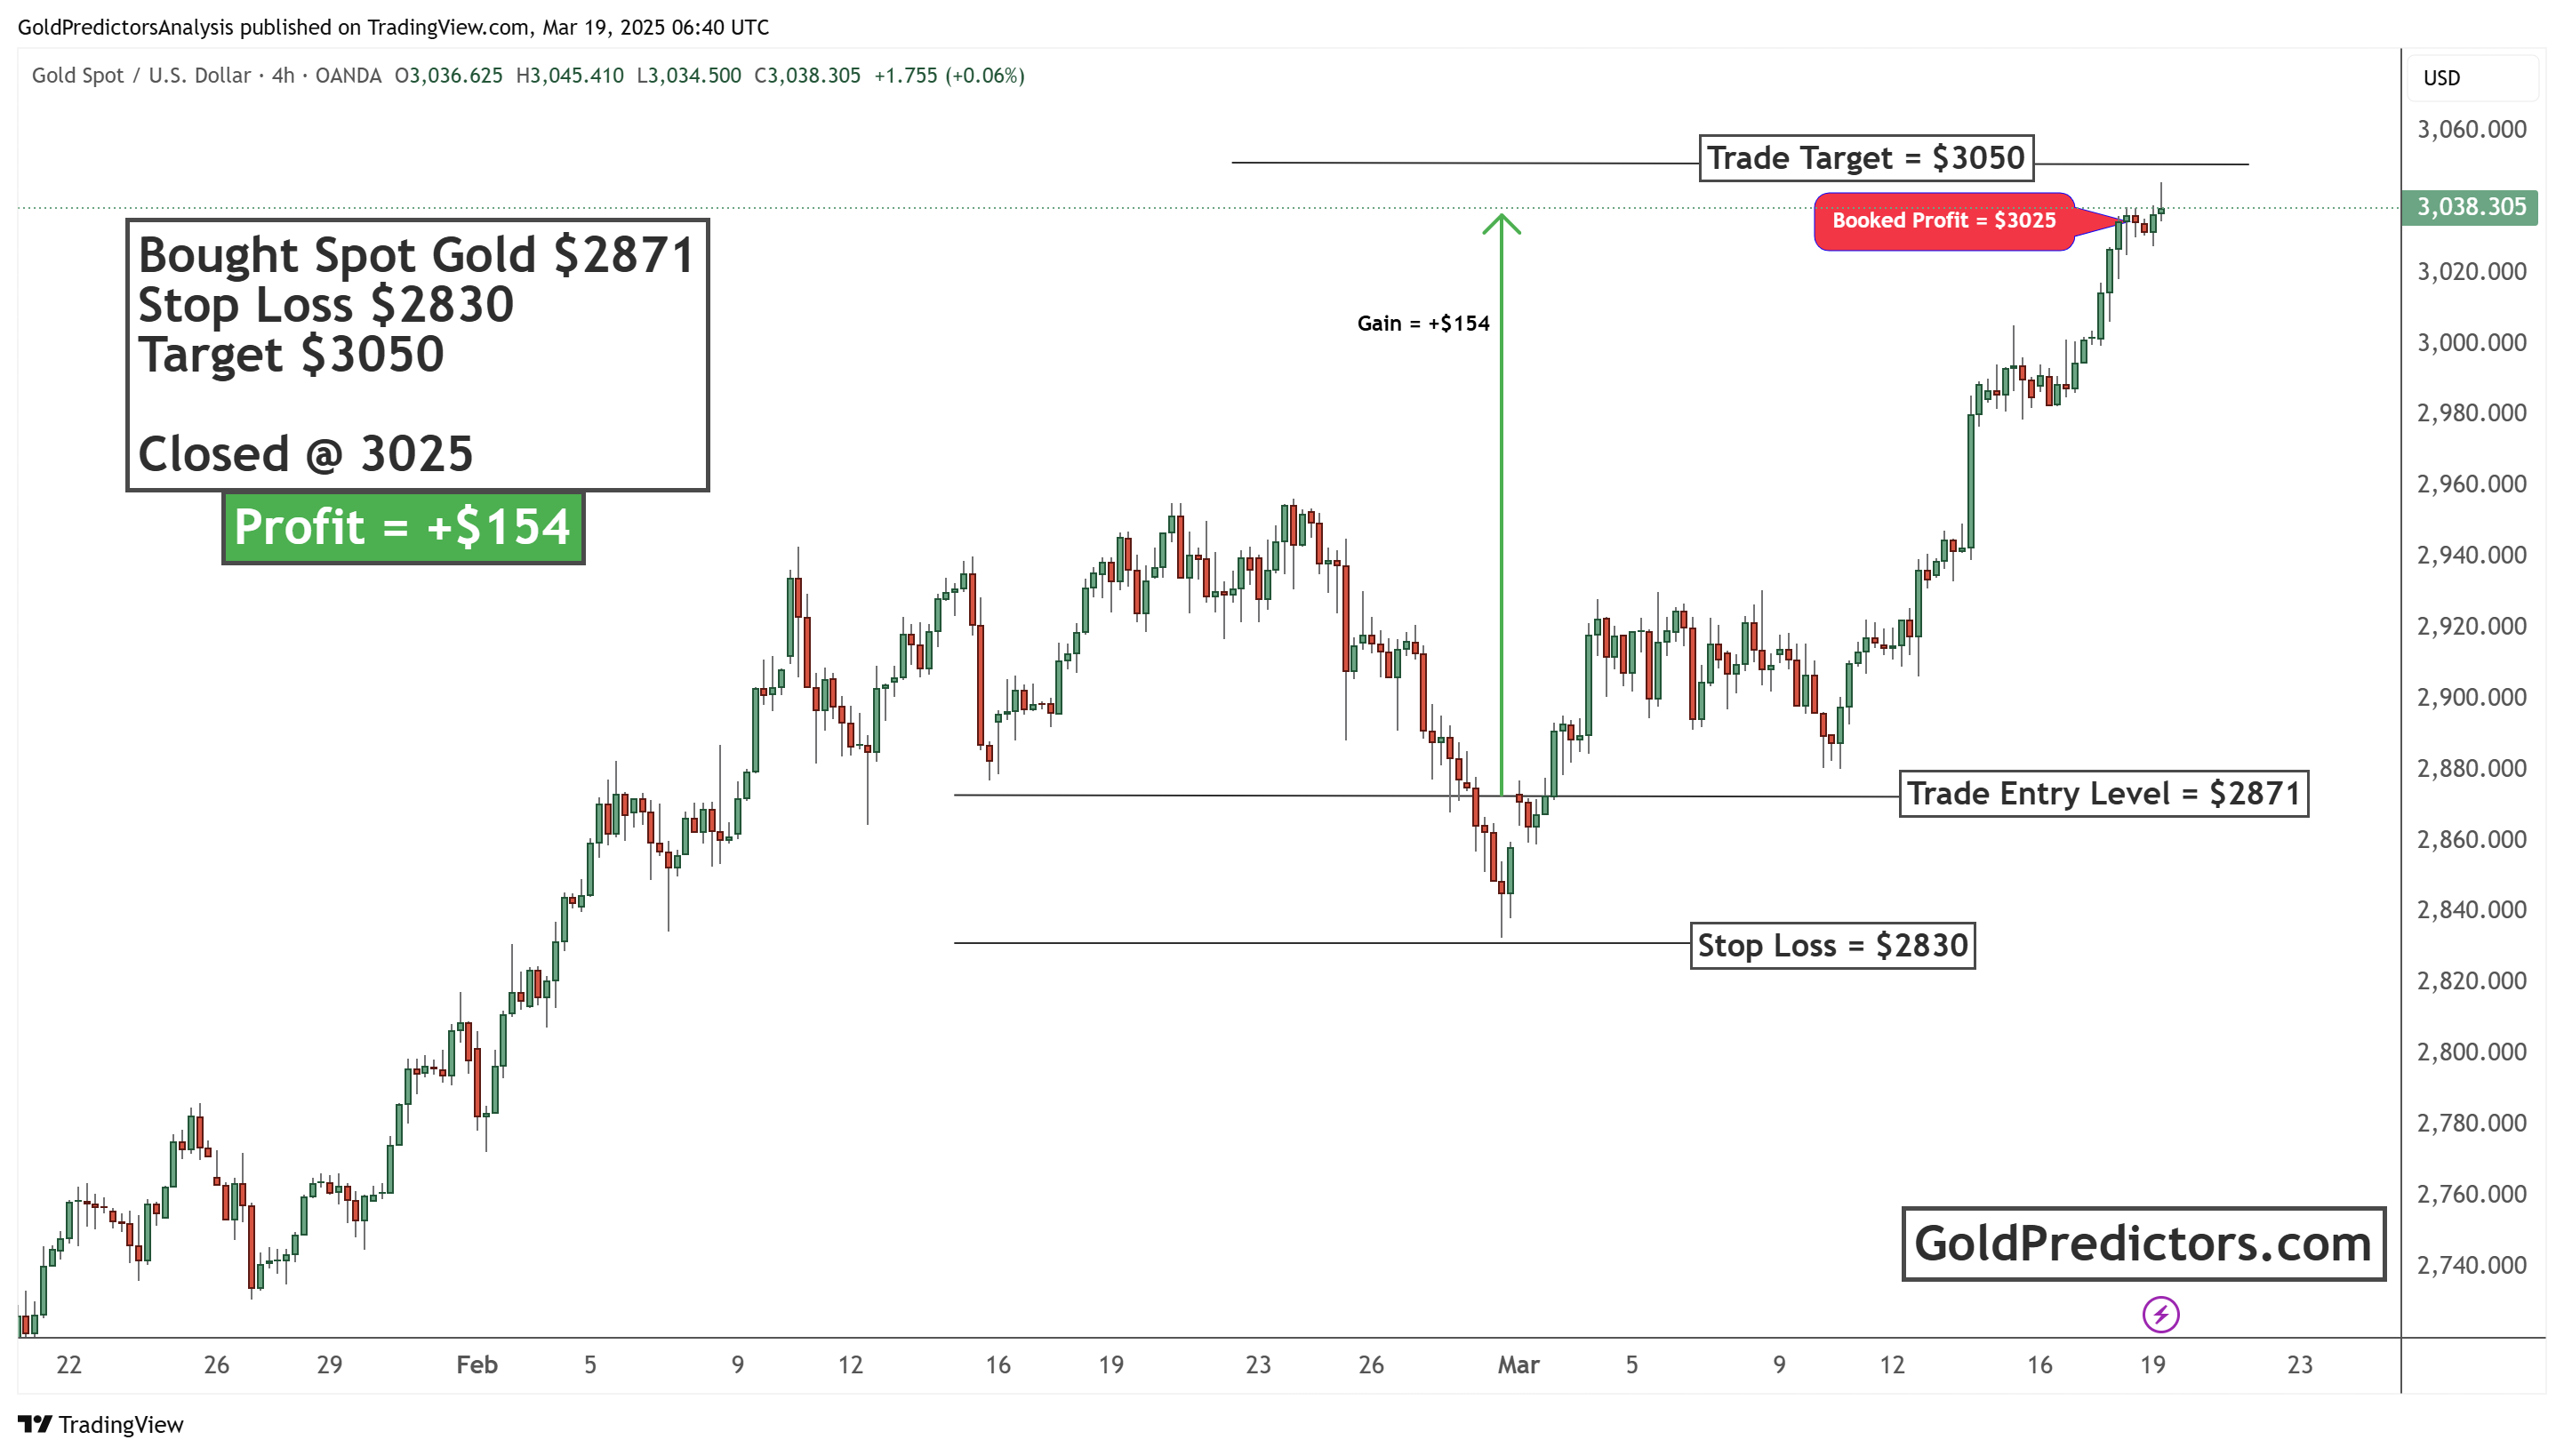
Another chart below shows a successful gold trade by Gold Predictors. Gold Predictors used a different strategy from the swing trade, entering this position with a short-term time horizon. They entered the trade at $2,871, set a stop loss at $2,830, and aimed for a target of $3,050. They eventually closed the position at $3,025, securing a profit of $154 per ounce. This setup demonstrates the importance of strategic entry and exit points. Setting a stop loss controls the risk, and taking profit near the target maximizes gains. This trade was sent via WhatsApp to premium members and resulted in a profitable outcome.
Conclusion: What to Expect for Gold in 2025 and Beyond?
Gold’s breakout in 2024 marks the beginning of a potential long-term bull run. Historical patterns from the 1970s and 2000s show that similar conditions—such as inflation, global uncertainty, and monetary easing—led to explosive gold rallies. In 2024, those conditions have returned. Inflation remains persistent, geopolitical risks are rising, and trust in fiat currencies continues to weaken. Strong central bank buying and a technical breakout above long-term resistance set the stage for higher gold prices in the years ahead.
The breakout in the Gold/Dow ratio further confirms a shift in market sentiment toward gold over equities. This trend, supported by fundamental and technical signals, suggests that gold will likely outperform as economic uncertainty grows. Both long-term swing trades and short-term setups have effectively captured gains during this move. With volatility rising and macro risks mounting, gold remains a key asset for investors seeking protection, stability, and profit in an uncertain global environment.


