Weakening US Dollar Boost Gold Demand
Markets are repositioning their USD trades as the month comes to a close and important economic data are about to release this week. The important economic data are ADP employment change, JOLTS Job Openings, and Pending Home Sales data. On the other hand, FED Chairman Powell’s speech will have an impact on the markets. Protests against new Chinese lockdowns and increased vaccination campaigns for the elderly indicate that China is likely to abandon its strict zero-Covid policy and reopen the economy. China, the world’s largest gold consumer, is relaxing Covid restrictions in a few cities. The reopening of markets in a few cities will increase jewellery demand in the country. Investors, on the other hand, are wary due to the contraction of business activities in China. The manufacturing PMI in China fell 2.5% in November, while the non-manufacturing PMI fell by 4%.
Weakening US Dollar Boost Gold Demand
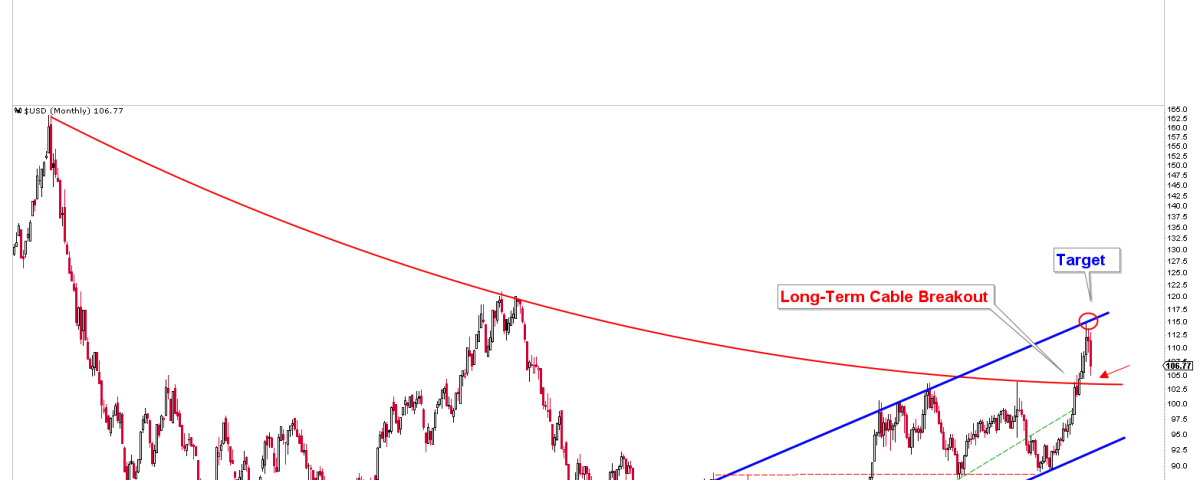
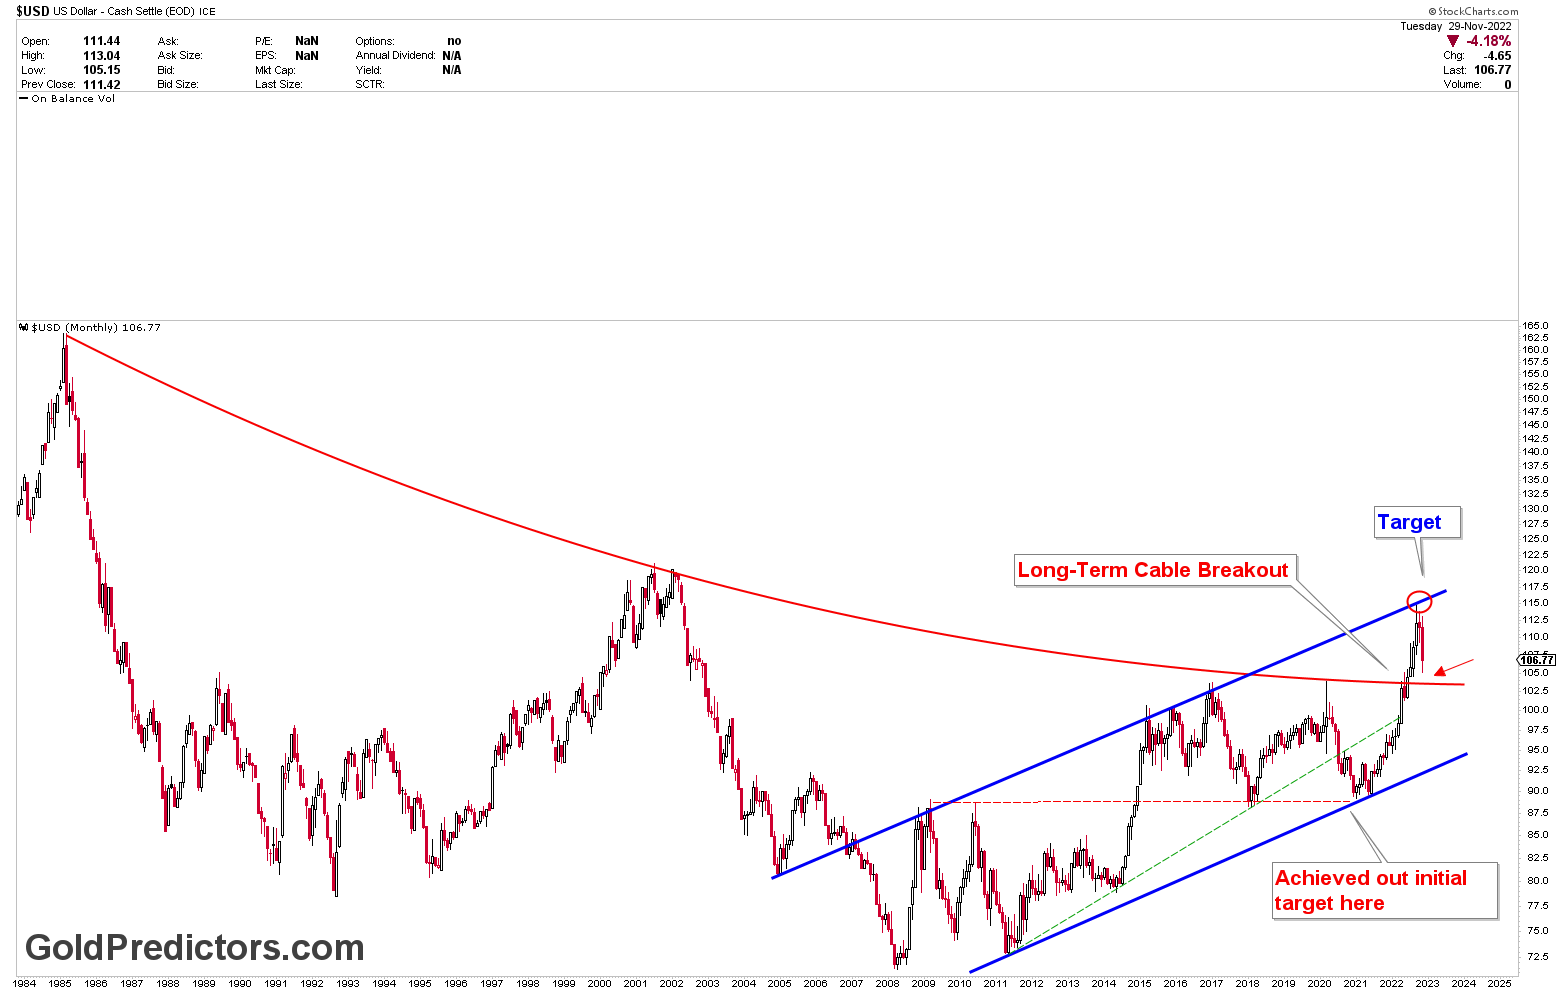
The monthly chart of the US dollar index is shown below. The chart depicts the index moving in blue rising channel lines. The chart was created a long time ago, when the US dollar index crossed the red dotted line and we expressed concern about the higher US dollar index. The US dollar index rose from 90 to 115, hitting the most important resistance at the blue channel line. The red curve line, which the index is currently supporting, shows the significance of first support from the highs of symmetrical broadening wedge.
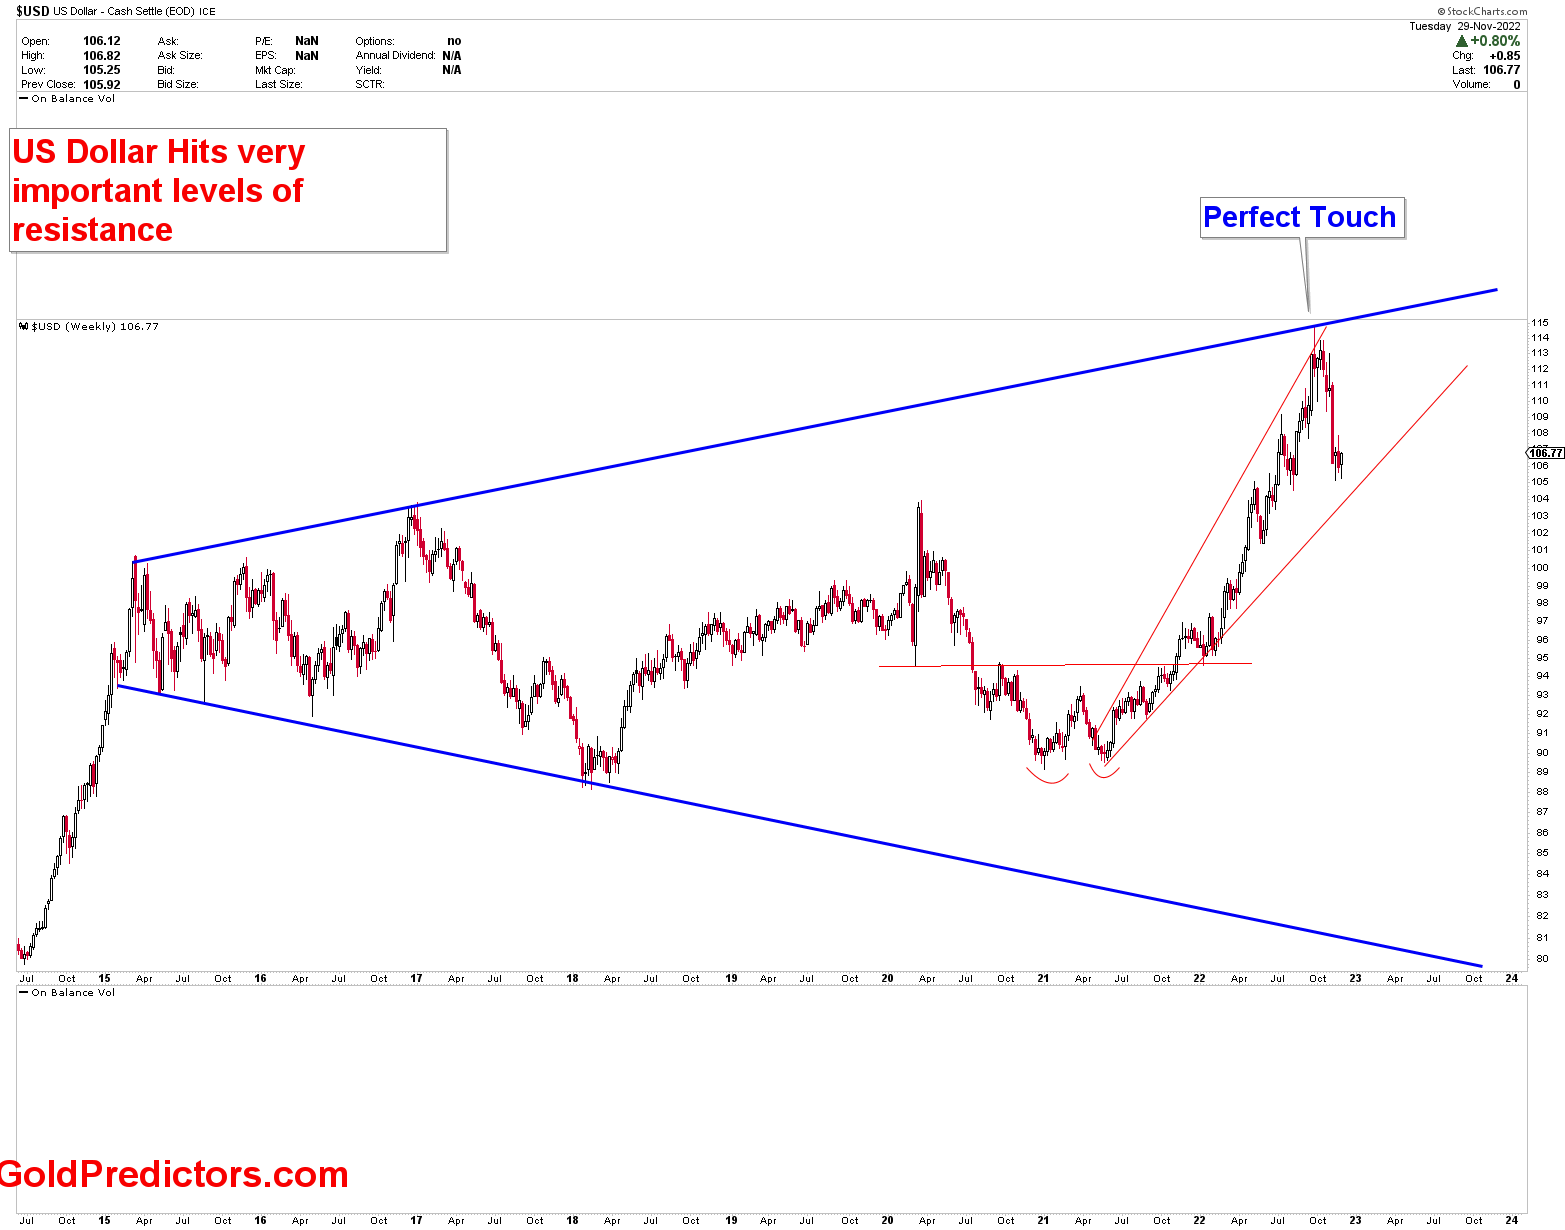
The weekly chart below support the same scenario for the monthly chart. The weekly US dollar index chart shows that the index retreated lower after hitting the symmetrical broadening wedge where resistance was encountered. If US dollar drops further, gold will benefit from this drop. December has come whereby the fake moves are possible. It has been noticed that December of last five years were bullish.
Please login to read full article!
Please subscribe to the link below to receive free updates.


