


Gold Targets $3,000 Amid Geopolitical Tensions
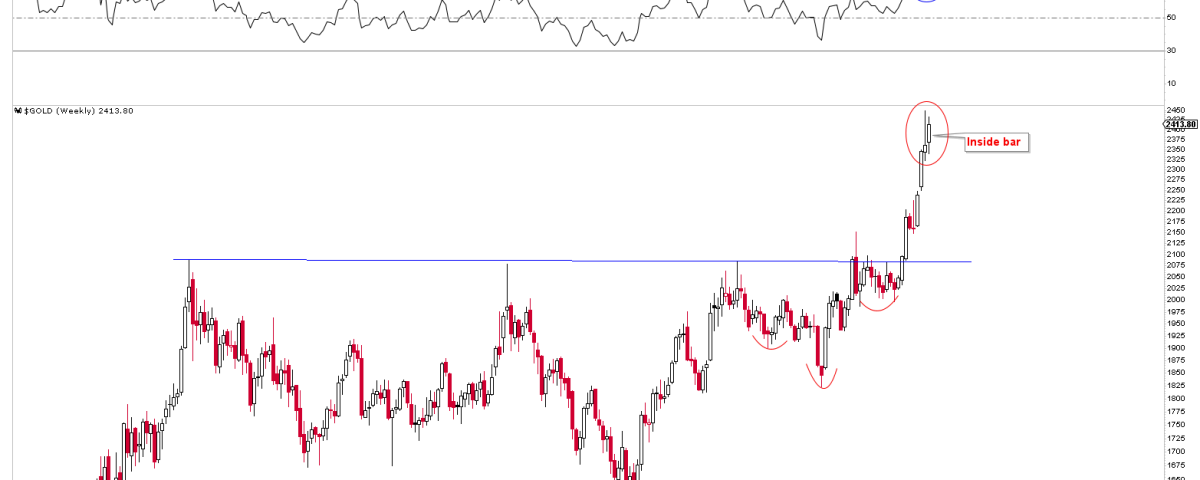
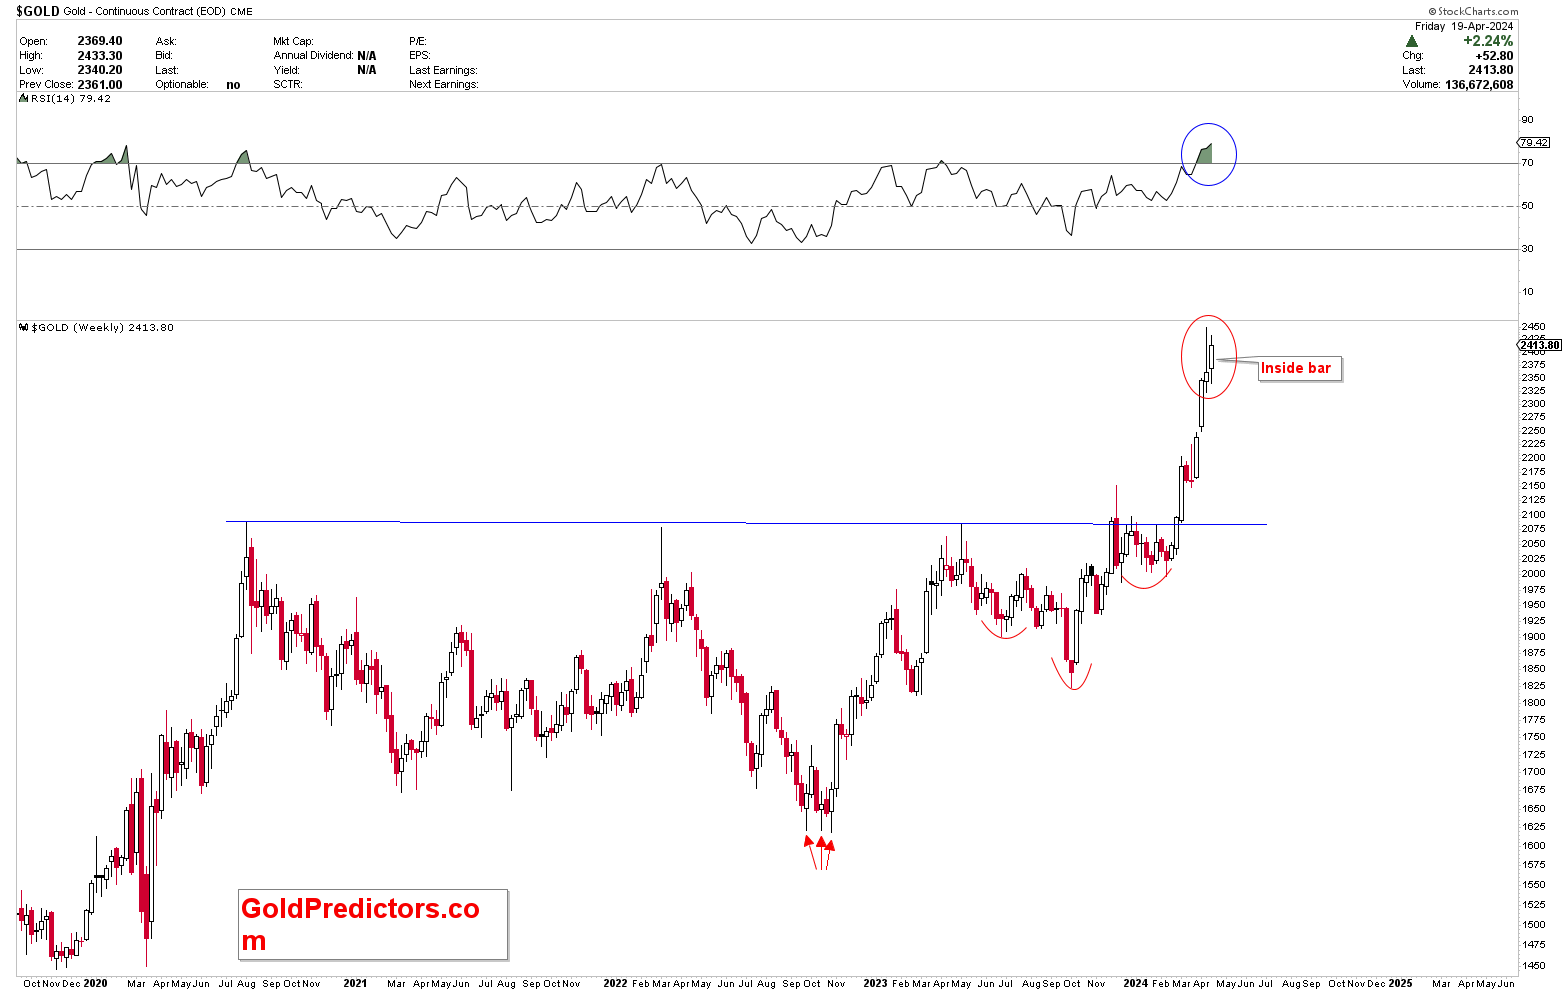
Gold has maintained a consistent presence in the financial markets, often considered a safe haven during economic uncertainty. This past week, gold’s price movements have shown a consolidation pattern, oscillating within a range of $90, avoiding a downward correction that the market has been expecting after such a strong rally. This consolidation has set the stage for another bullish outlook. The price close of the week was intense, resulting in an inside bar on the weekly chart. Inside bars are significant as they often indicate a potential shift in market dynamics and hint at a future change in price direction. The strength of this inside bar, which emerged after a close at higher levels, suggests a solid upcoming move if the bar’s upper limit is broken, possibly leading to new highs. The gold rise due to geopolitical tensions might be huge.
The short-term cycles were discussed with premium members as a potential peak for gold prices on April 9th, with the highest price point reaching April 12, 2024. Since then, prices have not broken to new highs, entering a short-term corrective phase. We are on the seventh day of this correction, starting April 9th. This timing aligns with the short-term cyclic patterns discussed earlier. This indicates that gold may establish a market bottom next week and potentially rally after that. A weekly letter will discuss further insights into these cycles with premium members.
Geopolitical Tensions and Future Price Targets
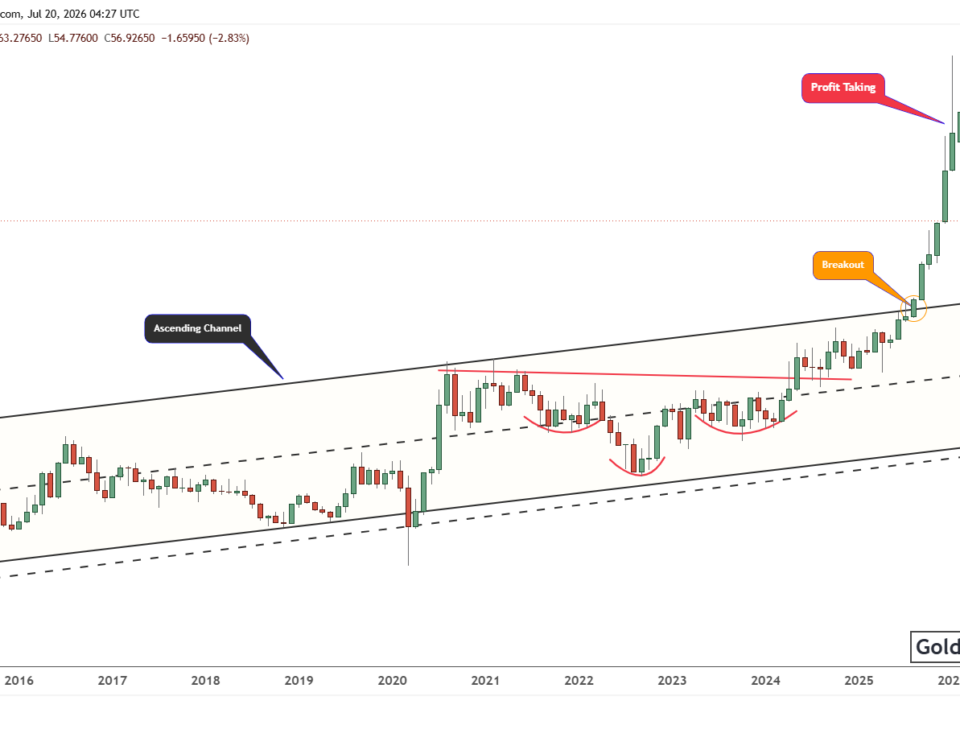
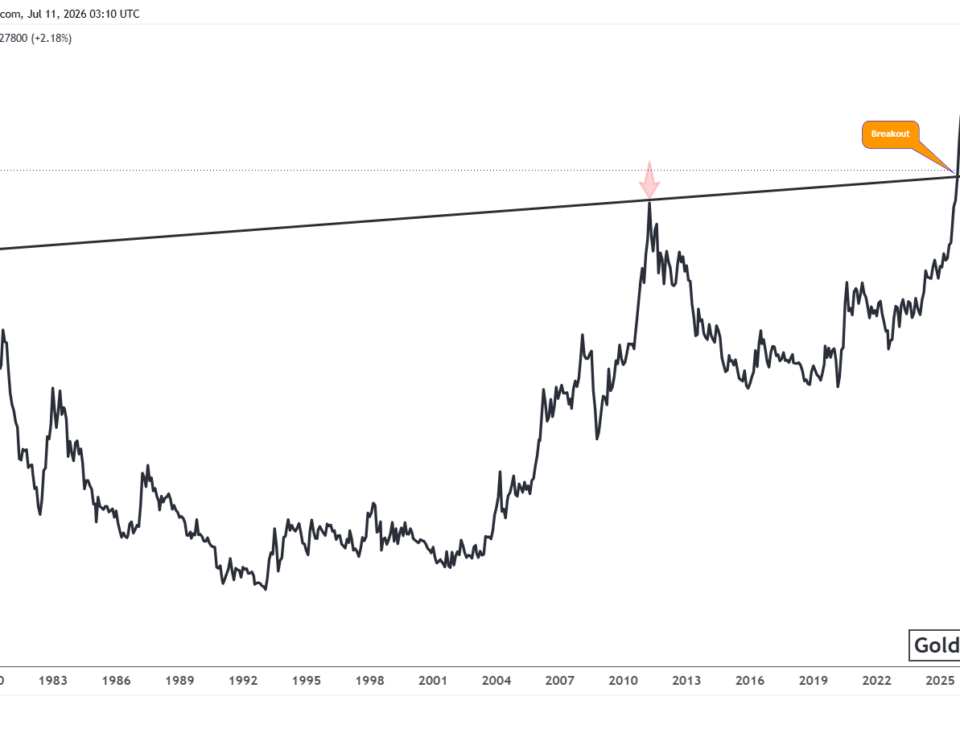
Recent escalations in geopolitical tensions in the Middle East have spurred increased demand for gold as a haven asset. These tensions are impacting investor sentiment and starting to reflect in the gold market’s price actions. Last week’s inside bar formation suggests we might be on the brink of another significant surge in the gold market. This is underscored by the breach of a long-term pivotal resistance at $2075, which had capped price movements for many years. The breakout from this critical resistance point suggests a potentially substantial upward trajectory for gold prices.
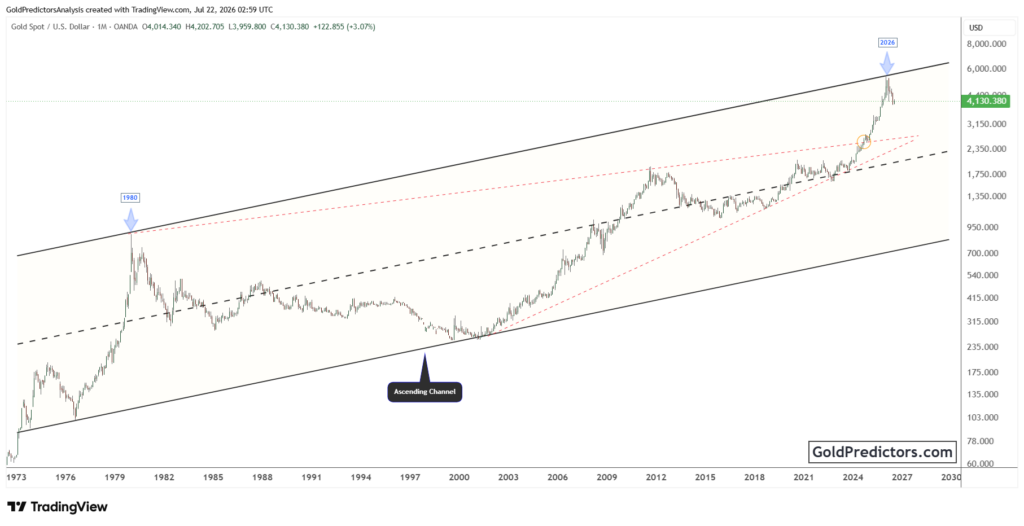
A chart analysis shared with members in 2022 and recently updated shows that gold prices are currently situated within an ascending broadening wedge. This pattern is further corroborated by an inverted head and shoulders formation, projecting a potential target in the $3,000 region. While this target may seem ambitious given the current price levels, the prevailing market volatility, amplified by global crises and the theoretical use of nuclear weapons, adds to the plausibility of such a surge. These factors will likely significantly influence the gold and broader commodity markets, including oil. The support and resistance of the gold market will be discussed with premium members. The gold rise due to geopolitical tensions might hit the regions above $3,000.
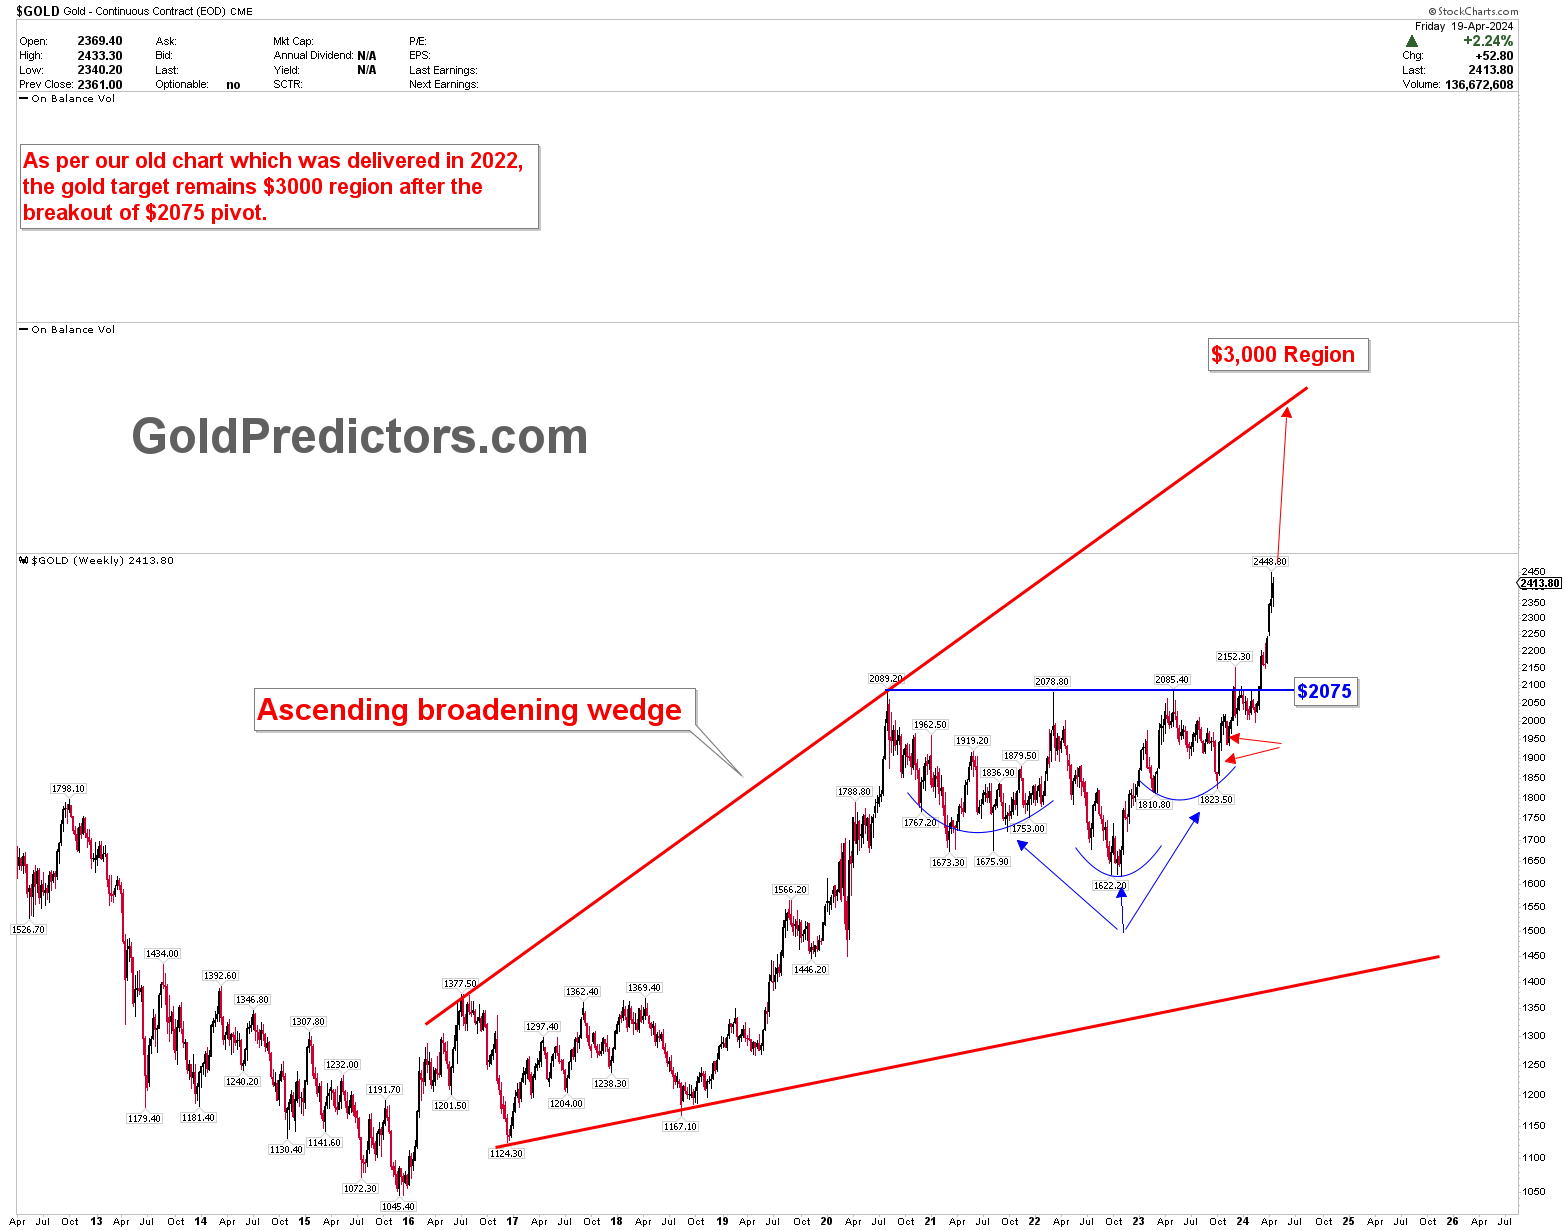
The confluence of market patterns and geopolitical events presents a complex but potentially rewarding scenario for gold investors. As the situation unfolds, the strategic positioning and analysis of market signals will be crucial for capitalizing on these volatile conditions’ opportunities. With the market at a critical juncture, investors and traders must stay attuned to global events. The market signals to navigate the uncertainties and harness the potential gains from gold’s dynamic movements. As per the above explanation, the breakout from $2,075, indicates that gold is targeting $3000.
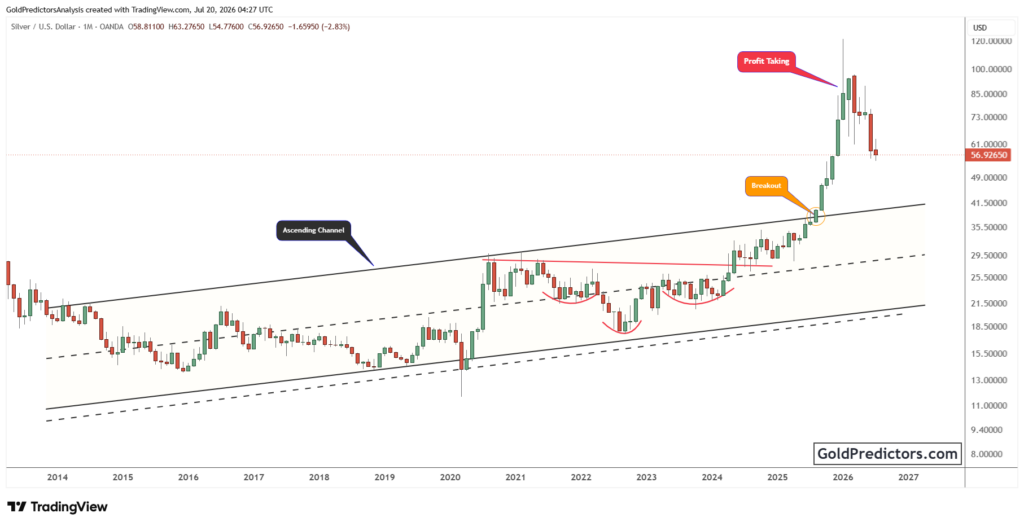
To receive gold and silver updates and trading signals, please subscribe to premium membership using the link below.