


Silver vs. Gold: Breakout from Multi-Decade Resistance Signals Outperformance
Silver (XAGUSD) is gaining strength as it approaches the upper boundary of a multi‑decade consolidation pattern. The latest push against long-standing resistance signals a significant technical development and indicates that silver is building momentum beneath a major ceiling. At the same time, the silver‑to‑gold ratio has turned higher after holding key support and breaking its downtrend line. This combination suggests improving relative strength in silver and indicates the early stages of a potential phase where silver could outperform gold.
Silver Approaches Multi-Decade Resistance with Strong Breakout Potential
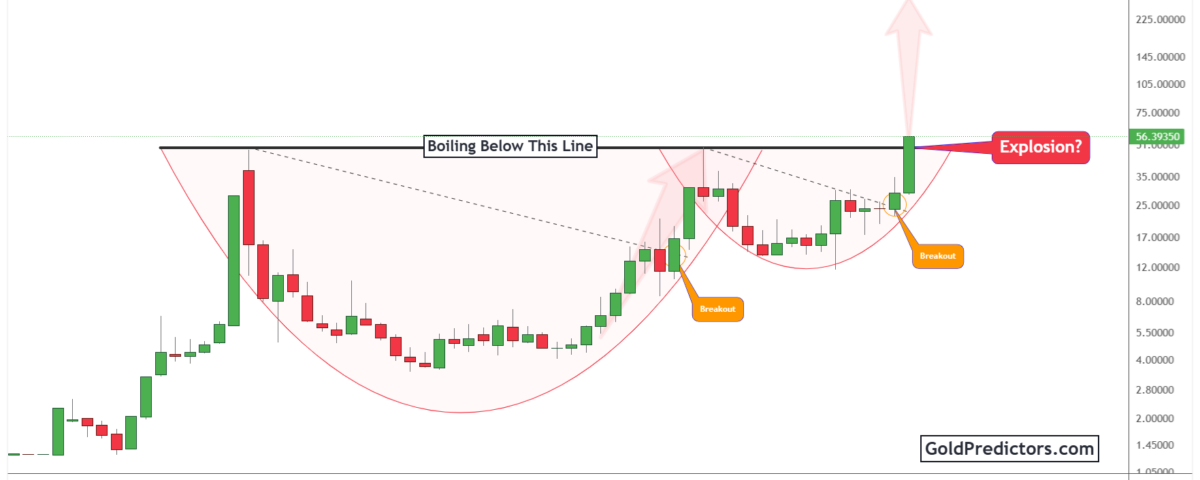
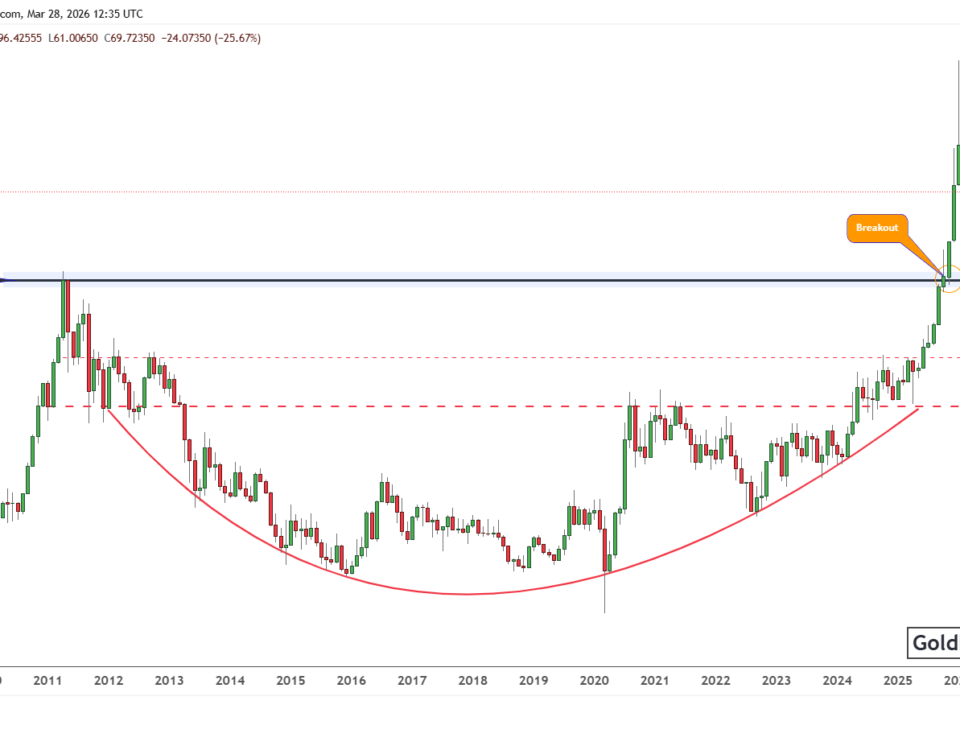
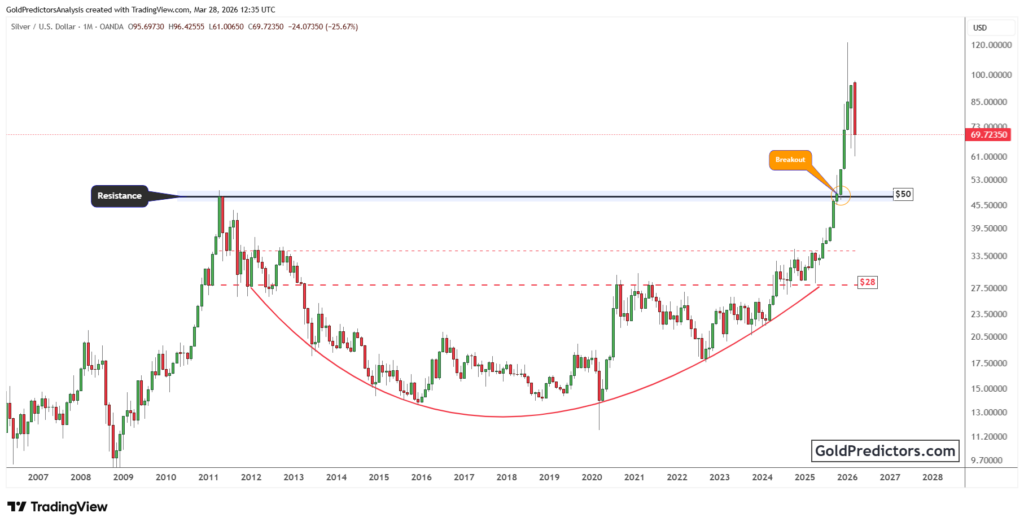
The silver chart below shows a massive cup and handle formation that stretches from the 1980 peak. Silver has returned to the $50 resistance area multiple times, including the peaks in 1980, 2011, and now late 2025. After years of consolidation beneath this critical resistance, silver is once again testing the zone with strong upward momentum, approaching levels last seen during previous peaks.
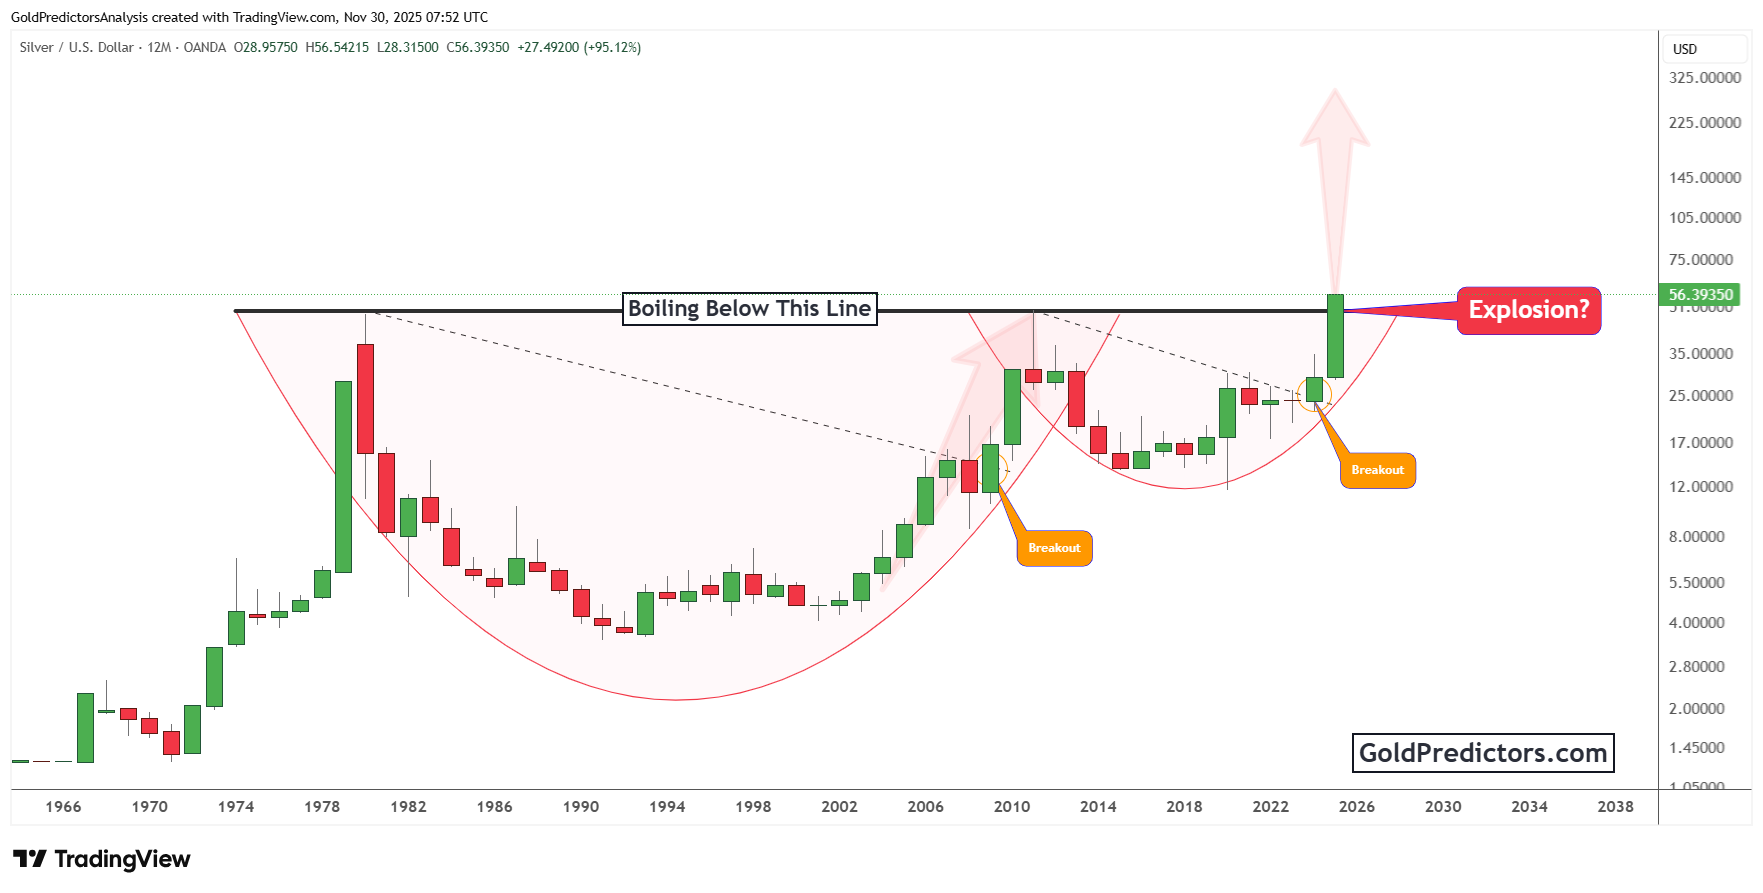
Silver’s latest breakout follows the completion of another rounded base that mirrors the structural setup seen in the early 2000s. That earlier pattern preceded a sharp rally into the $50 zone. The development of multiple bullish bases near key resistance levels highlights persistent demand and upward momentum. This recurring behavior near a long-standing ceiling indicates that silver may be preparing for a significant move.
Additionally, the repeated formations beneath key levels suggest a prolonged period of compression and accumulation. The recent approach toward the upper boundary suggests strengthening momentum and growing pressure beneath a critical level. If silver breaks through this level with conviction, it may set the stage for a strong upward move.
Silver-to-Gold Ratio Turns Higher, Signaling Silver’s Emerging Outperformance
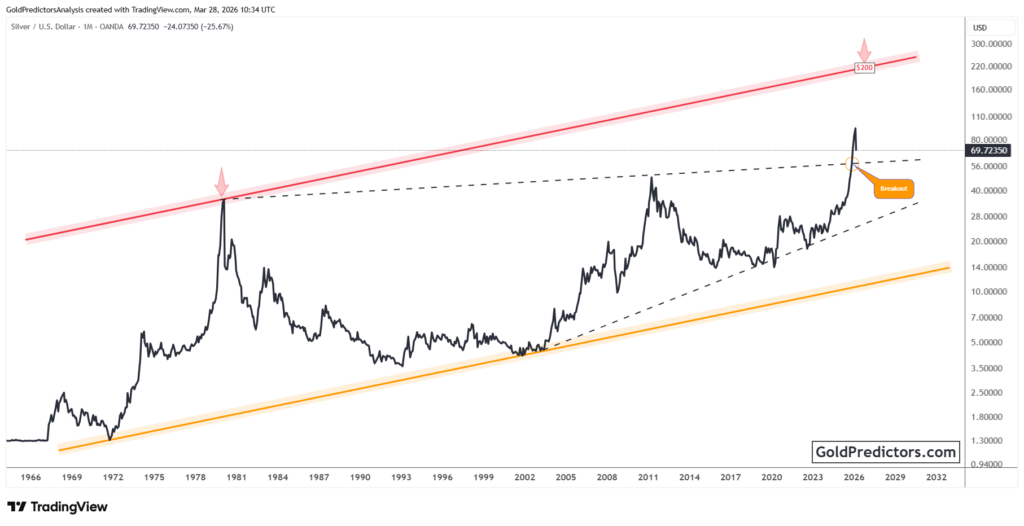
The chart below shows the silver-to-gold ratio, a key indicator of silver’s relative strength against gold. Since 2011, the ratio has trended lower, reflecting gold’s stronger relative performance over the past decade. However, recent price action signals a potential shift. The ratio has broken above its descending trendline after consistently holding a well-established support zone.
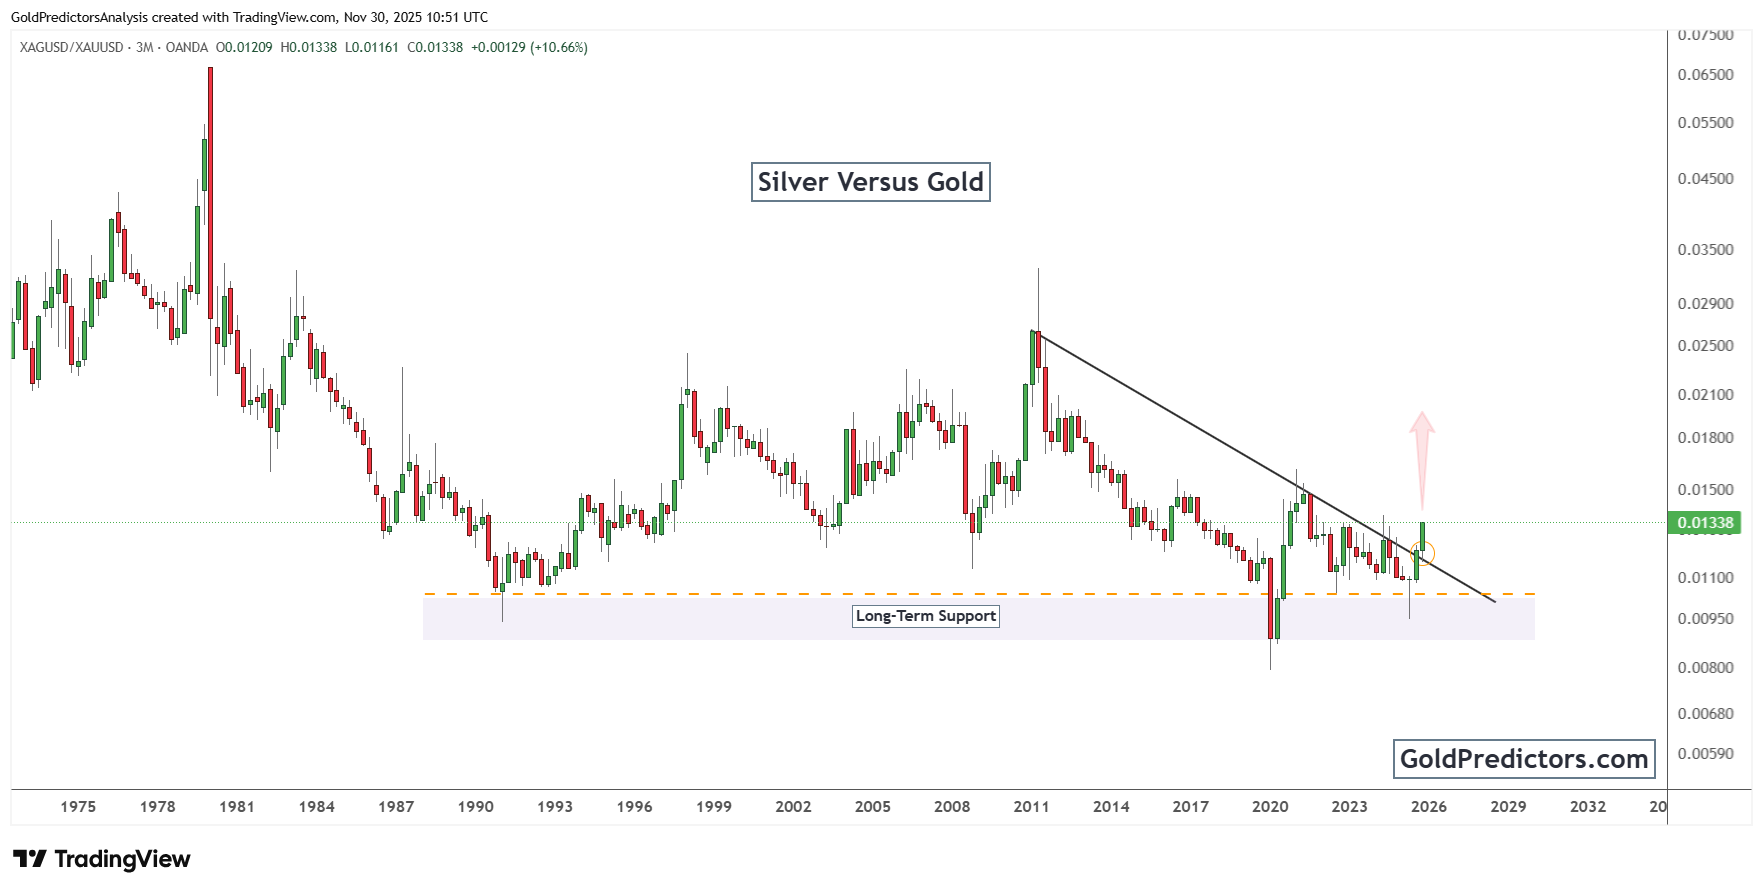
Historically, this support range has prevented deeper declines since the 1990s, triggering repeated recoveries. Each rebound from this area has aligned with phases of silver outperformance. The latest recovery, combined with the breakout above the downtrend line, signals a potential structural shift. If the ratio continues to rise, silver may remain stronger relative to gold.
Moreover, a slight upward indication near the breakout zone suggests building momentum and a potential shift in direction. This indicates that the ratio may be entering the early stages of a new upward trend, indicating a potential regime shift. Silver could begin to outperform gold in a more sustained manner, as seen during prior turning points. From a macroeconomic standpoint, the development reflects growing concerns about inflation and a shift into hard assets.
Conclusion: Silver Positioned for Breakout with Structural and Macro Tailwinds
Silver appears to be entering a decisive breakout phase after decades of consolidation beneath the $50 ceiling. The completion of a multi-decade cup and handle formation, along with the latest surge above the resistance level, marks a significant technical milestone. This move reflects not only renewed investor interest but also long-term structural strength building beneath a key resistance level.
At the same time, the breakout in the silver-to-gold ratio highlights silver’s growing momentum. The ratio has turned upward after holding a historical support zone and now signals a potential shift in relative strength. This development suggests that silver may not only rise in absolute terms. It could also begin to outperform gold, which is an important signal during periods of inflationary stress and shifting capital flows. A break above $50 in 2025 has increased the possibility of a strong surge in silver prices to $100 in the coming months.
Gold Predictors Premium Membership
Get exclusive short-term and swing trade ideas with precise entry levels, stop-loss, and target prices, including justification and analysis — all delivered directly via WhatsApp.
Our premium service includes deep technical analysis on gold and silver markets. We cover cycle analysis, price forecasting, and key timing levels.
Members also receive a weekly market letter with detailed analysis, commentary from our Chief Analyst, including actionable insights, trade timing, and direction forecasts for gold and silver.
Stay ahead of the market — join our premium community today.
