


Silver vs Copper: Will the Ratio Sustain Its Breakout?
Silver (XAGUSD) has moved into a new long-term phase after breaking above a multi-decade triangle that contained price action for nearly 45 years. The clear move through the $60 resistance marked the first confirmed breakout beyond a ceiling that capped advances in both 1980 and 2011. Price then rotated into higher ranges, signaling a shift from prolonged compression toward sustained price discovery. At the same time, silver has gained relative strength against copper, confirming a broader change in leadership across metals. The alignment between price structure and intermarket trends supports a shift toward higher long-term valuation.
Silver Exits Multi-Decade Compression with Historic Breakout
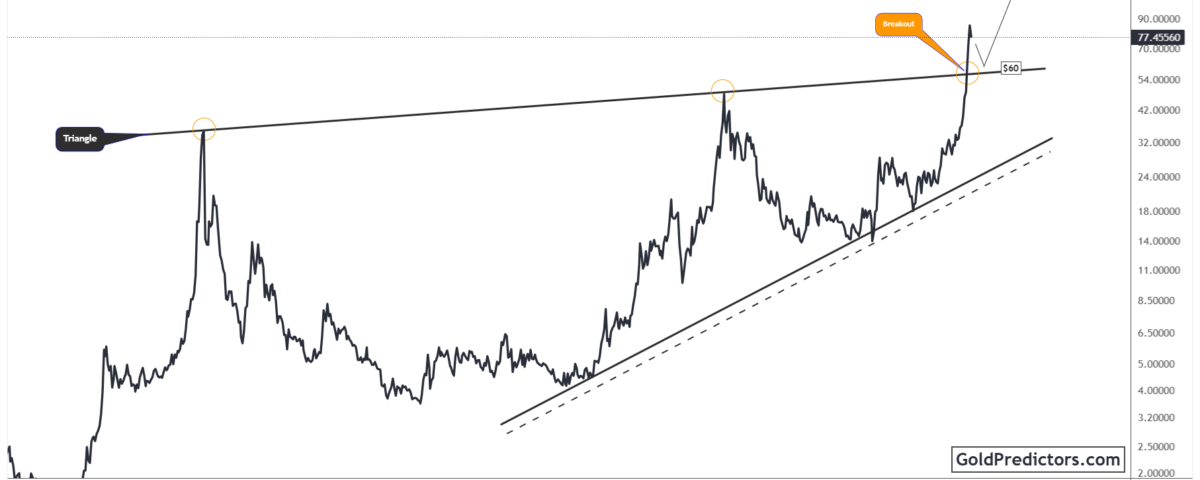
The silver chart below shows a massive triangle pattern that has developed over four decades. Since the early 1970s, silver has repeatedly stalled near the $50–$60 level, while forming higher lows along a rising trendline that began in the late 2000s. Previous rallies in 1980 and 2011 reached the $50–$60 resistance zone but failed to break through, establishing a long-term technical ceiling.
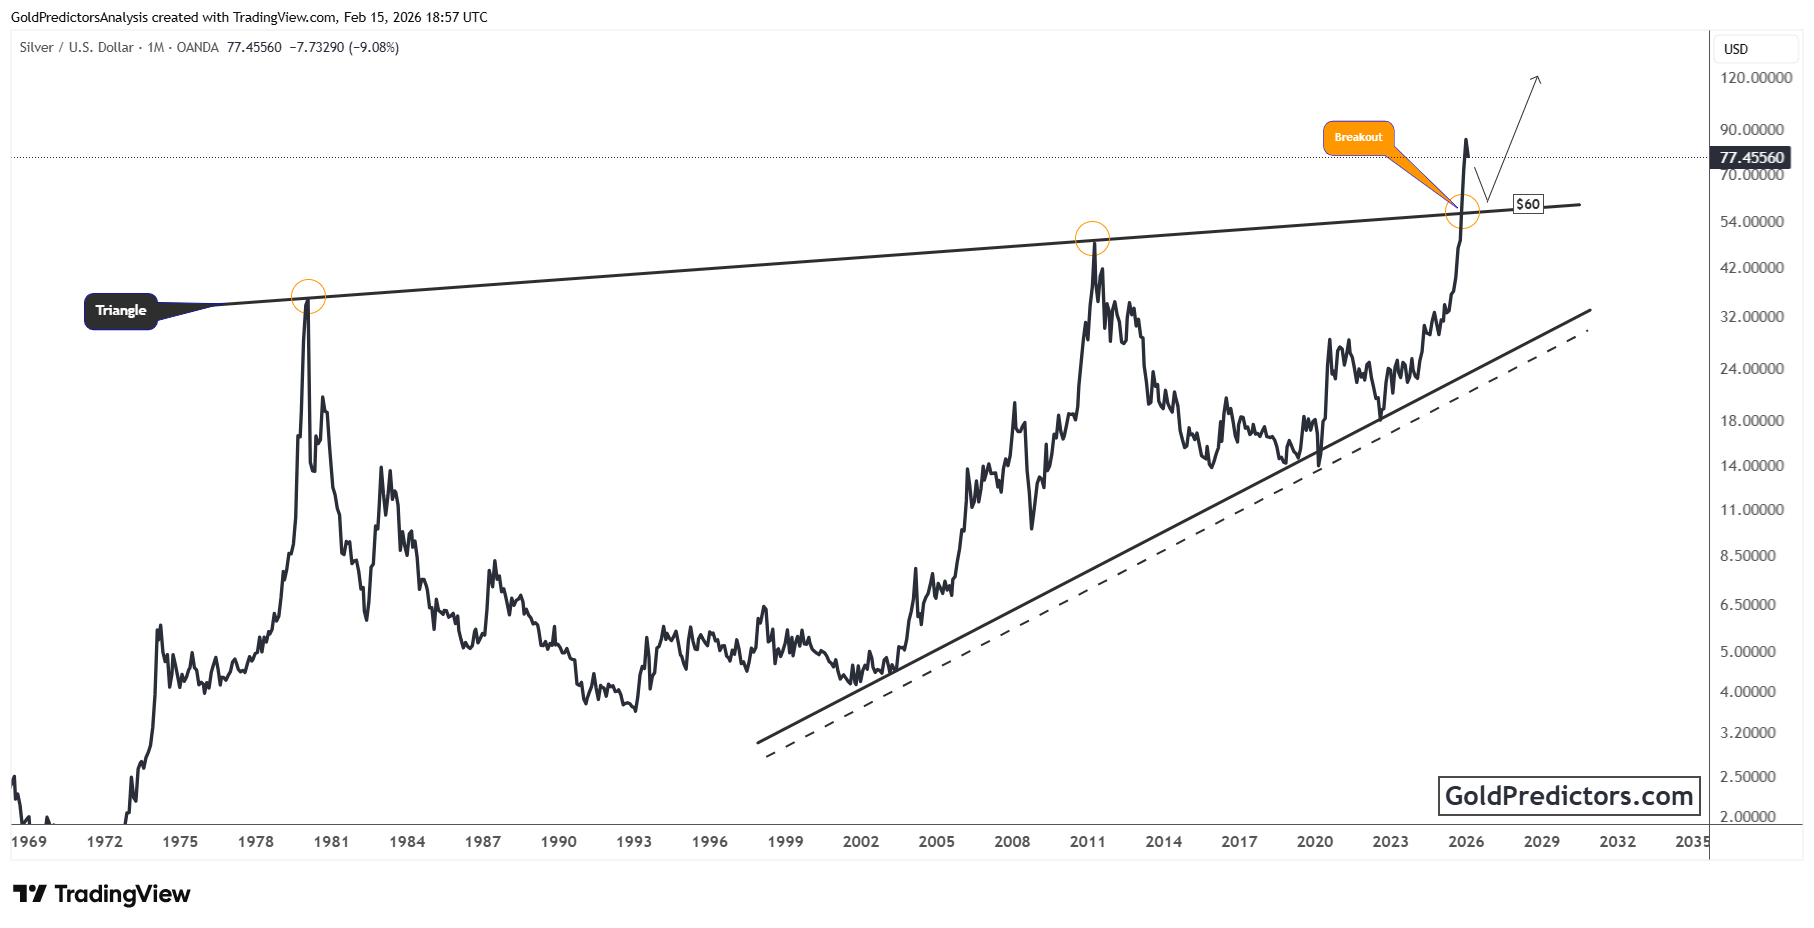
In late 2025, silver broke decisively above the long-standing resistance near $60. The price surged through the upper boundary of the triangle and advanced sharply toward the $120 zone before pulling back. This breakout marked the first confirmed move beyond the multi-decade structure and signaled the beginning of a new long-term trend. While the steep rally reflects strong momentum, it also raises the risk of a short-term pause or retracement.
The $60 level now acts as critical support. Holding above this zone keeps the bullish structure intact and opens the door for much higher long-term targets. The rising trendline from the early 2000s provides additional structural support for the uptrend. These support levels preserve the broader structure and keep silver positioned for continuation within a higher long-term range, with pullbacks likely along the way.
Silver Gains Relative Strength vs Copper after Triple-Cup Breakout
The chart below shows the long-term silver-to-copper ratio (XAG/XCU), a key macro indicator of silver’s strength relative to industrial metals. Between 2011 and 2025, price formed a distinct triple-cup base, with each rounded bottom stalling at a descending resistance band. This zone acted as a structural ceiling, repeatedly capping silver’s relative advances. The pattern reflected steady accumulation and tightening conditions beneath long-term resistance.
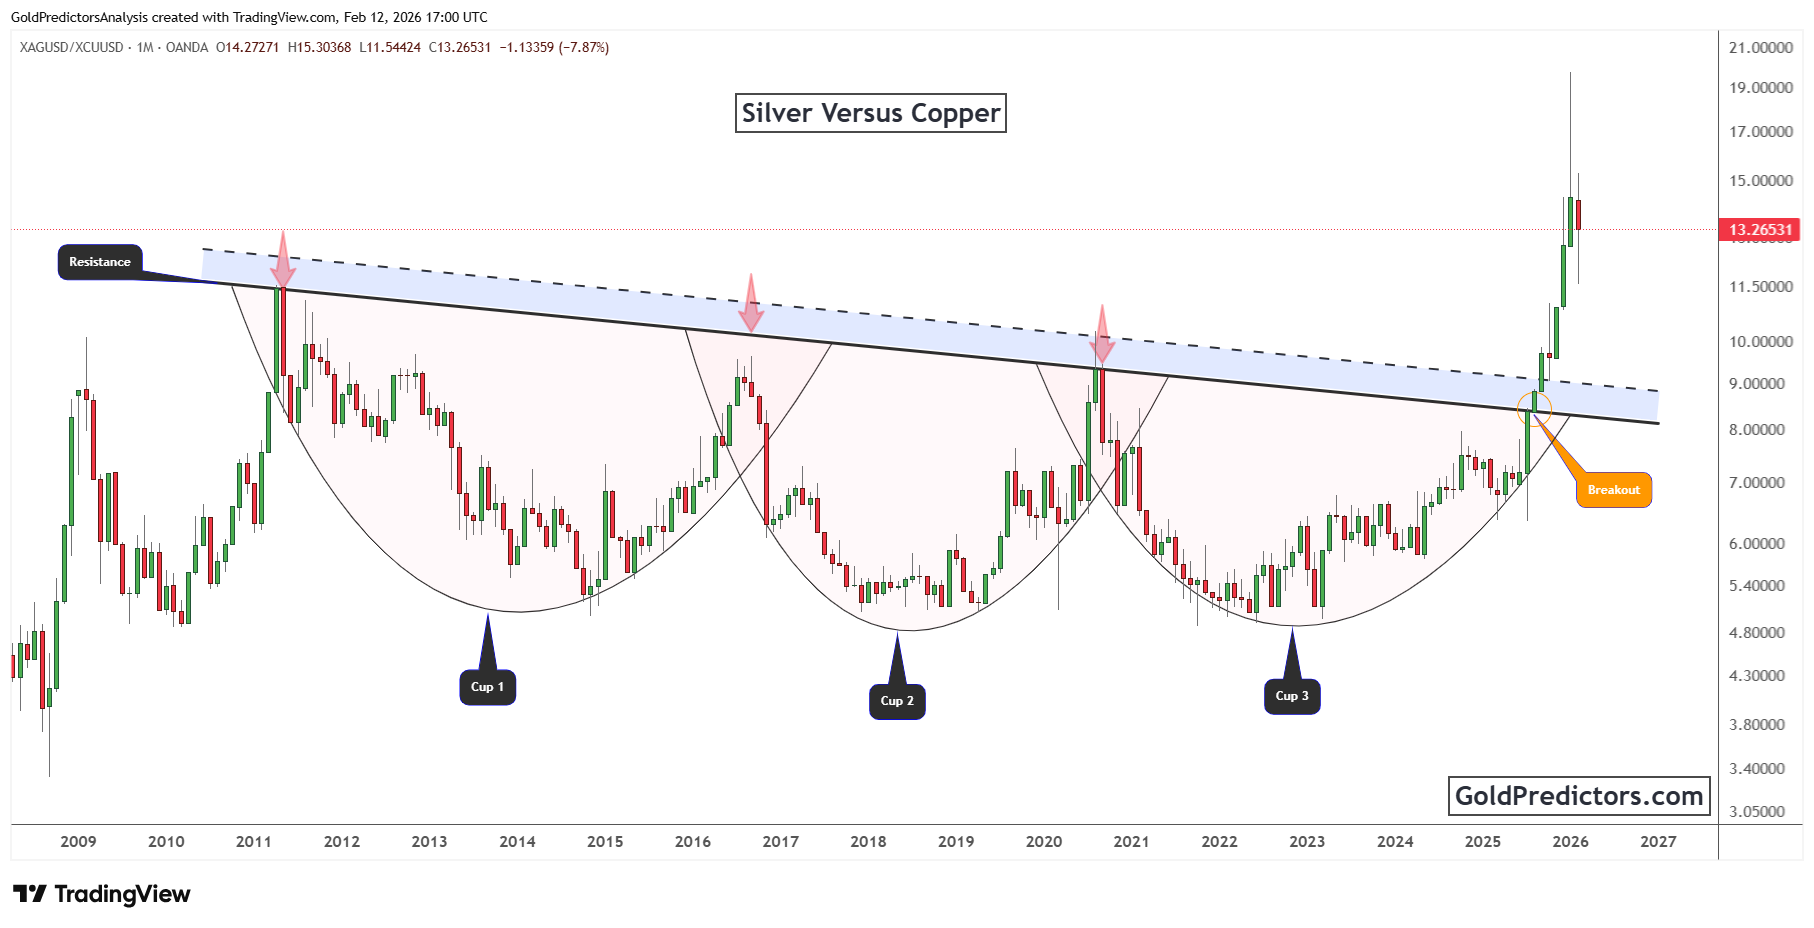
In early 2026, the ratio broke decisively above the long-standing resistance zone with strong vertical momentum. The breakout occurred near the 9.5 level and launched the ratio above 15 before pulling back. This breakout confirms a shift in leadership, with silver now outperforming copper on a structural basis. The formation also points to a broader rotation toward monetary assets over industrial commodities.
Notably, this breakout carries important technical and macro implications for silver’s relative strength. The triple cup breakout pattern is rare and typically leads to sustained outperformance. Holding above the breakout zone would confirm the trend reversal and help sustain bullish momentum. The move also aligns with broader macro tailwinds that favor hard monetary assets in inflation-sensitive environments. As long as the ratio remains above former resistance, silver is likely to extend its relative outperformance.
Silver Outlook: Breakout Levels Hold as Intermarket Trends Turn Supportive
Silver has completed a decisive breakout from a multi-decade triangle, marking a clear change in long-term price behavior. The move above the $60 level ended decades of compression and shifted the price into a higher range. While the initial advance was sharp, holding above former resistance keeps the broader setup favorable. This transition signals that the market has accepted higher valuation levels.
At the same time, silver has gained clear relative strength against copper. The breakout in the silver-to-copper ratio signals a shift toward monetary exposure and away from industrial demand. This change reflects evolving macro conditions that increasingly favor monetary assets. As long as the ratio holds above its breakout zone, silver continues to lead on a relative basis.
These signals point to a meaningful transition in silver’s long-term valuation. The alignment between price structure and intermarket signals points to rising preference for hard assets. As long as silver holds above key breakout levels, the outlook continues to favor higher valuation ranges over time. This alignment keeps silver well-positioned as the next phase of price discovery develops.
Gold Predictors Premium Membership
Get exclusive short-term and swing trade ideas with precise entry levels, stop-loss, and target prices, including justification and analysis — all delivered directly via WhatsApp.
Our premium service includes deep technical analysis on gold and silver markets. We cover cycle analysis, price forecasting, and key timing levels.
Members also receive a weekly market letter with detailed analysis, commentary from our Chief Analyst, including actionable insights, trade timing, and direction forecasts for gold and silver.
Stay ahead of the market — join our premium community today.


