


Silver Breaks $50 for First Time in Decades: Is a New Bull Cycle Underway?
Silver (XAGUSD) has broken the critical $50 level, a price point that has capped major rallies for over four decades. The recent surge has revived bullish momentum and brought renewed attention to a potential breakout that could reshape silver’s long-term trajectory.
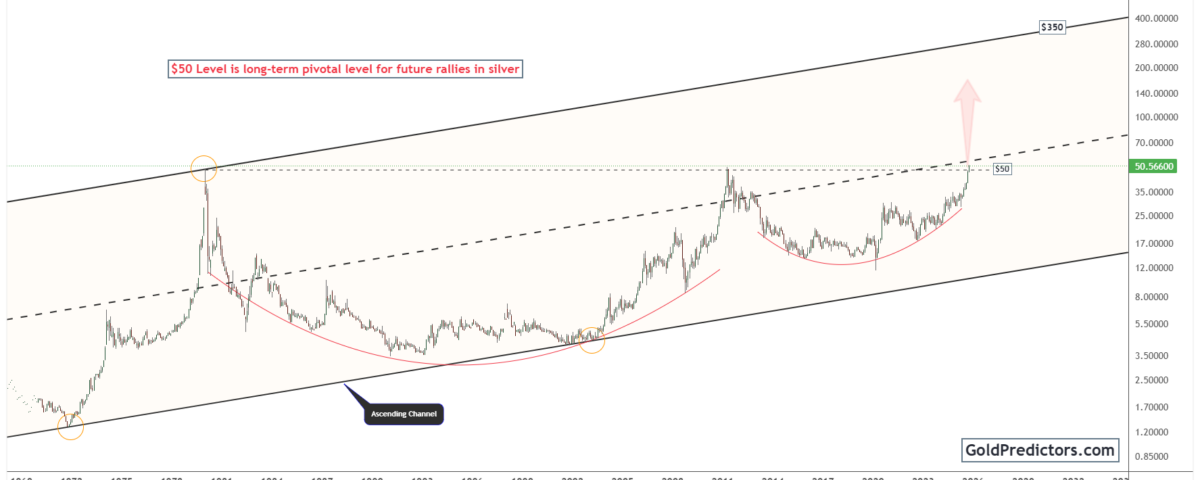
Silver Breaks $50 Pivot
The silver chart below shows a well-established long-term uptrend within a rising channel that spans from 1969 to 2025. This formation captures silver’s primary bull and bear cycles, framed within a structure that stretches across five decades. A key feature is the $50 level, reached during two historic peaks in 1980 and 2011. Both attempts resulted in sharp reversals, firmly establishing $50 as a critical multi-decade resistance zone.
Now, silver breaks this level with stronger structural patterns. The chart highlights two major cup-like formations: the first formed between the 1980s and early 2000s, and the second took shape from 2011 onward. These rounded bases indicate prolonged periods of buying interest and consolidation. The recent surge from the $20 range to the $50 level completes the right side of the second cup. This structure resembles a multi-decade cup-and-handle pattern, a well-known bullish continuation setup.
Silver’s breakout from the $50 level marks a pivotal moment in its long-term trend. Historically, this level has served as a ceiling for decades. Moreover, a decisive move above $50 not only confirms the bullish structural setup but also indicates the beginning of a new secular uptrend.
In terms of projections, the long-term ascending channel suggests the next primary target lies above $100. Longer-term projections indicate targets near $350, underscoring the potential scale of the upside once silver clears its historical ceiling.
How Silver Clears Critical $50 Threshold
The silver chart below shows a well-formed rising channel that began to develop after the 2020 low, indicating a clear upward trend. Within this structure, the price consistently made higher highs and higher lows, confirming the underlying strength of the move. Repeated rebounds along the lower boundary further validate the integrity of the channel. Throughout this period, silver remained constrained beneath key resistance levels. These included the 2011 peak and a series of intermediate resistance zones formed during previous rally attempts.
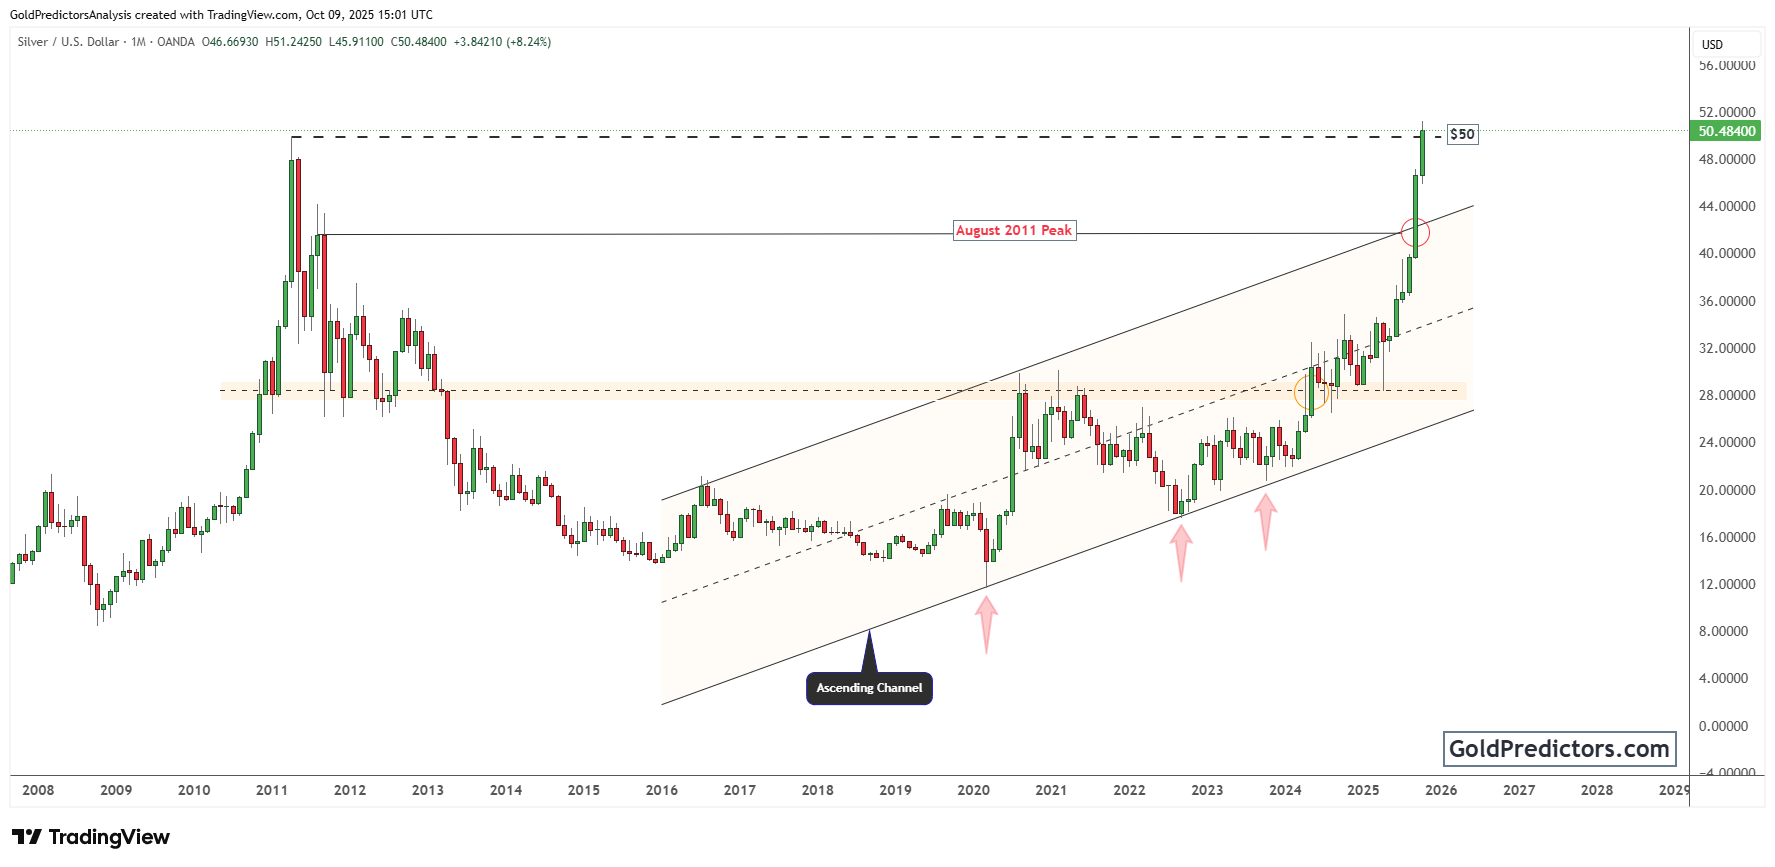
Notably, the breakout in 2025 marks a clear shift in silver’s technical landscape. The metal has surged above the upper boundary of its rising channel, breaking through resistance. This move follows a well-defined consolidation phase between $22 and $30, where strong demand consistently emerged on pullbacks. Key resistance zones within that range have since become support, further validating the strength and sustainability of the breakout.
Furthermore, the breakout marks the end of the decade-long bearish structure that emerged after the 2011 peak. By reclaiming that key zone, silver breaks from its historical pattern and enters a new phase of bullish price discovery. A monthly close above this level could attract institutional capital, drive ETF inflows, and reshape silver’s long-term market positioning.
Silver Outlook: Sustained Break Above $50 Could Unlock Explosive Upside
The $50 level has served as a hard ceiling for over four decades, halting major rallies in both 1980 and 2011. This time, silver has reached the barrier with a stronger technical foundation and well-formed bullish structures. Its breakout above the rising channel has added further strength, propelling the metal into this pivotal zone with strong upward momentum.
A monthly close above $50 would confirm the multi-decade cup-and-handle formation and signal the start of a new secular uptrend. The multi-decade channel points to initial targets above $100, while extended projections reach as high as $350.
Looking forward, silver’s next chapter depends on a monthly and quarterly close above the $50 barrier. A sustained move beyond this level would mark a pivotal shift in market structure. A strong technical base, sustained accumulation, and favorable macro shifts position silver for the next stage of price discovery.
Gold Predictors Premium Membership
Get exclusive short-term and swing trade ideas with precise entry levels, stop-loss, and target prices, including justification and analysis — all delivered directly via WhatsApp.
Our premium service includes deep technical analysis on gold and silver markets. We cover cycle analysis, price forecasting, and key timing levels.
Members also receive a weekly market letter with detailed analysis, commentary from our Chief Analyst, including actionable insights, trade timing, and direction forecasts for gold and silver.
Stay ahead of the market — join our premium community today.


