


Silver Price Breakout: $50 Target in Sight as Inflation and Fed Pivot Boost Rally
Silver (XAGUSD) is showing strong bullish momentum after breaking out of a multi-year consolidation range. The price now trades near $40, its highest level since 2011. This breakout reflects both technical strength and supportive macroeconomic trends. Specifically, rising inflation, a weakening U.S. Dollar, and expectations of Fed rate cuts are pushing demand higher. In addition, geopolitical uncertainty continues to drive demand for safe-haven assets. The technical setup and Silver/Gold ratio now signal further gains, positioning $50 as the next primary target.
Silver Surges Above $40 After Multi-Year Breakout
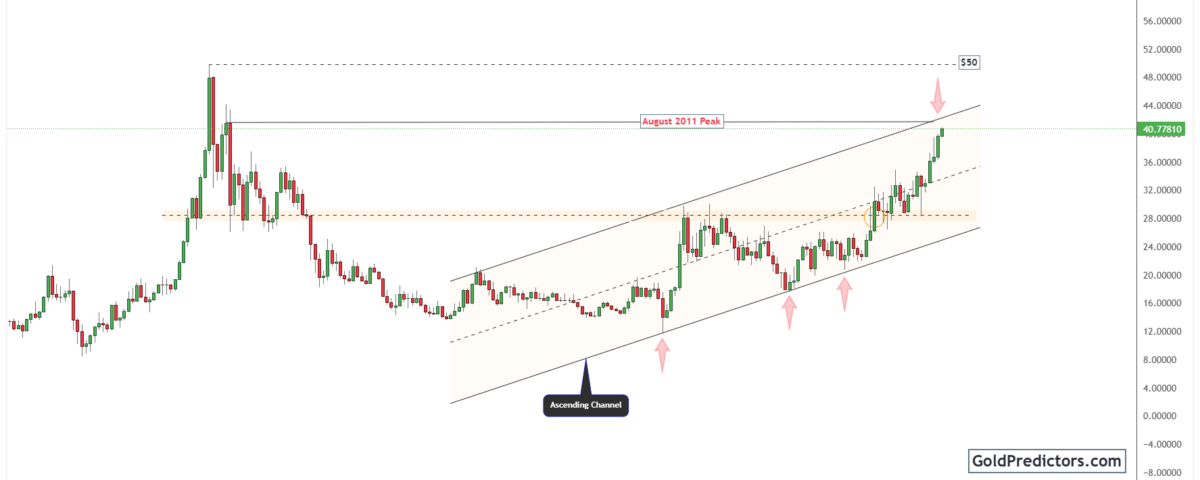
The silver chart below shows that the price has broken above a well-established horizontal resistance near the $30 level on the monthly timeframe. Previously, this level had capped gains since 2020, resulting in a prolonged period of consolidation. However, with the breakout now confirmed and momentum accelerating, silver has surged to around $40.77. Consequently, this marks the highest monthly close since 2011 and sets the stage for a potential test of the August 2011 peak near $50.
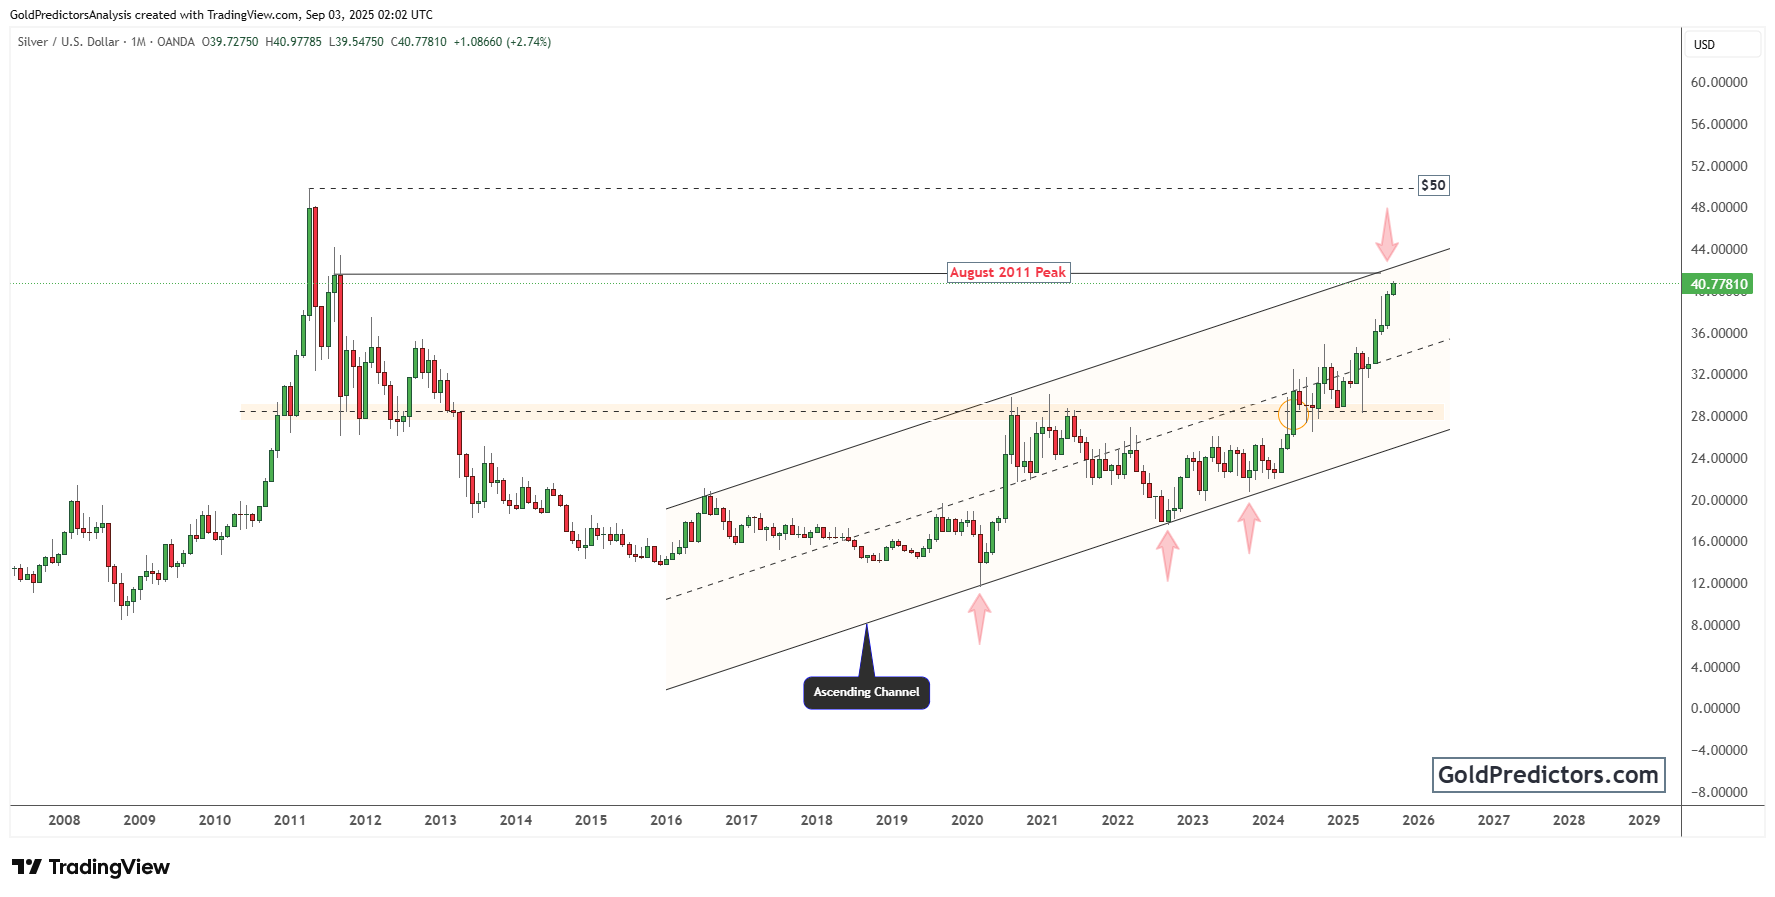
The chart further highlights an ascending channel that has shaped silver’s price trajectory since the 2015 low. Notably, several successful retests of the lower boundary, marked by red arrows, reinforce the strength of this pattern. Each pullback to the lower trendline resulted in strong rebounds, thereby strengthening the long-term bullish pattern. At present, the price has reached the upper half of the channel, suggesting that the next resistance lies between $45 and $47. If this zone is cleared, silver could make a direct run toward the psychological and historical resistance of $50.
The breakout is not only technical but is also supported by macro drivers. Specifically, rising inflation risks and a declining U.S. Dollar have driven renewed institutional demand for precious metals. Furthermore, the Federal Reserve’s expected policy shift toward rate cuts is adding fuel to the rally. Meanwhile, ongoing geopolitical instability continues to drive demand for safe havens.
Silver/Gold Ratio Near Historic Support Signals Upside Shift
The chart below shows the Silver/Gold ratio, reflecting silver’s historical performance in relation to gold. The ratio remains close to 0.0115, a level that has frequently marked key turning points where silver begins to outperform gold. More importantly, the ratio remains near multi-decade support while still trading below a descending trendline that has capped upward moves since the 1980s.

The chart reveals key historical rejection points from 1968, 1980, and 2011 when silver significantly outpaced gold and became overextended. Although the ratio has been under pressure since that time, it is now testing the lower boundary of its historical range. However, a breakout above the descending trendline would signal a significant shift in favor of silver. It may signal the beginning of a long-term phase where silver gains relative strength against gold.
The current setup highlights a notable divergence, with gold holding steady while silver remains undervalued by comparison. In particular, an upward shift in the ratio would confirm that silver is finally gaining ground relative to gold. Furthermore, the confirmed breakout in silver will strengthen the credibility of the ratio analysis and the broader bullish view.
Bullish Outlook for Silver Strengthened by Fed Pivot and Inflation Risks
Silver’s approach toward the $40 level marks a significant turning point in its technical structure. The monthly close near this key threshold confirms strong bullish momentum. As a result, key resistance levels between $45 and $50 now come into focus. If silver breaks through this zone, it could open the door for a strong historical surge. Overall, the ascending channel remains intact, offering a clear roadmap for future gains.
At the same time, macroeconomic conditions support further upside. Inflation risks are rising, and the U.S. Dollar remains under pressure. In addition, the Federal Reserve’s expected rate cuts could accelerate safe-haven flows into silver. Furthermore, ongoing geopolitical uncertainty continues to fuel demand for hard assets. Together, these drivers align with the technical setup to strengthen the overall bullish outlook.
The Silver/Gold ratio provides additional support for the bullish case in silver. Currently, the ratio is hovering near historical backing and could be forming a bottom. Moreover, a breakout above the descending trendline would signal silver’s return to relative strength. Since silver is already leading on its own chart, the ratio analysis further reinforces the potential for sustained outperformance. These signals suggest that silver may be entering a powerful, long-term bull phase.
Gold Predictors Premium Membership
Get exclusive short-term and swing trade ideas with precise entry levels, stop-loss, and target prices, including justification and analysis — all delivered directly via WhatsApp.
Our premium service includes deep technical analysis on gold and silver markets. We cover cycle analysis, price forecasting, and key timing levels.
Members also receive a weekly market letter with detailed analysis, commentary from our Chief Analyst, including actionable insights, trade timing, and direction forecasts for gold and silver.
Stay ahead of the market — join our premium community today.


