


Silver Price Analysis: Breakout Above Multi-Decade Resistance Signals Major Upside
Silver (XAGUSD) is showing signs of a major structural shift after years of consolidation within long-term technical formation. The metal has recently broken above a major resistance level that had capped advances for decades, highlighting strengthening long-term momentum. At the same time, relative performance indicators suggest that silver is gaining strength against Bitcoin, signaling a possible shift in leadership toward the metal. These signals point to improving long-term conditions that could support a stronger advance in silver. However, short-term pullbacks or consolidation phases may still occur as the market stabilizes after the breakout.
Silver Breaks Multi-Decade Resistance within Long-Term Rising Channel
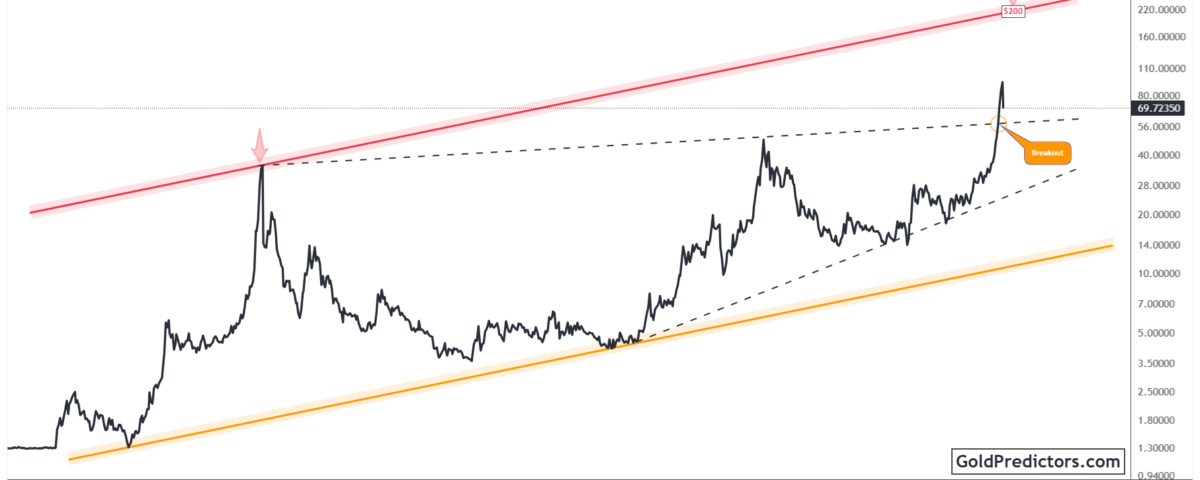
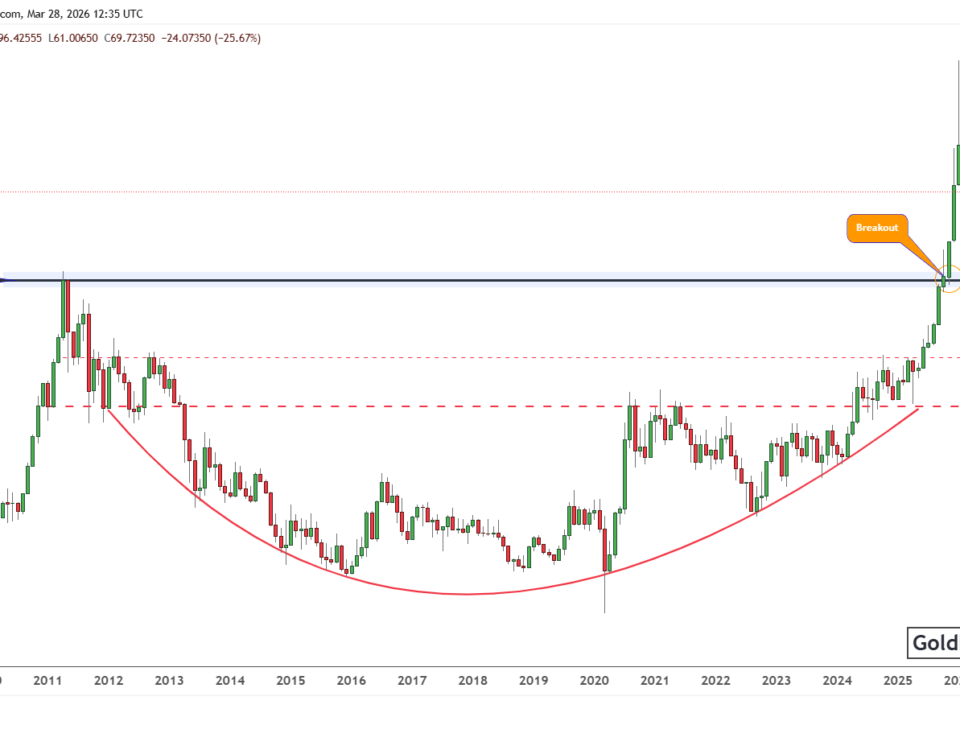
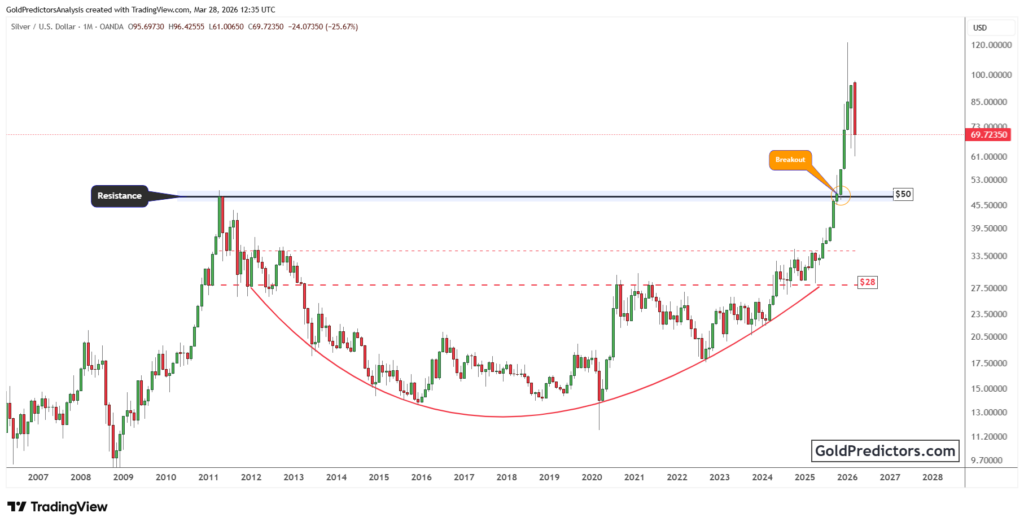
The silver chart below shows price trading within a well-defined ascending channel that has guided price movement for decades. The lower boundary of this structure began forming in the early 1970s and has continued to act as a major long-term support. During each major correction, price eventually stabilized near this trend line before a new advance developed. This consistent interaction with the lower boundary shows that silver has maintained a structurally upward long-term trend.
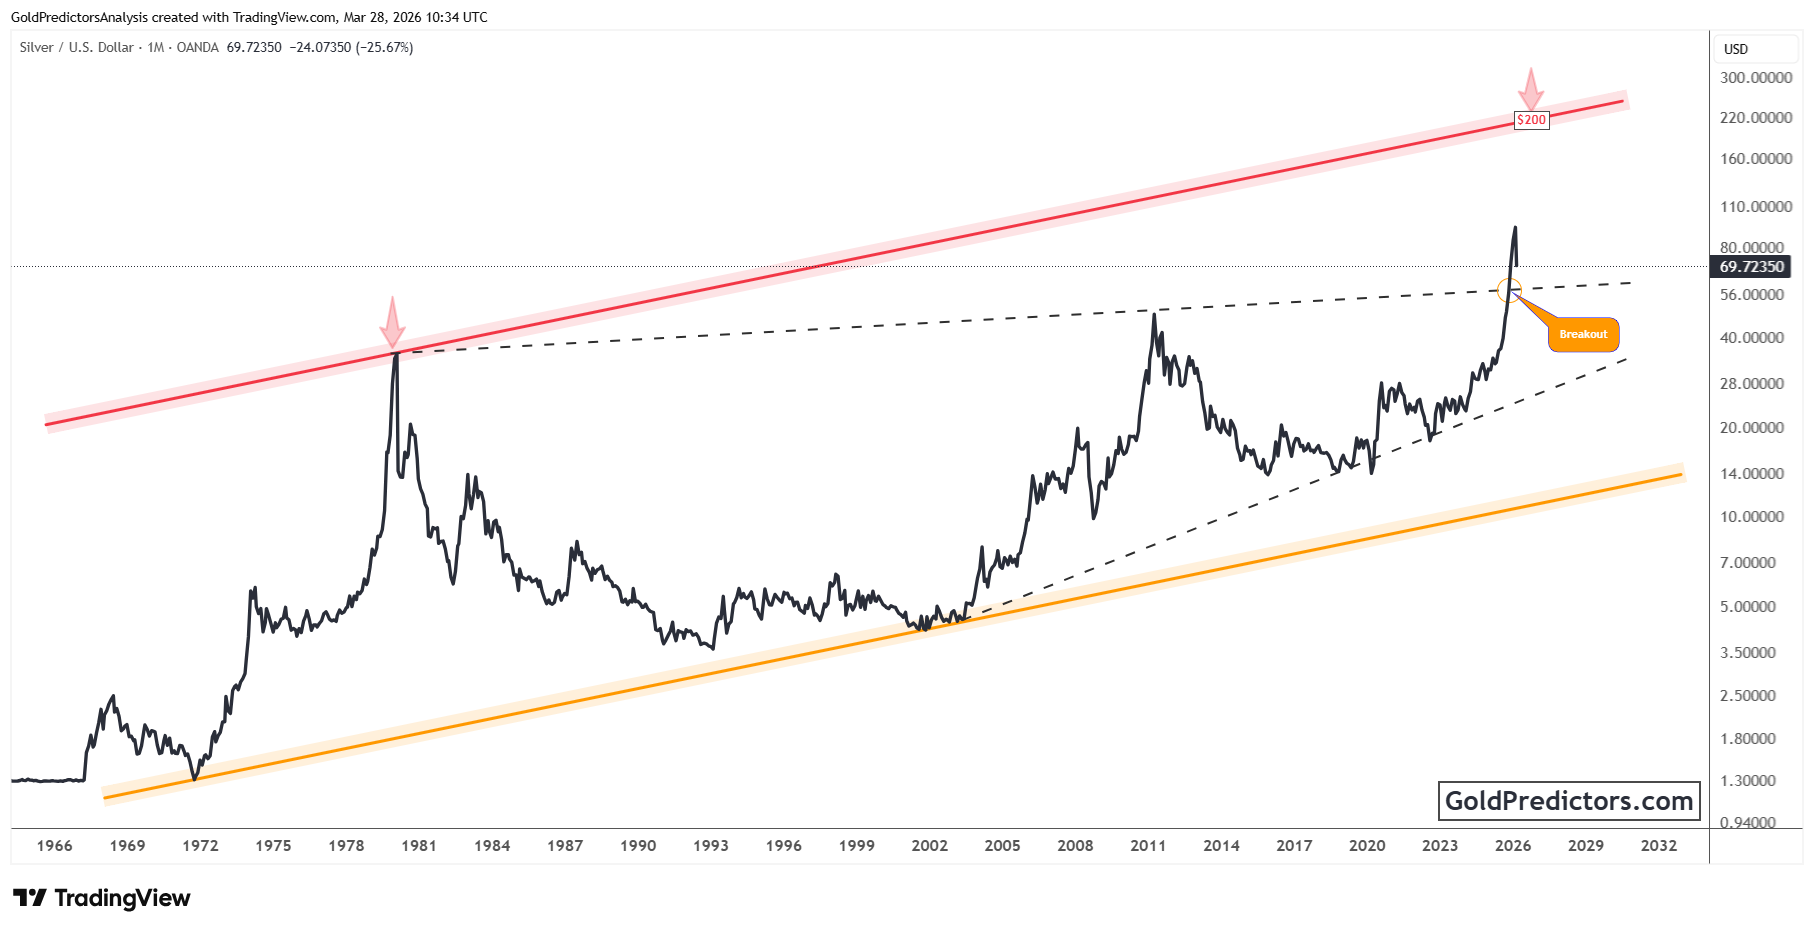
Meanwhile, the upper boundary of the channel has historically acted as strong resistance. Silver approached this level during the powerful rally in 1980, when price accelerated sharply toward the top of the structure. However, the advance stalled after reaching the upper trend line, triggering a swift reversal. That peak marked a historic high for silver and began a long consolidation phase that lasted many years. The rejection from the upper boundary confirmed the importance of this long-term resistance level.
Recent price action shows silver breaking decisively above a major resistance line that had limited advances for several decades. This breakout marks a clear shift in the long-term structure and indicates that the market may be entering a new phase of expansion. The recent pullback reflects a natural reaction after the breakout, as price adjusts around former resistance. As silver continues to move within the broader structure, the upper boundary becomes an important reference point for long-term projections. If this structure holds, silver could gradually progress toward substantially higher levels over time.
Silver-to-Bitcoin Ratio Breaks Long-Term Downtrend After Years of Consolidation
The chart below shows the silver versus Bitcoin ratio moving within a prolonged downtrend that began after the major peak in 2015. A descending resistance line guided the decline for several years. Each rally approached this trend line and reversed before breaking above it. This repeated rejection confirmed persistent relative weakness in silver compared with Bitcoin during that period.
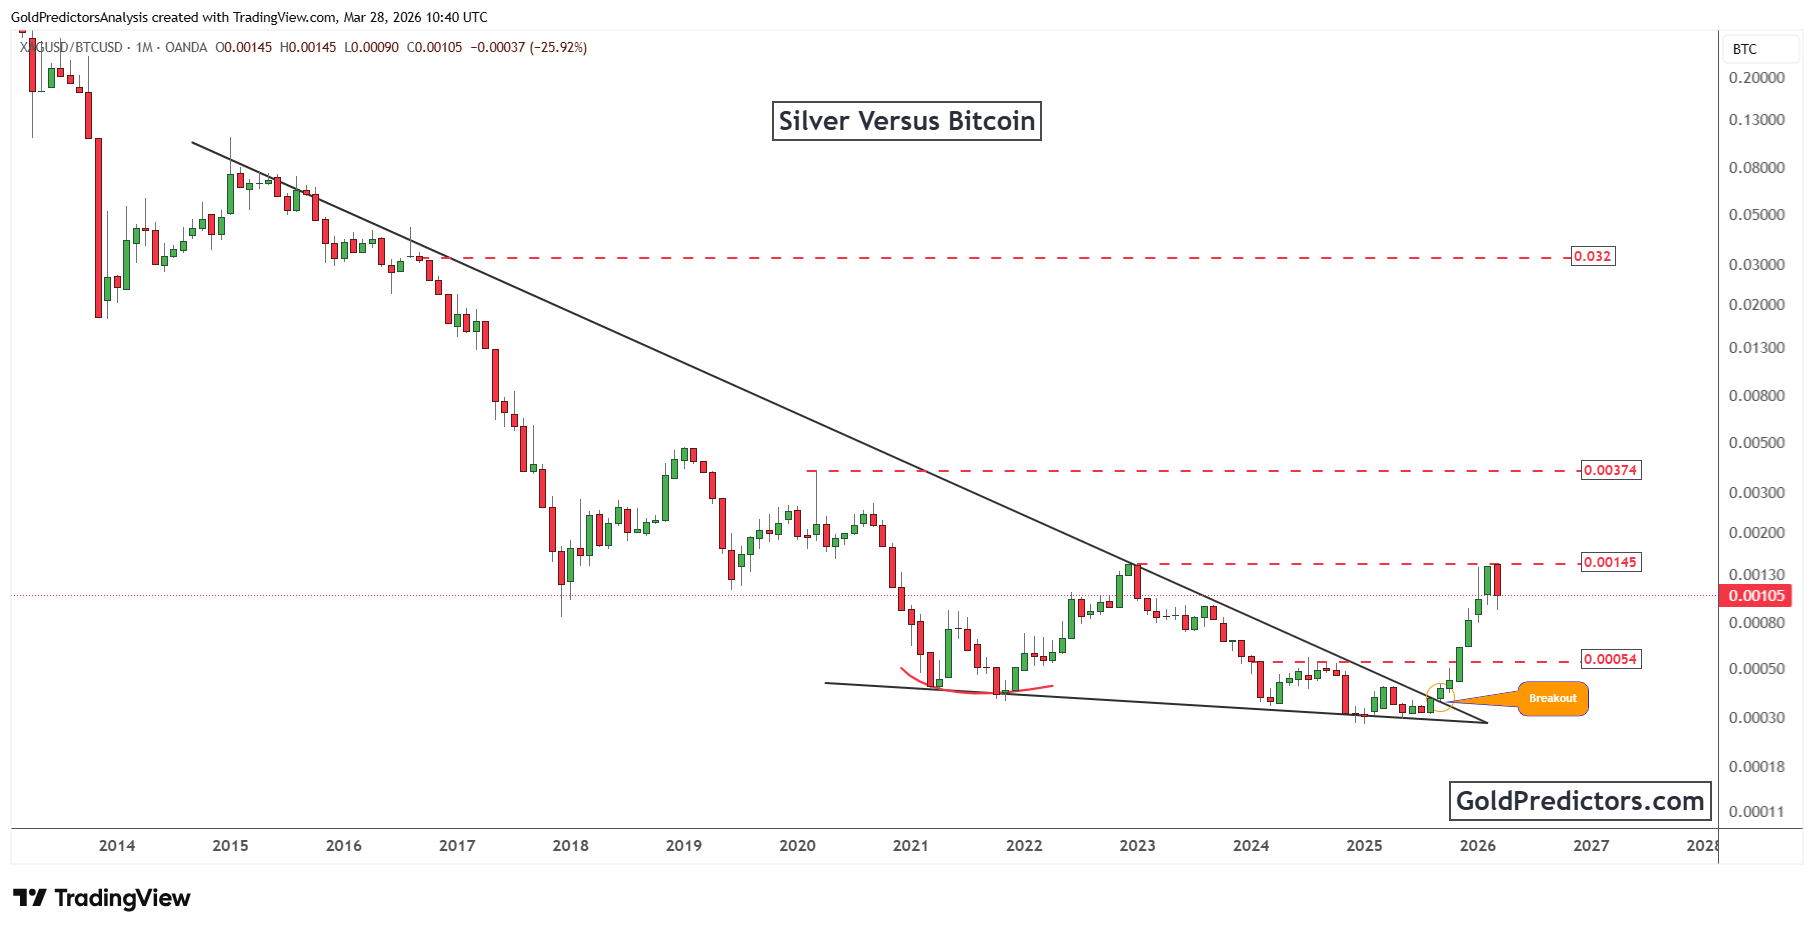
At the same time, price gradually formed a broad base near the lower boundary of the structure between 2021 and 2025. The ratio stabilized after several sharp declines and moved into a period of consolidation near a flat support level. This behavior indicated that downside pressure was easing. As price compressed between the support area and the descending resistance line, a wedge formation emerged, a structure that often precedes a decisive directional move.
Recently, the ratio broke above the descending trend line, signaling a potential shift in relative strength. The breakout indicates that silver may begin outperforming Bitcoin after a long period of underperformance. Price advanced toward the resistance zone near 0.00145 before pulling back, reflecting a natural reaction after the breakout. If the structure holds, this move still opens the path toward higher resistance zones over the longer term.
Conclusion: Silver’s Structural Breakout Signals Potential Long-Term Expansion
Silver is entering a new phase after years of consolidation within major long-term structure. The breakout above multi-decade resistance within the rising channel signals a clear shift in the broader technical structure. The price has moved beyond levels that had capped advances for many years, indicating growing acceptance of higher valuations. This shift suggests that silver could be entering a new stage of expansion within the broader uptrend. Short-term pullbacks or pauses remain possible after the recent breakout.
At the same time, the breakout in the silver-to-Bitcoin ratio highlights improving relative strength for silver. The ratio had remained under pressure for several years, but the recent move above descending resistance suggests that this period of underperformance may be changing. The base formation and wedge compression created conditions for a directional move. This development points to the possibility that silver could begin outperforming Bitcoin after a long consolidation phase.
These developments point to improving long-term conditions for silver. The sustained channel structure supports the broader uptrend, while the ratio breakout signals strengthening relative demand. The recent pullback reflects a natural adjustment following the breakout, as price stabilizes at higher levels. The current structure suggests that silver may continue advancing if momentum holds.
Gold Predictors Premium Membership
Get exclusive short-term and swing trade ideas with precise entry levels, stop-loss, and target prices, including justification and analysis — all delivered directly via WhatsApp.
Our premium service includes deep technical analysis on gold and silver markets. We cover cycle analysis, price forecasting, and key timing levels.
Members also receive a weekly market letter with detailed analysis, commentary from our Chief Analyst, including actionable insights, trade timing, and direction forecasts for gold and silver.
Stay ahead of the market — join our premium community today.
