


Silver Breaks Out From Multi-Decade Compression as Silver-to-Miners Ratio Turns Higher
Silver (XAGUSD) has entered a new structural phase after breaking out from a long-term triangle. Price cleared the $50 resistance with strong momentum, ending decades of compression. This move followed years of accumulation and repeated consolidation patterns, with any short-term pullbacks likely unfolding within the broader structure. At the same time, the silver-to-miners ratio has turned higher from long-term support, pointing to silver’s leadership within the space. This alignment suggests silver is transitioning from prolonged compression into a new phase of long-term repricing.
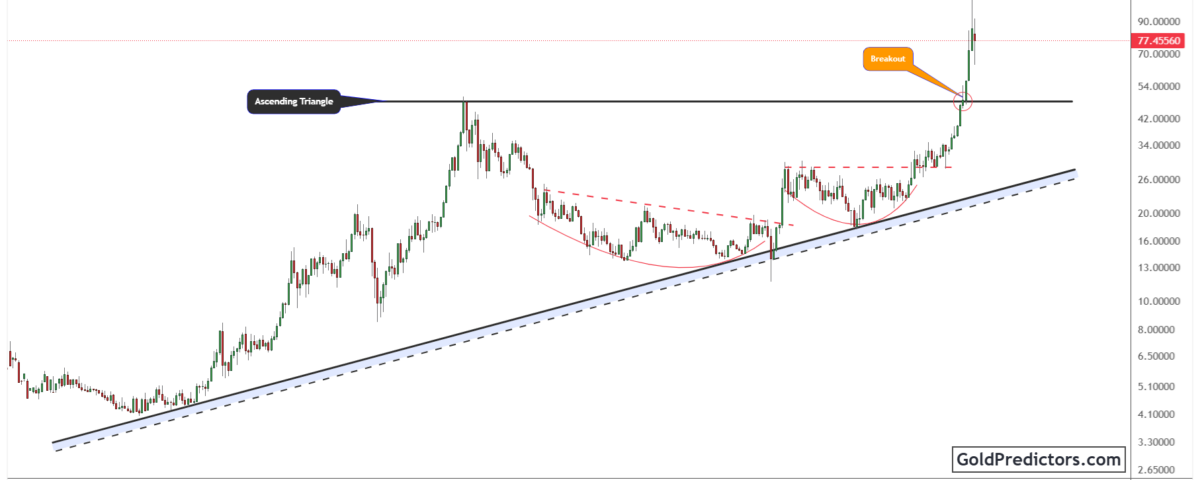
Silver Breaks Above $50 after Multi-Decade Triangle Compression
The silver chart below shows a breakout from a long-term ascending triangle. This structure developed over several decades, with horizontal resistance near the $50 level and a rising trendline connecting higher lows. Each rally stalled near the same upper boundary, as rising support continued to narrow the range over time. The formation reflected persistent accumulation and prolonged price compression across cycles.
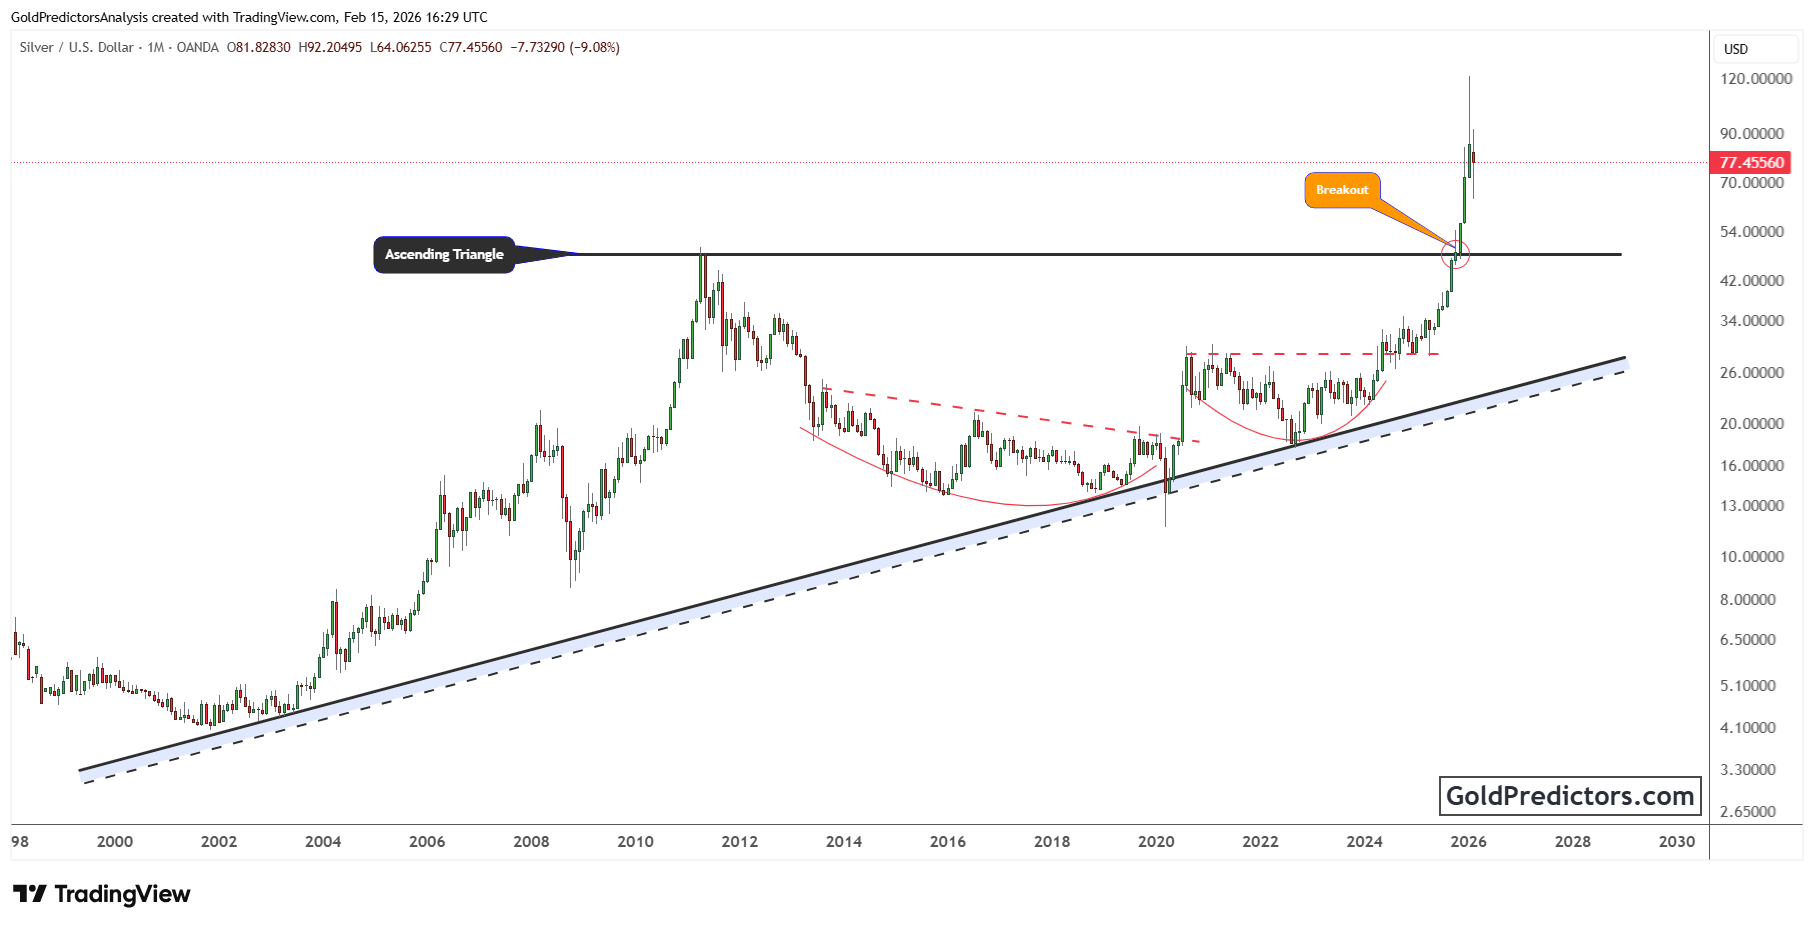
In late 2025, silver surged through the $50 ceiling, confirming the breakout with strong momentum. The move followed a series of cup-shaped consolidations that added technical strength to the broader setup. Strong volume and accelerating momentum propelled the price toward the $120 region before a sharp reversal emerged.
The breakout zone near $50 now acts as a key support level. Despite the recent reversal, the broader pattern remains intact, with the long-term trend still biased to the upside. A successful retest of the breakout level would strengthen the bullish outlook and open the door to continued gains. If upward momentum resumes, silver could target fresh highs beyond the $120 mark.
Silver-to-Miners Ratio Rebounds From Long-Term Support Zone
The chart below shows the silver-to-miners ratio (XAGUSD/SIL), capturing how physical silver is performing relative to mining equities. A series of rounded tops is visible, with each cyclical peak followed by a pullback toward a long-standing support line that has held since 2016. The most recent recovery from this base suggests the ratio may be starting a new upward leg.
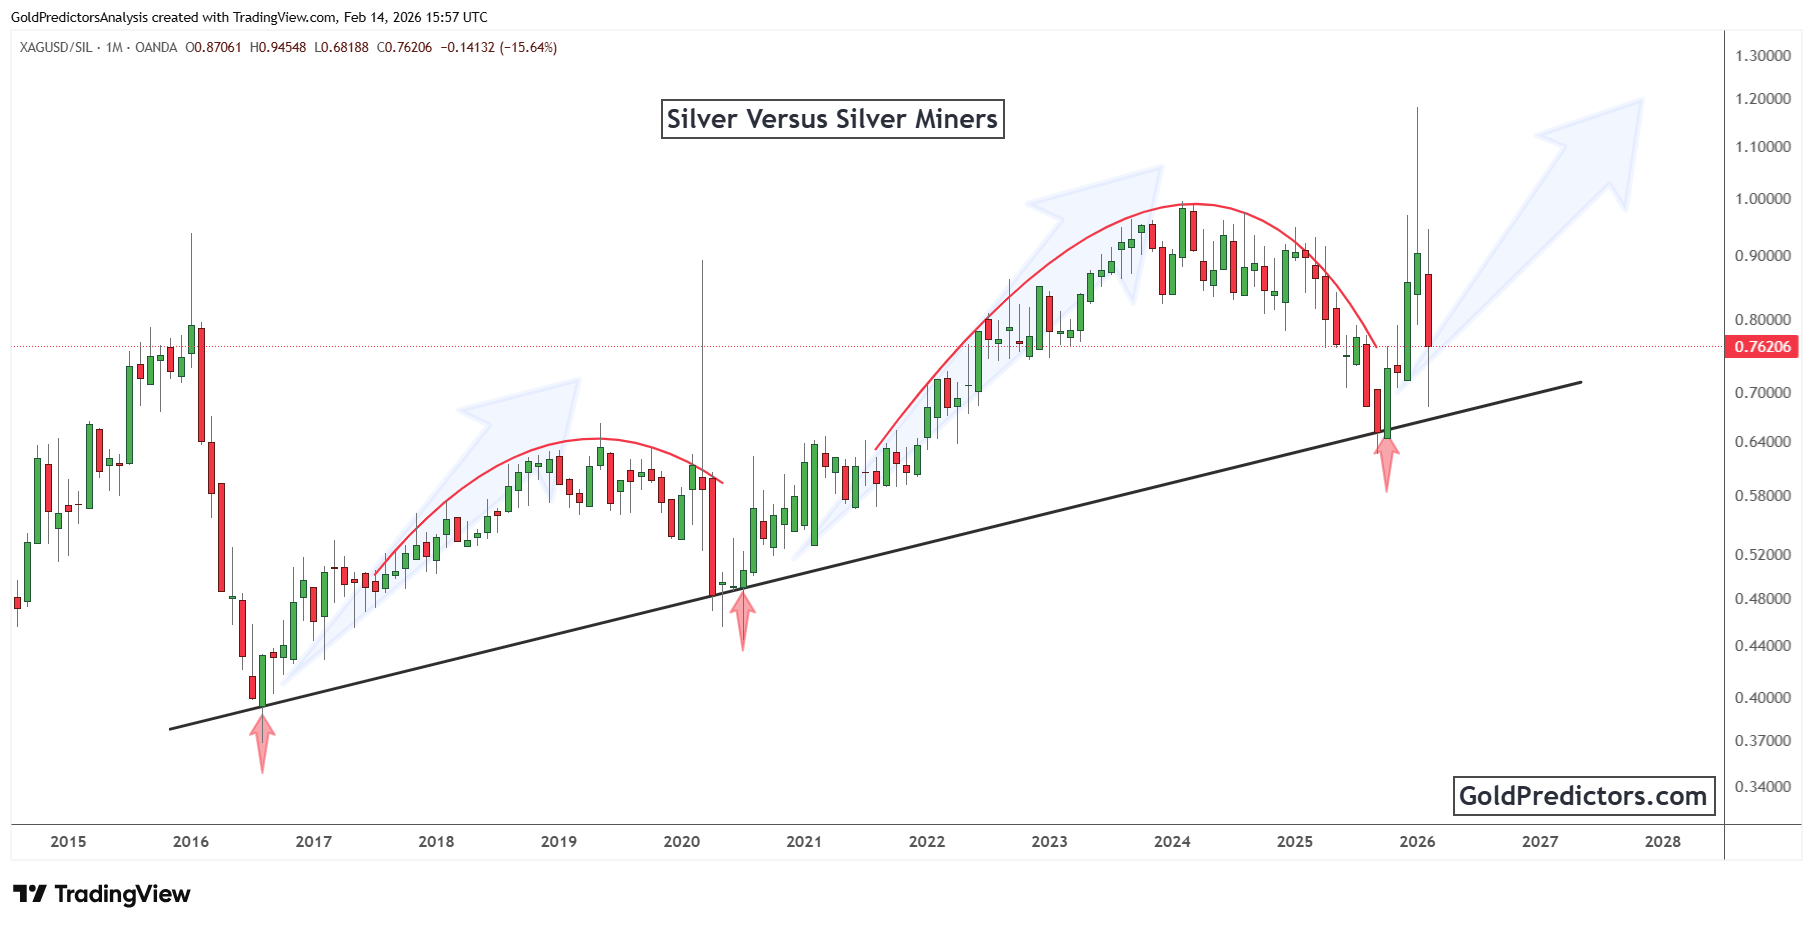
In early 2026, the ratio completed another corrective move, stabilizing after touching this key trendline for the third time. That move coincided with renewed strength in silver prices, pointing to outperformance of the metal over miners. Historically, each interaction with this support zone has triggered a fresh advance in favor of silver, and the current setup appears to follow that pattern.
Although silver has led the recent rally, miners may begin to catch up if the metal consolidates or levels off. As long as silver holds above critical breakout zones, it maintains its position as the primary driver in the space. This setup points to a potential rotation, where miners start closing the gap as silver stabilizes. A sustained pause in silver’s advance could allow mining stocks to improve relative performance in the near term.
Silver Outlook: Breakout Structure and Ratio Strength Favor Higher Levels
Silver’s breakout from its long-term triangle marks a decisive shift in the broader trend. The move above long-standing resistance ended a prolonged consolidation and triggered strong upside momentum. Price is now holding above prior resistance, reflecting broad acceptance of higher levels. As long as silver remains above key breakout levels, the broader setup continues to favor sustained upside.
At the same time, the silver-to-miners ratio has rebounded from long-term trendline support, highlighting silver’s leadership within the space. The ratio has repeatedly turned higher from this zone in past cycles, and the current recovery aligns with silver’s sharp price advance. This behavior suggests capital is favoring physical silver over mining equities at this stage of the cycle. Unless the ratio breaks lower, silver is likely to maintain its relative edge in the near term.
These signals suggest that silver is entering a new phase of long-term repricing. The alignment between price structure and intermarket trends points to growing preference for hard assets. As long as silver holds above its former breakout zone near $50, the outlook continues to favor higher valuation levels over time. This setup keeps silver well-positioned as the next phase of price discovery develops.
Gold Predictors Premium Membership
Get exclusive short-term and swing trade ideas with precise entry levels, stop-loss, and target prices, including justification and analysis — all delivered directly via WhatsApp.
Our premium service includes deep technical analysis on gold and silver markets. We cover cycle analysis, price forecasting, and key timing levels.
Members also receive a weekly market letter with detailed analysis, commentary from our Chief Analyst, including actionable insights, trade timing, and direction forecasts for gold and silver.
Stay ahead of the market — join our premium community today.


