


Gold’s Structural Breakout Coincides with Sharp Breakdown in Bitcoin-to-Gold Ratio
Gold (XAUUSD) has completed a multi-decade cup-and-handle formation and confirmed a major breakout above long-term resistance. After decades of consolidation and repeated resistance tests, the metal surged past long-standing technical barriers.
Although price has pulled back slightly from recent highs, the breakout remains intact. Strong volume and sustained institutional interest continue to support the trend. Meanwhile, the Bitcoin-to-Gold ratio has broken key support, signalling a shift in relative performance. These developments underscore the increasing capital flows into traditional safe-haven assets, thereby strengthening gold’s long-term bullish outlook.
Gold Confirms Structural Breakout from Generational Cup-and-Handle Formation
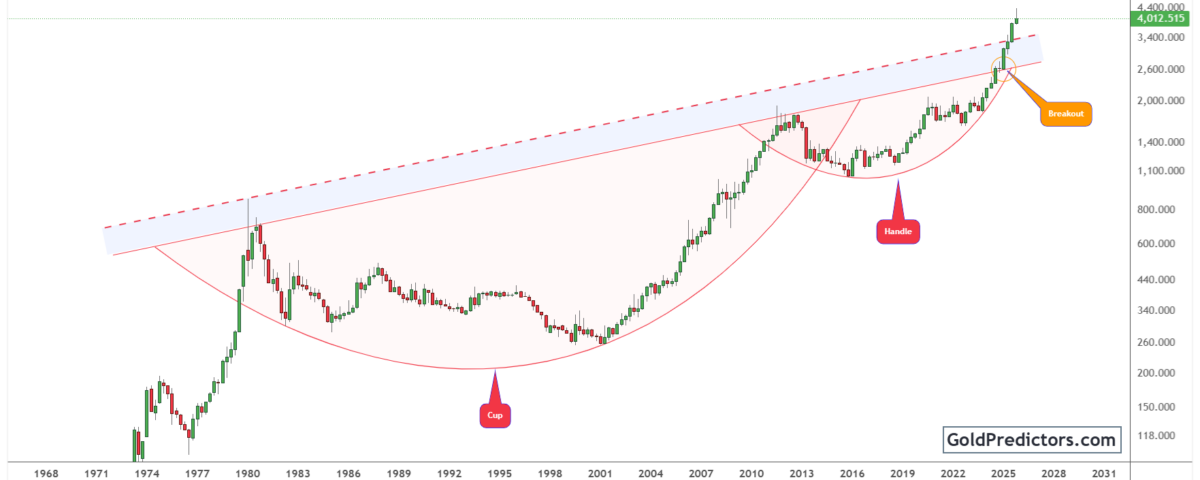
The gold chart below displays a massive cup-and-handle formation that has evolved over several decades. The cup begins at the 1980 peak and extends through a prolonged phase of consolidation. The handle developed between 2011 and 2024 through a slow pullback and years of horizontal price action. This extended setup reflects sustained base-building, laying the groundwork for a major bullish breakout.
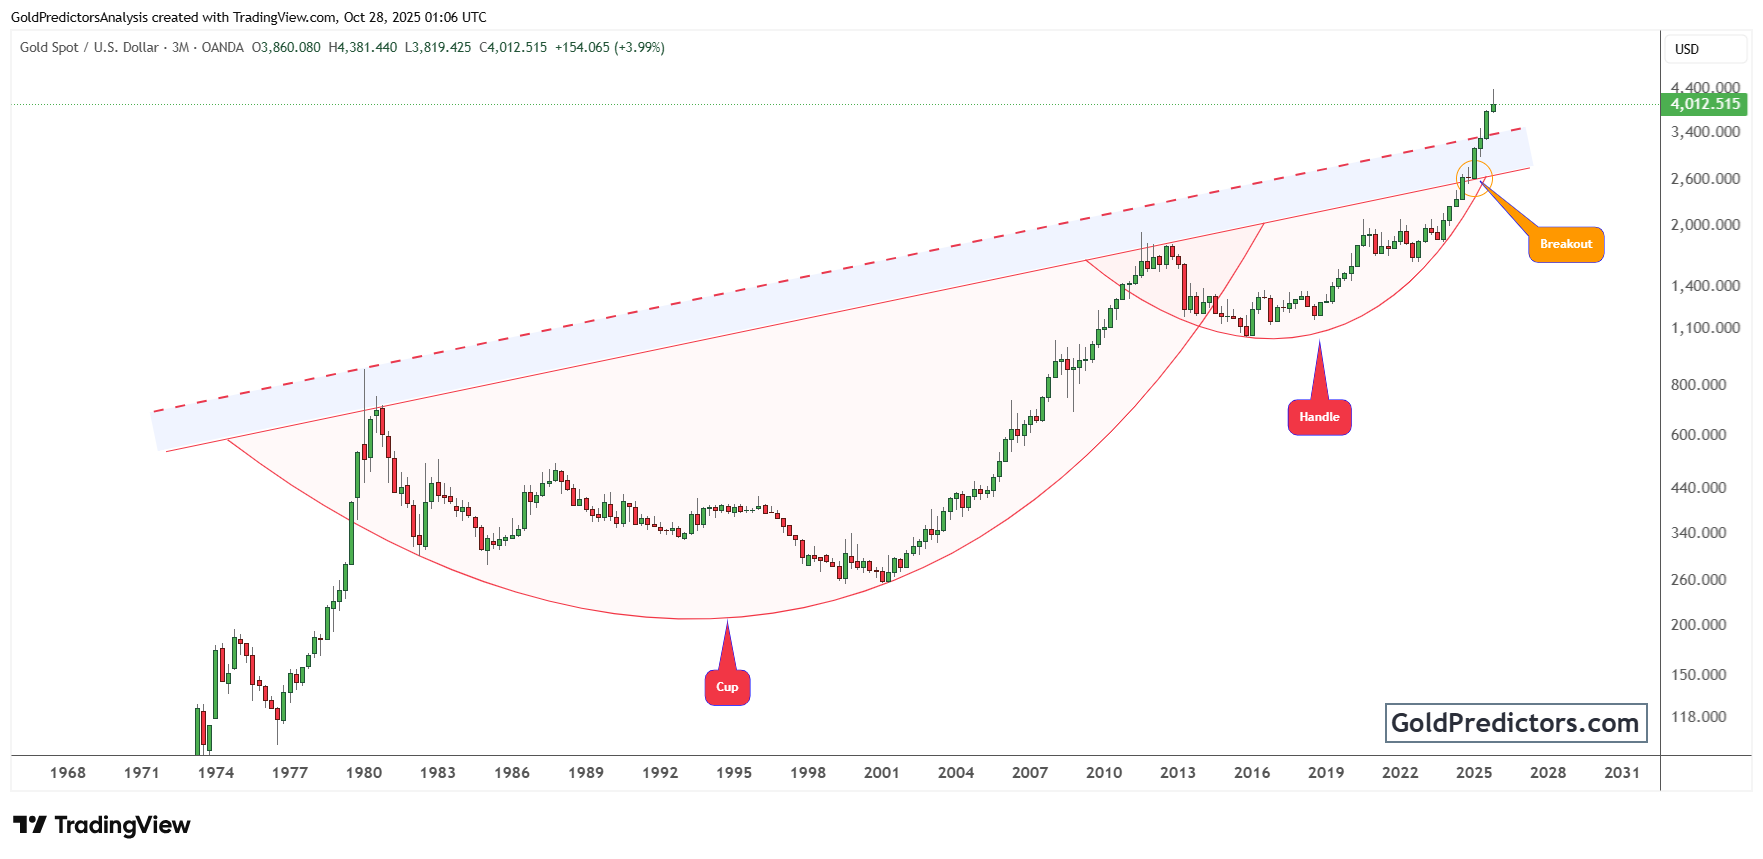
After an extended consolidation, gold broke out decisively in 2024 and 2025, clearing a major long-term resistance level. The breakout followed a decisive move above a trendline that had limited gold’s progress for decades. A strong monthly close above this barrier confirmed the trend shift. Price strength and rising volume suggest institutional participation and large-scale capital rotation into gold.
With gold now holding firmly above its former resistance zone, the market has entered a phase of price discovery. Historically, breakouts from major technical formations like this often lead to sustained multi-year advances. Powerful macroeconomic tailwinds also support this breakout. Central banks are purchasing gold at a record pace, while geopolitical instability, concerns over sovereign debt, and a shift toward dovish monetary policy have increased demand for safe-haven assets. These dynamics suggest that gold is positioned for one of its strongest cycles in decades.
Gold Strengthens as Bitcoin-to-Gold Ratio Breaks Key Support Level
The chart below shows the Bitcoin-to-Gold ratio on a monthly timeframe, revealing pronounced volatility in recent years. Between 2022 and 2025, the ratio formed a rising triangle pattern, defined by a series of higher lows. However, each upward attempt was consistently rejected near the 35–40 level, which has historically acted as a key resistance zone. Although the pattern showed signs of building bullish momentum, consistent rejections at the upper boundary indicated strong resistance and a lack of breakout confirmation.
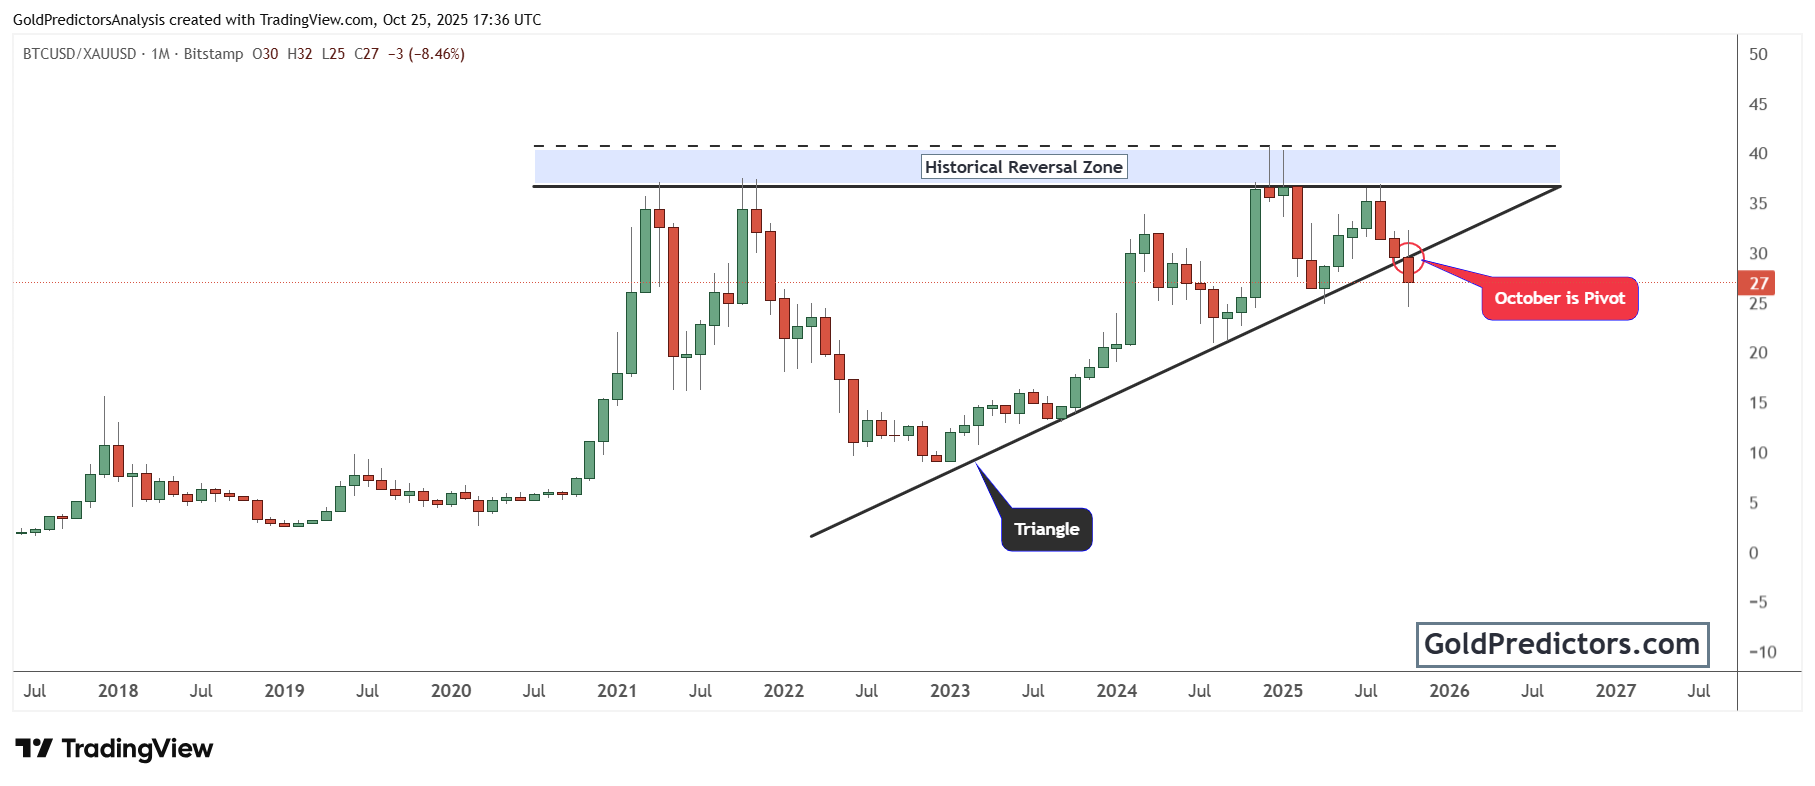
Meanwhile, recent price action indicates a potential breakdown in the Bitcoin-to-Gold ratio. The October candle broke below the triangle’s ascending support, marking a clear shift in trend. The chart’s annotation, ‘October is Pivot,’ highlights the potential significance of this close as a turning point in the trend. This type of failure pattern, where price cannot overcome resistance and then breaks support, is often a warning sign of a coming reversal.
Notably, gold’s ongoing strength is mirrored by a weakening Bitcoin-to-Gold ratio, highlighting a shift in relative performance. These developments suggest that capital may be shifting out of volatile markets and back into established hedges, such as gold. This development further strengthens the broader bullish outlook for gold.
Conclusion: Structural Breakout and Capital Rotation Support Gold’s Long-Term Strength
Gold has completed a multi-decade technical structure and confirmed a decisive breakout. The breakout signals a major shift in market dynamics, supported by strong volume and growing institutional demand. It also positions gold for continued strength in the years ahead.
At the same time, the Bitcoin-to-Gold ratio is breaking down. October marked a failed breakout attempt, followed by a sharp reversal. The inability to sustain gains near resistance and the breakdown below the triangle’s base suggest a weakening trend. Capital appears to be moving away from speculative digital assets and back into traditional safe havens.
Gold’s continued upward momentum highlights a growing divergence from the weakening BTC-to-Gold ratio. It remains firmly in a long-term uptrend, supported by strong macro drivers and a confirmed technical breakout. This environment continues to favour gold’s relative strength and solidifies its position as a core asset in the current market landscape.
Gold Predictors Premium Membership
Get exclusive short-term and swing trade ideas with precise entry levels, stop-loss, and target prices, including justification and analysis — all delivered directly via WhatsApp.
Our premium service includes deep technical analysis on gold and silver markets. We cover cycle analysis, price forecasting, and key timing levels.
Members also receive a weekly market letter with detailed analysis, commentary from our Chief Analyst, including actionable insights, trade timing, and direction forecasts for gold and silver.
Stay ahead of the market — join our premium community today.


