


Gold vs. Inflation: Multi-Decade Cup-and-Handle Formation Targets Massive Upside
Gold (XAUUSD) is breaking out of a decades-long consolidation. It has surged above key resistance levels and entered a new phase of its long-term bull market. Recent technical patterns confirm the shift. A 50-year ascending channel and a massive cup-and-handle formation now support the bullish case. At the same time, gold is outperforming inflation, adding strength to its macro profile. These developments point to a potential revaluation and signal the start of a powerful upward cycle.
Gold Confirms Cup-and-Handle Breakout Inside Long-Term Bullish Channel
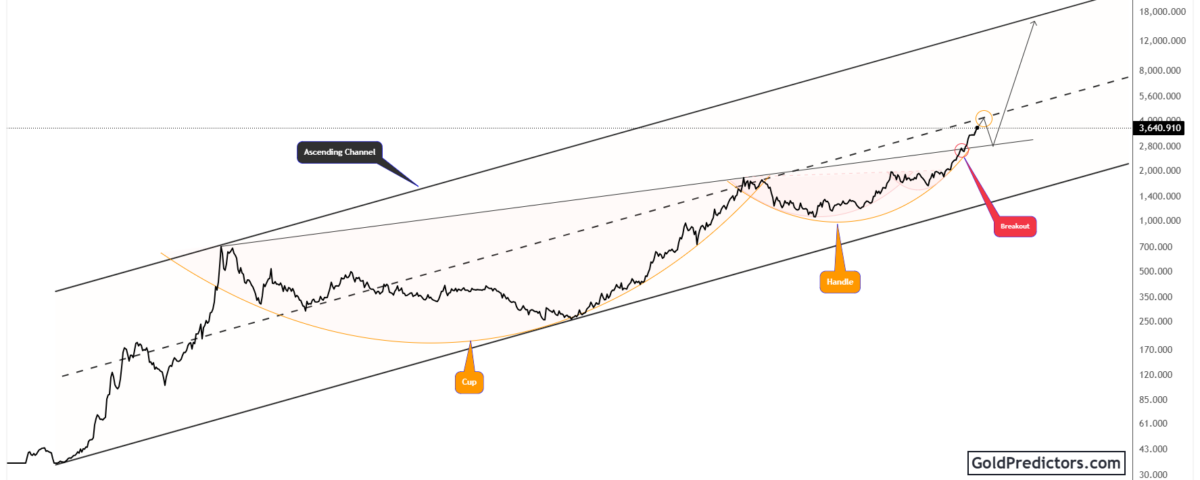
The gold chart below shows a well-defined ascending channel that has consistently guided price action for over five decades. Historical highs in 1980 and 2011 tested the channel’s upper resistance. Meanwhile, key bottoms in the mid-1980s and early 2000s aligned with its lower boundary. Gold has repeatedly moved between the boundaries of this channel. Overall, this long-term structure reflects the sustained strength behind gold’s upward trajectory.

Moreover, the chart reveals a multi-decade cup and handle formation. Specifically, the cup pattern began to develop in 1980, when gold reached a significant high and started a multi-year decline. This base formation persisted until 2011, when gold began accelerating toward its historical highs. Between 2011 and 2022, gold formed the handle portion of the pattern through an extended period of consolidation. This formation precedes a strong continuation of the broader upward trend.
Following years of consolidation, gold finally completed its handle in 2024 and broke through significant resistance at $2,075. This breakout has initiated a sharp upward move toward the channel’s upper boundary. If momentum persists, gold may reach between $8,000 and $12,000 in the years ahead. However, the strength and duration of the current trend will determine how quickly it approaches that zone. The overall setup suggests that gold may be starting a powerful and extended upward trend.
Gold Outpaces Inflation as USCPI Ratio Breaks Multi-Decade Resistance
The chart below shows gold’s performance relative to the U.S. Consumer Price Index (USCPI), reflecting its real strength when adjusted for inflation. Historically, gold has moved with inflation, but a breakout above the USCPI trendline often reflects rising concerns over monetary stability. Such breakouts usually signal meaningful shifts in market psychology and broader macroeconomic dynamics.
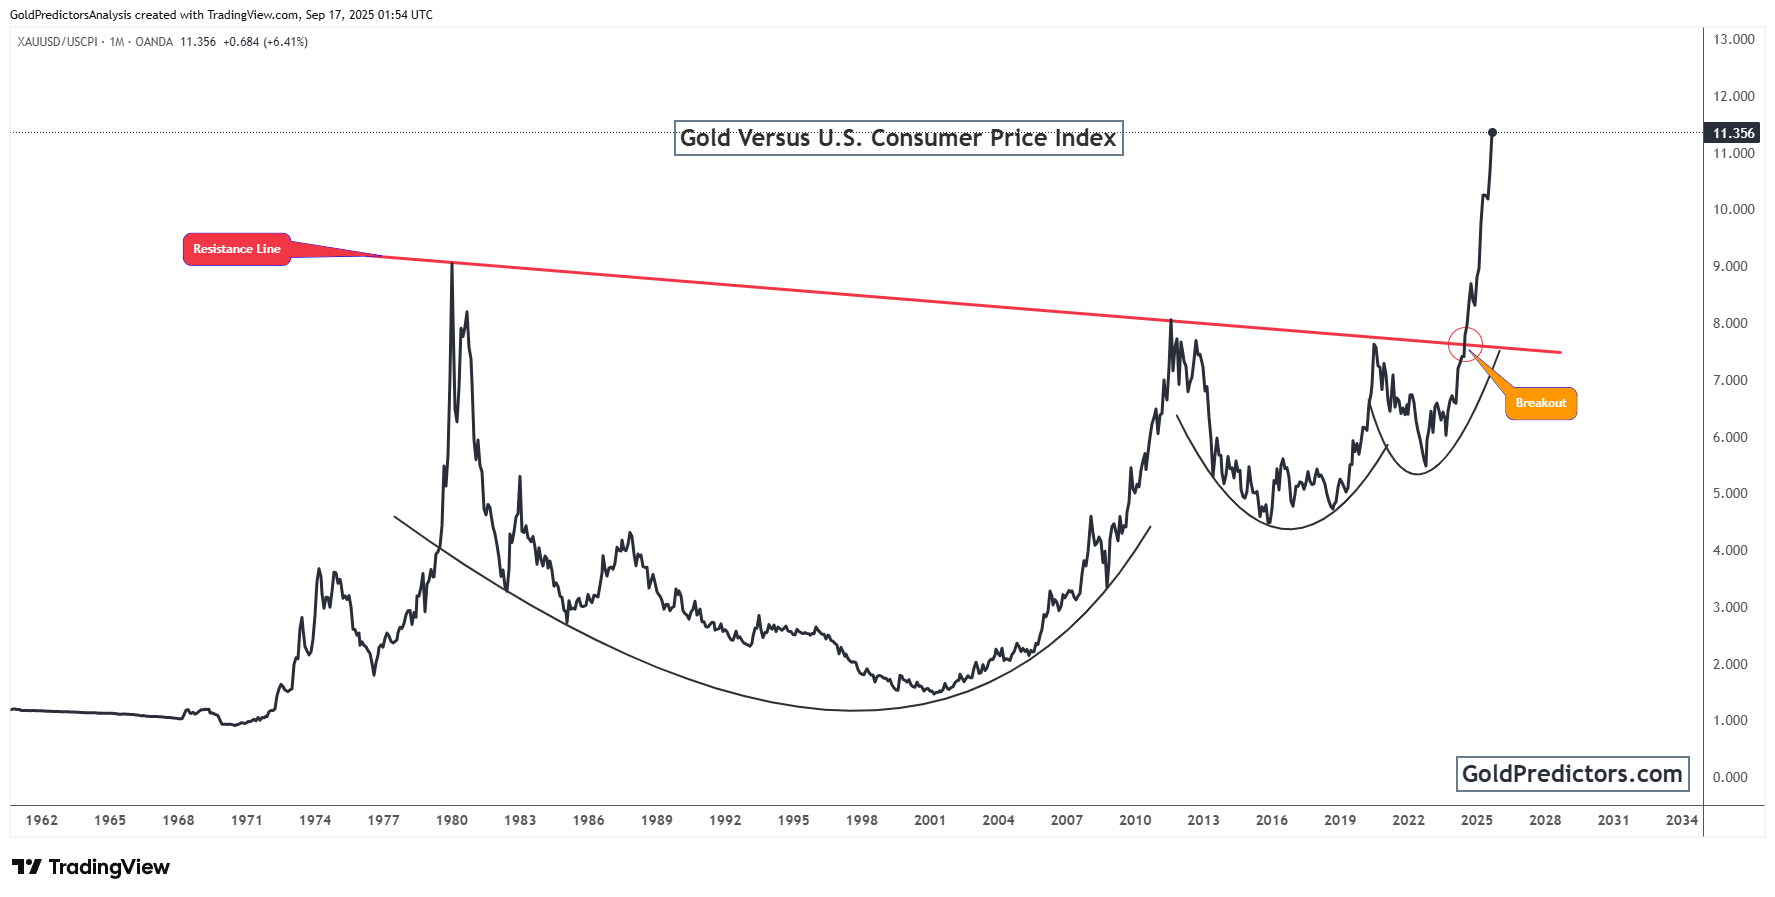
Starting in the 1970s, the gold/USCPI ratio gradually evolved into a broad cup-shaped structure over several decades. After hitting its peak in 1980, the ratio underwent a steep decline and remained in a sustained downtrend for several decades. Over time, the pattern eventually established a broad, rounded base and started a new upward trend from 2001, signalling the start of a larger breakout phase.
After decades of pressure, the ratio has finally moved above a critical descending resistance that had restricted growth since 1980. Specifically, the breakout occurred just above the 7.5 level and has now surged past 11.3, confirming that gold is not only rising in nominal terms but also outperforming inflation at an accelerating pace. This breakout signals a significant macroeconomic shift in capital allocation. Consequently, gold is now reclaiming its role as a long-term hedge against inflation and a reliable store of value.
Conclusion: Gold Enters Structural Bull Phase with Long-Term Upside Potential
Gold has entered a decisive new phase of its historic bull market. The latest breakout confirms a structural shift in both nominal and inflation-adjusted terms. This move signals rising doubts about monetary stability and boosts gold’s appeal as a safe haven. The broader setup favours a continuation of the upward trend. If current conditions hold, gold may be entering the early stages of a multi-year upward trend.
Gold’s breakout within the long-term channel and its surge past the CPI trendline offer a strong indication of a durable uptrend. The 50-year cup-and-handle pattern marks the end of a prolonged consolidation. At the same time, the gold/USCPI ratio has surged above multi-decade resistance. This validates gold’s outperformance against inflation and reinforces its role as a long-term strategic asset.
Taken together, these signals point to a significant revaluation of gold in the current market environment. Moreover, gold has moved beyond a steady climb and is now breaking through significant technical and macro barriers. If this trend continues, the path toward $8,000–$12,000 becomes more credible over the long term.
Gold Predictors Premium Membership
Get exclusive short-term and swing trade ideas with precise entry levels, stop-loss, and target prices, including justification and analysis — all delivered directly via WhatsApp.
Our premium service includes deep technical analysis on gold and silver markets. We cover cycle analysis, price forecasting, and key timing levels.
Members also receive a weekly market letter with detailed analysis, commentary from our Chief Analyst, including actionable insights, trade timing, and direction forecasts for gold and silver.
Stay ahead of the market — join our premium community today.


