Gold vs Copper: Is Copper Set to Extend Its Outperformance?
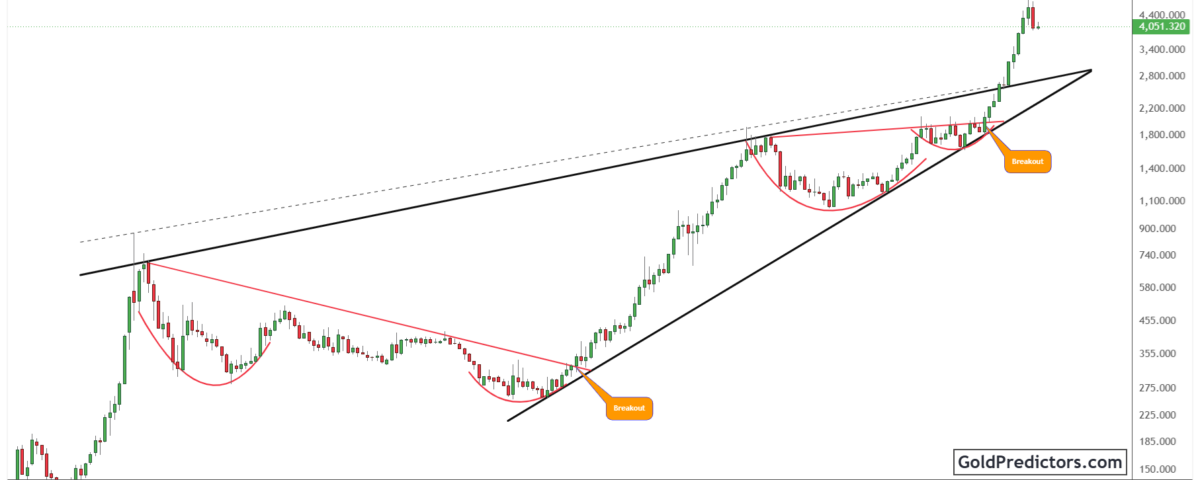
Gold (XAUUSD) remains in a corrective phase after completing a historic breakout from a multi-decade triangle pattern. Despite the recent pullback, the broader technical structure remains intact as price continues to hold above the breakout area. At the same time, the Gold-to-Copper ratio has turned lower after another rejection from long-term wedge resistance, indicating copper’s relative strength over gold. These technical structures continue to provide an important long-term framework, with gold preserving its broader structure while copper maintains its relative outperformance.
Gold Technical Analysis: XAU/USD Holds Above Historic Breakout
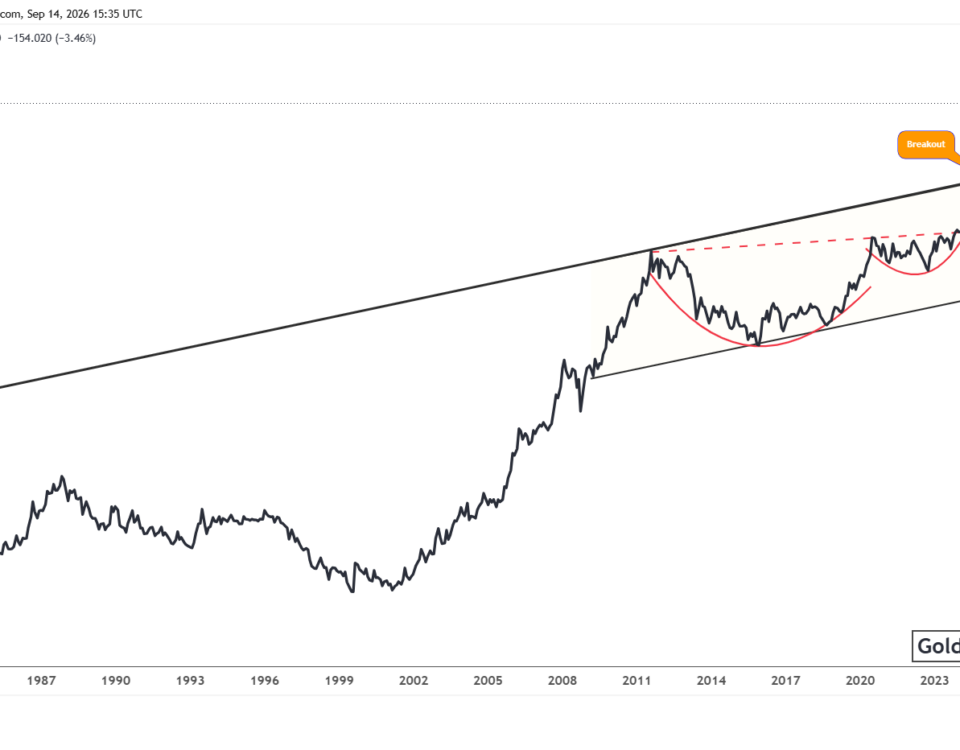
The gold chart below shows a major long-term triangle that has guided price action for several decades. The upper resistance trendline repeatedly limited major advances, while the rising support trendline continued to contain major corrections. Gold respected both boundaries throughout the pattern before eventually breaking above the upper resistance. The breakout completed the long-term structure and confirmed a significant shift in the broader technical outlook.
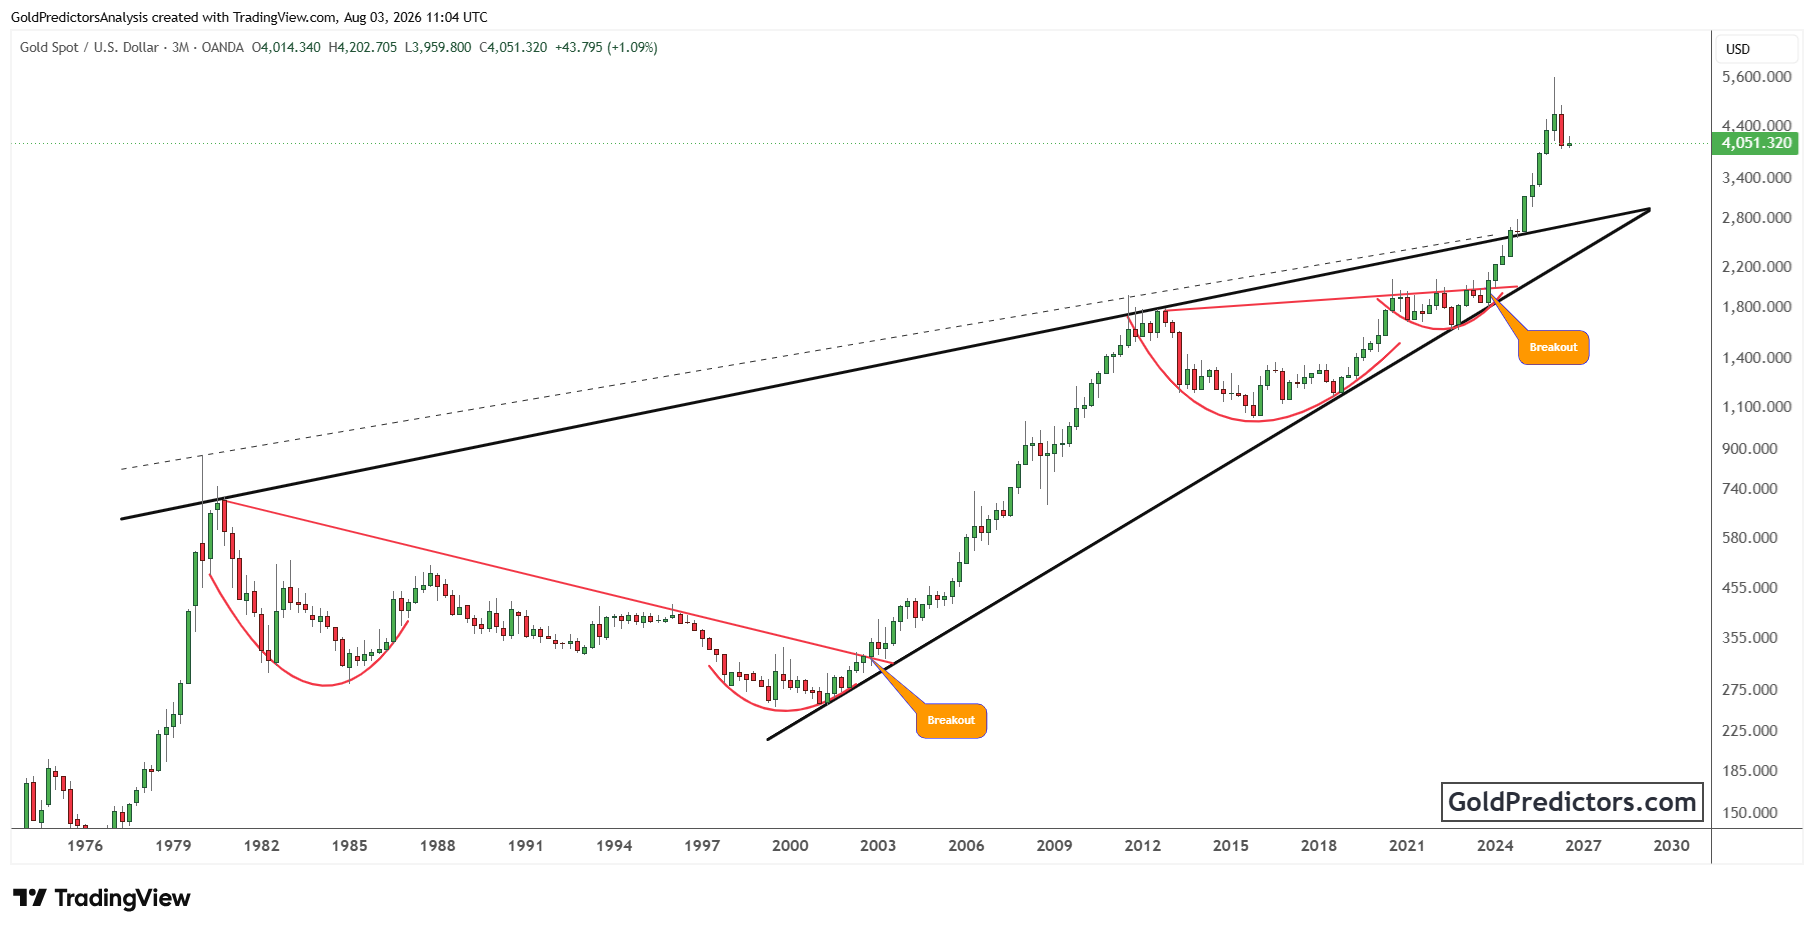
Following the breakout, gold advanced strongly and reached fresh record highs after clearing a long-term technical barrier. The subsequent correction has developed after this exceptional rally but has not altered the broader technical picture. Price continues to trade comfortably above the breakout area, confirming that the former resistance zone now serves as an important long-term support level.
The recent pullback appears to be part of a normal consolidation following the historic breakout and strong advance. Corrections of this nature often allow long-term trends to stabilize before the next directional move develops. As long as gold remains above this key support region, the long-term technical outlook continues to favor further strength.
Gold-to-Copper Ratio Signals Continued Copper Outperformance
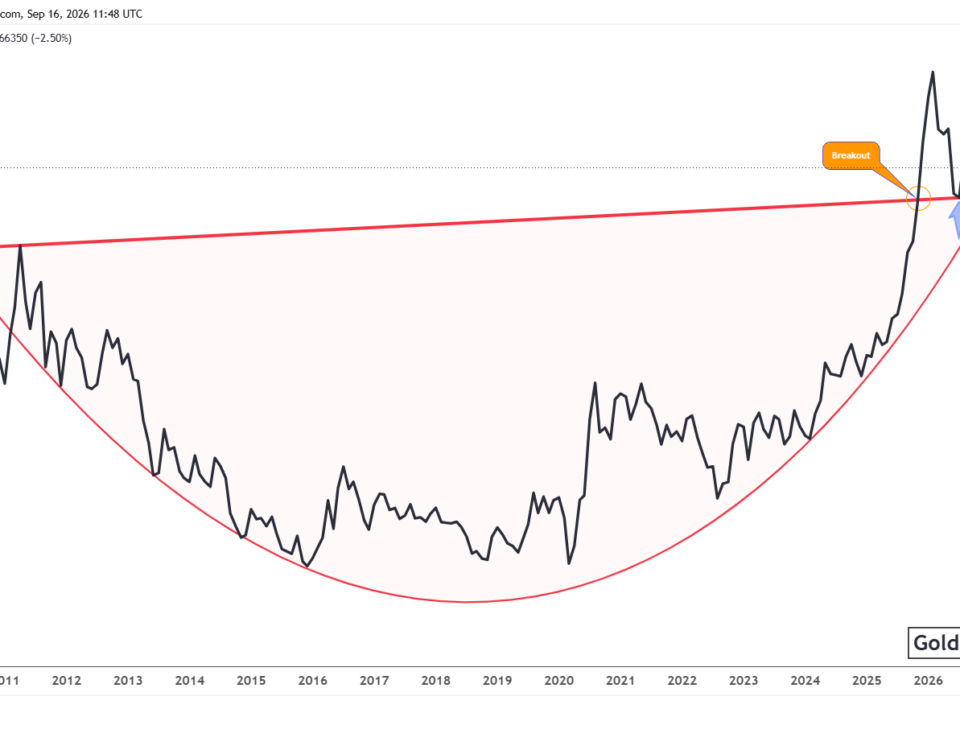
The chart below shows the Gold-to-Copper ratio trading within a long-term ascending wedge that has guided price action since 2011. The upper trendline has repeatedly capped major advances, while the lower trendline has continued to provide support during major corrections. Each test of the upper boundary has been followed by a significant decline toward lower levels within the wedge. The latest rally also stalled at this long-term resistance before turning lower.
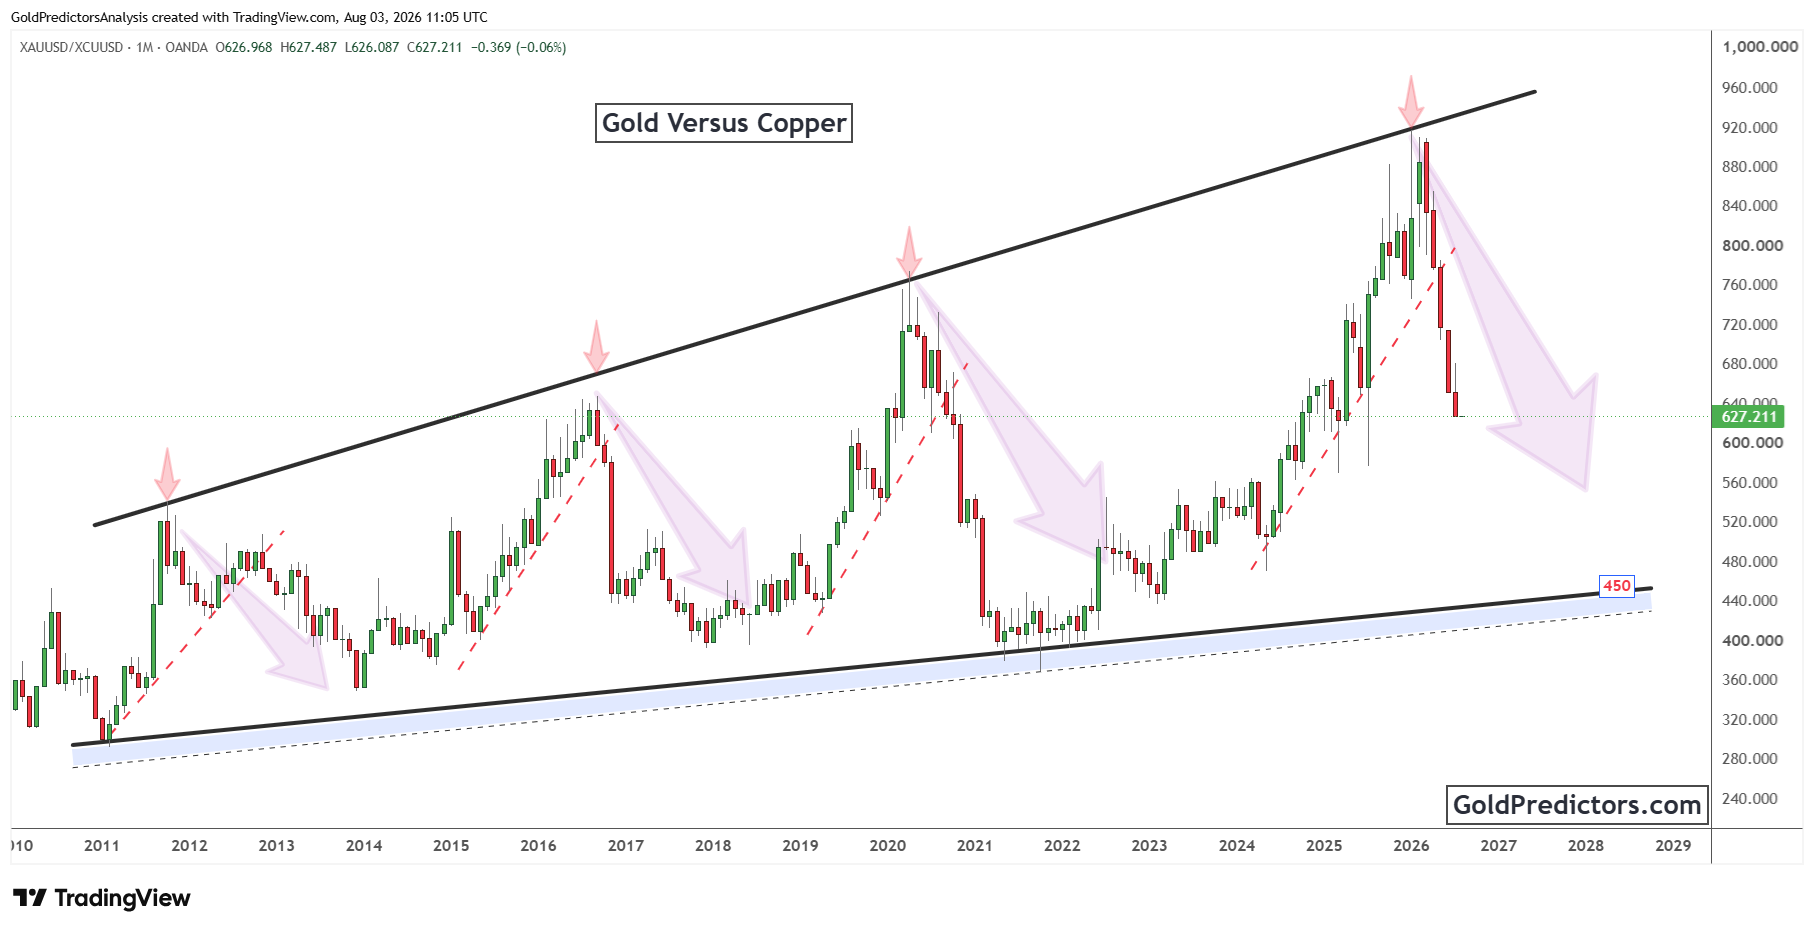
The rejection from wedge resistance has placed the ratio under renewed pressure. This reaction closely resembles previous declines that developed after tests of the upper trendline, confirming that the resistance area remains technically significant. Despite the recent weakness, the ratio continues to trade within the long-term ascending wedge, preserving the broader structure.
The recent rejection suggests that the corrective phase could continue if the historical pattern persists. Previous reversals from the upper trendline have often been followed by extended declines within the ascending wedge. Continued weakness in the ratio would indicate that copper is outperforming gold. As long as the current technical structure remains intact, copper is likely to maintain its relative outperformance over gold.
Gold and Copper Outlook: Long-Term Breakout Holds as Copper Maintains Relative Strength
Gold remains in a corrective phase following its historic breakout from the multi-decade triangle. The recent pullback has not changed the broader technical structure. Price continues to trade above the breakout area, keeping the long-term outlook intact. The current correction appears consistent with a normal consolidation following a major structural breakout.
At the same time, the Gold-to-Copper ratio continues to move lower after another rejection from long-term wedge resistance. The ratio remains within its long-term ascending wedge despite the recent decline. The latest move follows a pattern seen during previous reversals from wedge resistance. Continued weakness in the ratio would indicate that copper is maintaining its relative strength over gold.
These developments continue to support the long-term outlook for both markets. Gold continues to preserve its historic breakout despite the current correction. Meanwhile, the Gold-to-Copper ratio continues to favor copper outperformance over gold. As long as these long-term structures remain intact, the broader technical outlook remains unchanged.
Gold Predictors Premium Membership
Get exclusive short-term and swing trade ideas with precise entry levels, stop-loss, and target prices, including justification and analysis — all delivered directly via WhatsApp.
Our premium service includes deep technical analysis on gold and silver markets. We cover cycle analysis, price forecasting, and key timing levels.
Members also receive a weekly market letter with detailed analysis, commentary from our Chief Analyst, including actionable insights, trade timing, and direction forecasts for gold and silver.
Stay ahead of the market — join our premium community today.