


Gold Technical Analysis: Decade-Long Breakout and M2 Ratio Collapse Ignite Bull Market
Gold (XAUUSD) has confirmed a significant bullish reversal after breaking out of a decade-long consolidation. The move above $2,100 marks the completion of a large inverse head and shoulders pattern, a classic signal of long-term strength. Since early 2024, prices have surged above $3,000, backed by strong technical momentum. At the same time, a sharp decline in the M2-to-gold ratio indicates that gold’s value is rising relative to the expanding money supply. Together, these signals mark the start of a new long-term bull market driven by technical and macroeconomic forces.
Decade-Long Inverse Head and Shoulders Breakout Signals Long-Term Gold Rally
The chart below shows a historic breakout in the gold market, signalling a significant shift in long-term trends. After a decade-long consolidation between 2011 and 2023, gold has finally broken above the $2,100 resistance level. This level capped prices for several years, despite multiple attempts to push prices higher. The consolidation phase formed a complex inverse head and shoulders pattern, which is a classic bullish reversal signal.
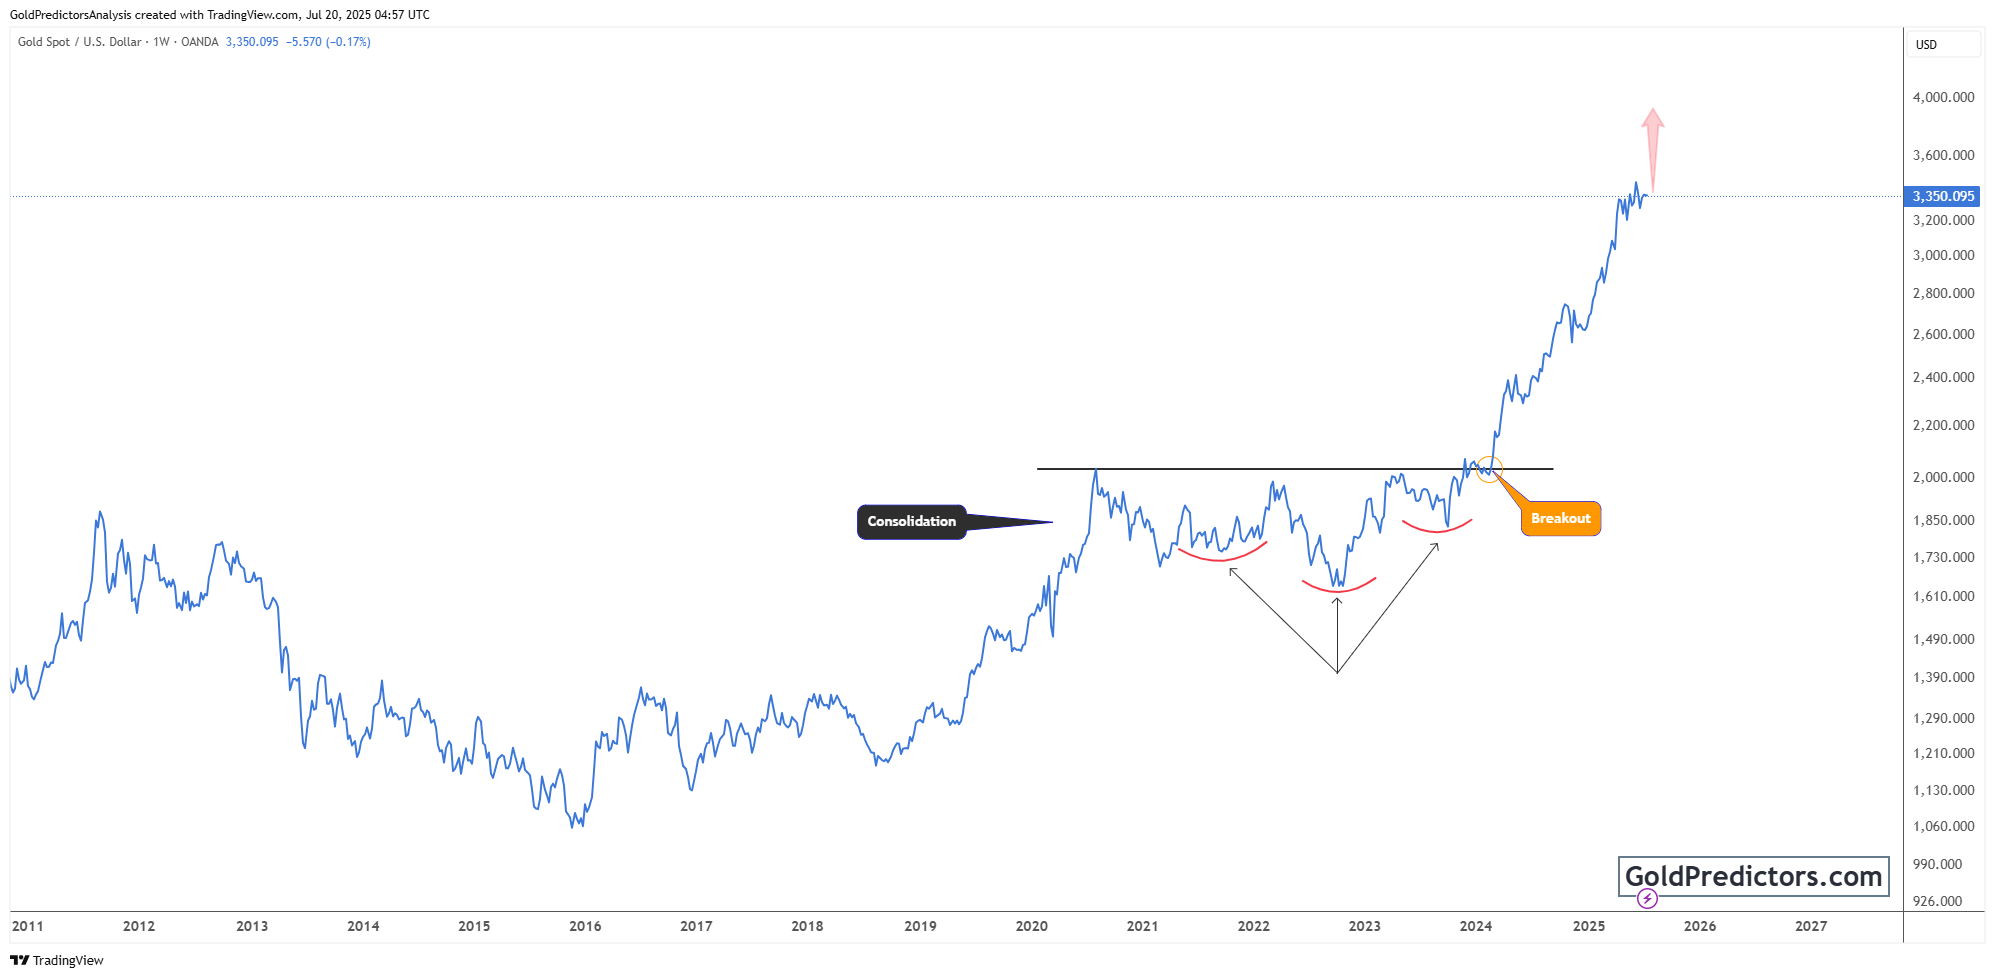
The breakout occurred in early 2024, and prices have since exploded higher. Gold is now trading above $3,300, confirming strong upward momentum. The technical projection of the breakout suggests that gold could target the $3,800–$4,000 range in the coming months. This bullish surge is not speculative as it is based on long-term accumulation followed by a breakout and rapid expansion.
The pattern is large in scope and spans over a decade. This makes the breakout extremely significant from a structural perspective. Long-term investors often wait for such decisive moves to position themselves for extended periods of growth. The recent price action confirms that a new phase of long-term gold appreciation has begun.
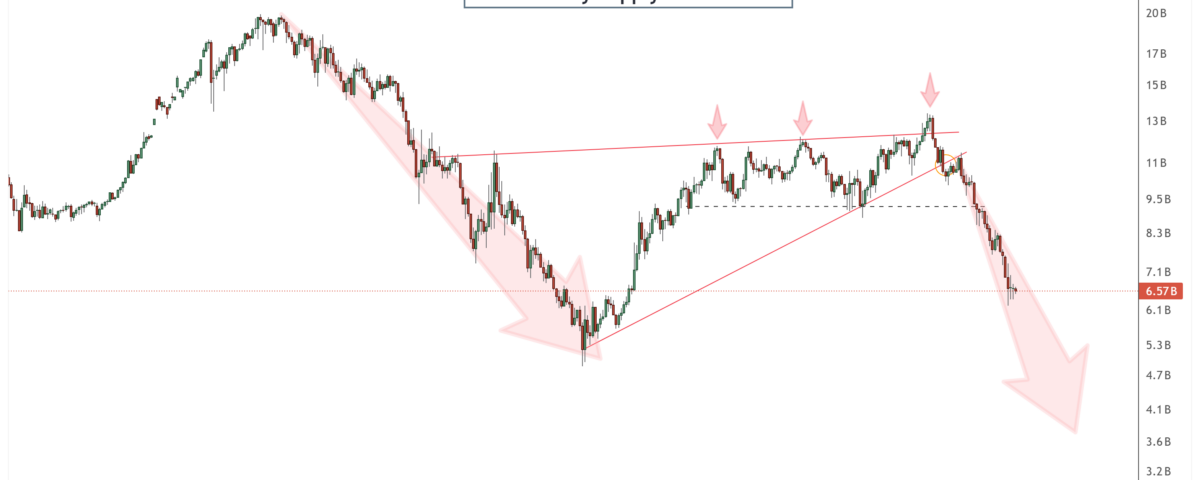
M2-to-Gold Ratio Collapse Underscores Gold’s Strength against Fiat Expansion
The chart below shows the US M2 money supply to gold ratio, a key metric that compares the total money supply to the value of gold. This ratio peaked around 2022 after forming a rising wedge pattern. Since then, it has experienced a dramatic decline, dropping from over 13 to around 6.5 as of mid-2025. This sharp decline suggests that gold is significantly outperforming the expansion of fiat currency, a trend that often indicates more profound structural shifts in the financial system.

Historically, breakdowns in the M2-to-gold ratio have aligned with major gold bull markets. A notable previous example occurred in the early 2000s, when a similar pattern preceded a prolonged and sustained rally in gold. The current breakdown is also technical. A triangle formed between 2011 and 2022, which has now broken decisively to the downside. This mirrors past behaviour, where technical patterns in this ratio anticipated strong Long-term moves in the gold market.
A falling M2-to-gold ratio signals that gold is strengthening not just against the US dollar, but against the entire monetary system. This trend reinforces the significance of gold’s recent price breakout and highlights its re-emerging role as a hedge against inflation, economic expansion, and systemic financial risk. The chart confirms that the shift in gold’s value is technical and fundamental, rooted in broad macroeconomic changes.
Conclusion: Gold Enters New Bull Market Backed by Technical Breakout and Monetary Imbalance
Gold has entered a powerful new phase of long-term appreciation. The breakout above $2,100 confirms a decade-long inverse head-and-shoulders pattern, signalling the start of a sustained bull market. Prices now trade well above $3,300, with projections targeting even higher levels in the coming months or years.
The collapse in the M2-to-gold ratio reinforces this trend. Gold is not only rising in dollar terms, but it is also gaining value against the broader monetary system. This breakdown mirrors past cycles where gold outperformed during periods of currency dilution and economic uncertainty.
These developments highlight a rare alignment of technical and macroeconomic forces. Investors are now seeing gold as a strategic hedge and a long-term store of value. With structural patterns confirming the shift, gold is poised to lead in a changing financial landscape.
Gold Predictors Premium Membership
Get exclusive short-term and swing trade ideas with precise entry levels, stop-loss, and target prices, including justification and analysis — all delivered directly via WhatsApp.
Our premium service includes deep technical analysis on gold and silver markets. We cover cycle analysis, price forecasting, and key timing levels.
Members also receive a weekly market letter with detailed analysis, commentary from our Chief Analyst, including actionable insights, trade timing, and direction forecasts for gold and silver.
Stay ahead of the market — join our premium community today.


