


Gold Surge Above $3,400 Amid Iran-Israel Conflict
Gold prices jumped on Friday as investors reacted to rising tensions in the Middle East. Israel’s military strike on Iran triggered fears of a broader conflict. Investors quickly moved their money into safe-haven assets. As a result, spot gold climbed over $3,430, the highest level in more than a month.
The rally also gained strength from soft US inflation data and signs of a slowing job market. These factors increased bets on a potential Federal Reserve rate cut. The lower interest rates reduce the opportunity cost of holding gold, making it more attractive. Together with geopolitical fears, this economic backdrop fueled strong demand for gold in the markets.
Bullish Ascending Channel with Eyes on $3,500 Resistance.
The chart below shows gold’s price movement within a well-defined ascending channel since late 2023—an ascending channel forms when price moves consistently between two parallel upward-sloping lines. The price has respected the support and resistance levels of this channel. This structure indicates a strong bullish trend. Every dip towards the lower boundary has been followed by buying interest, pushing prices higher.
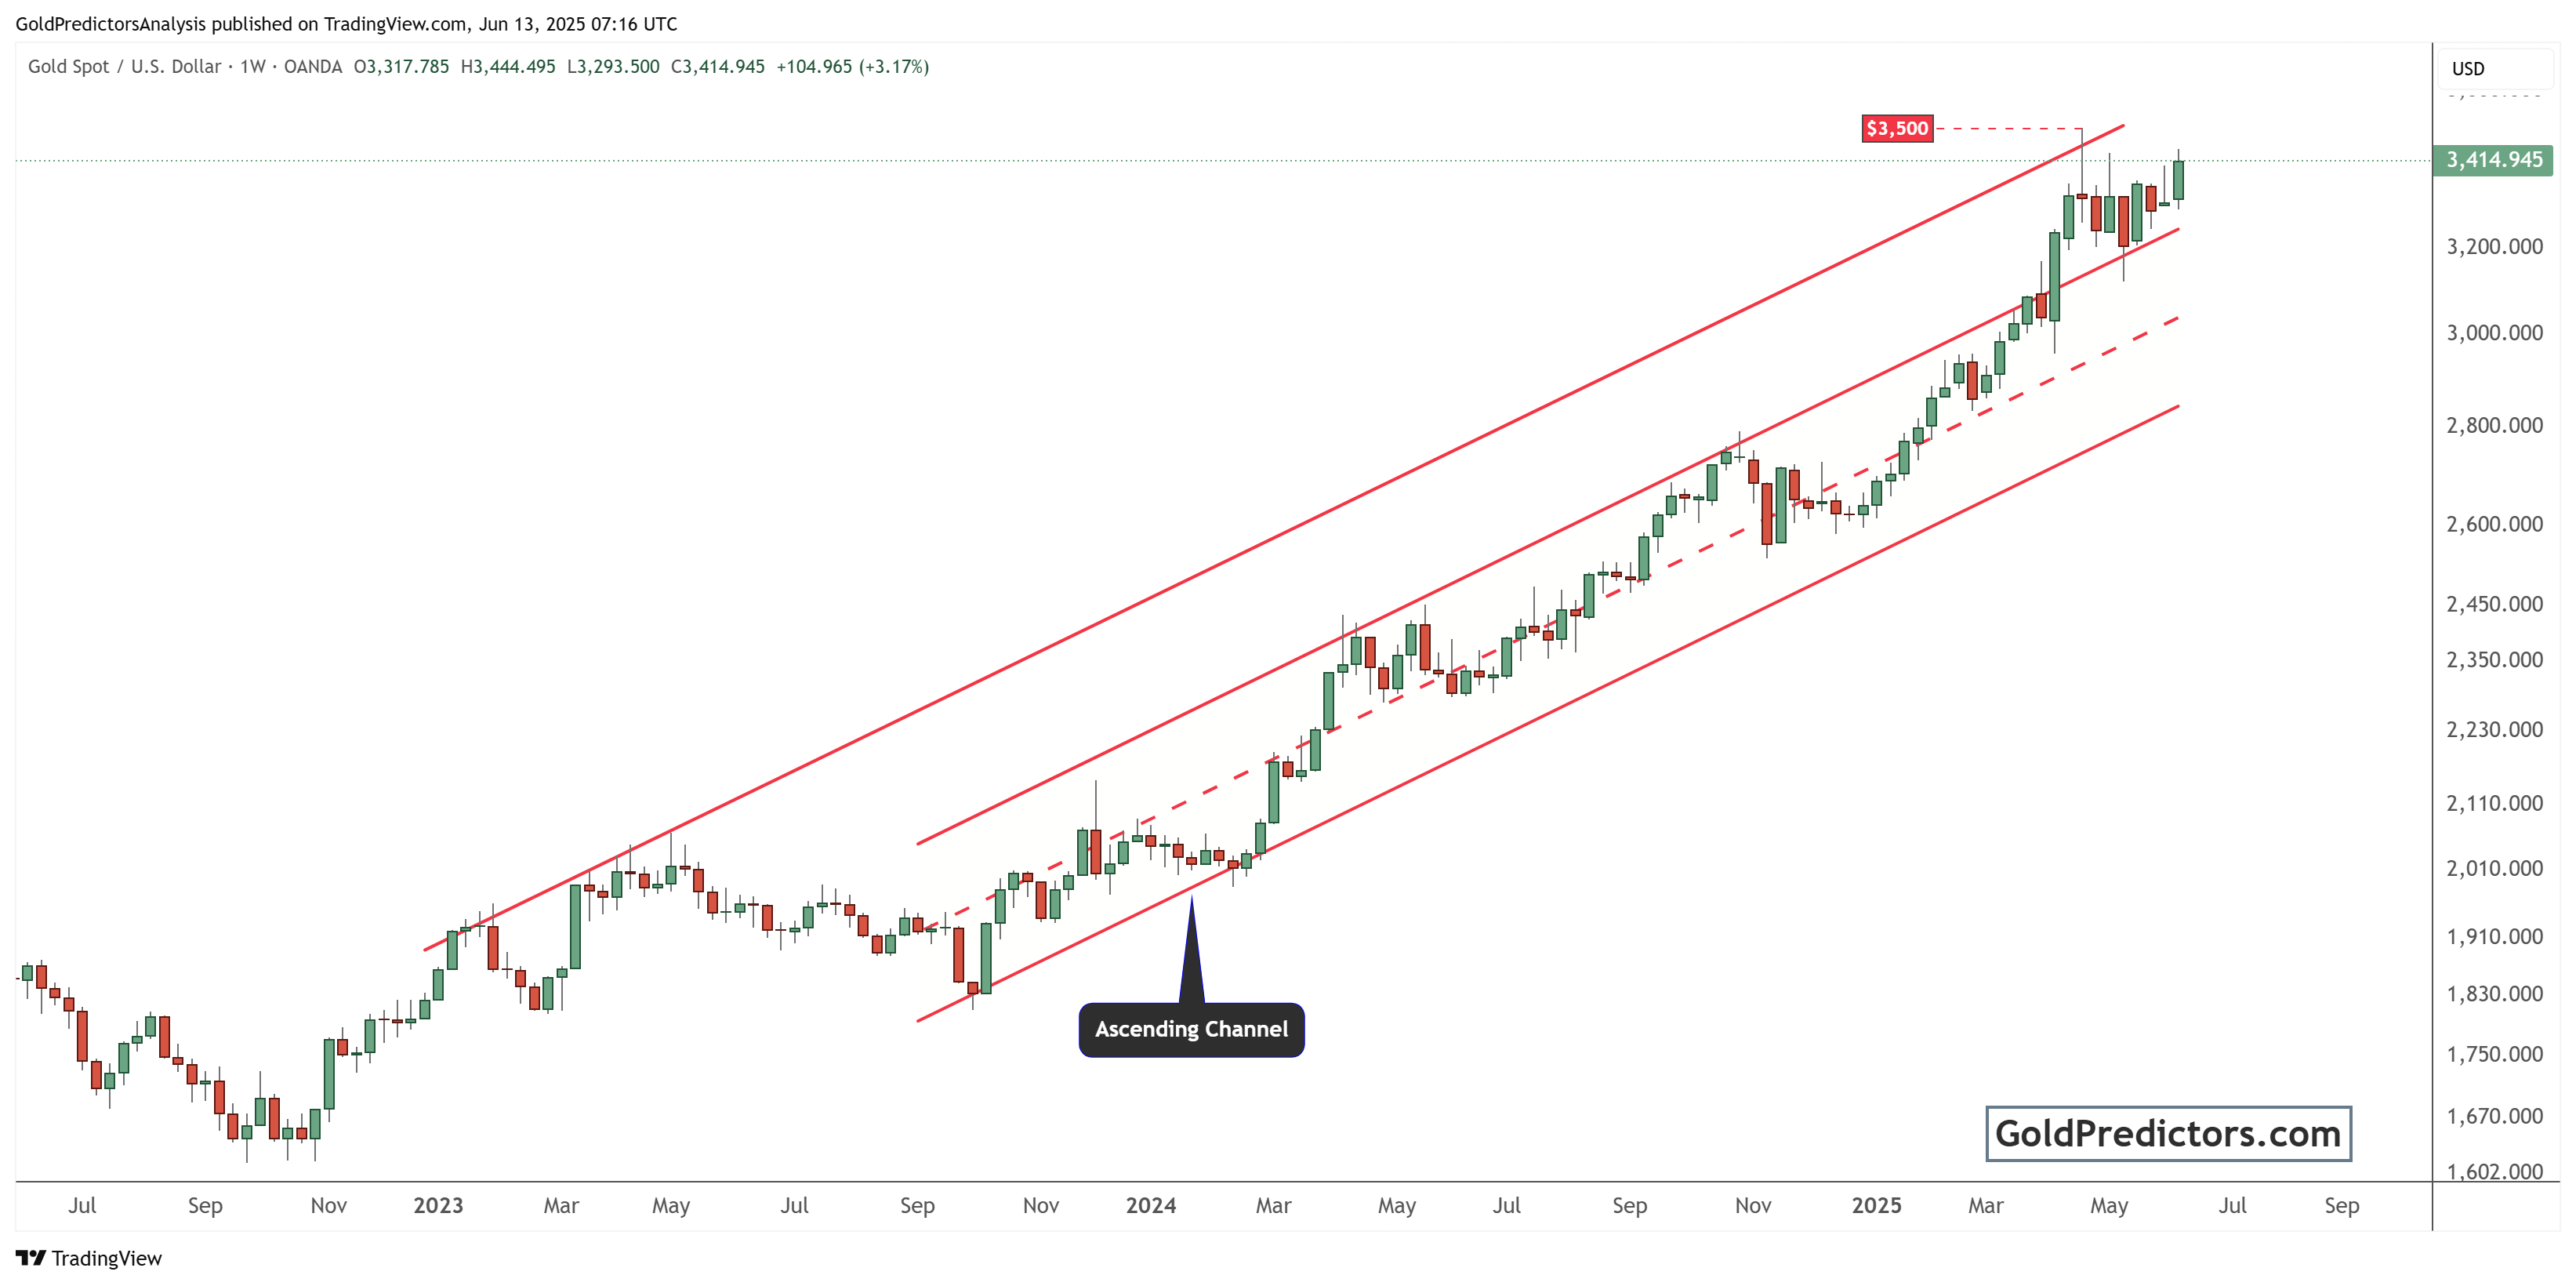
As of June 2025, the gold price has been hovering around $3,340. However, the price has broken above $3,400 as geopolitical tensions in the Middle East intensify. The price remains near the upper boundary of the channel, suggesting continued bullish strength. A breakout above $3,500, which is a psychological resistance level, could trigger a more substantial rally. The presence of higher lows and higher highs confirms the bullish market structure. This ascending channel provides a reliable framework for traders to establish long positions near support and consider taking profits near the resistance level.
The midline within the channel has also served as a short-term support and resistance zone. This adds more credibility to the price action. The overall trend suggests that gold might reach new all-time highs if current momentum continues.
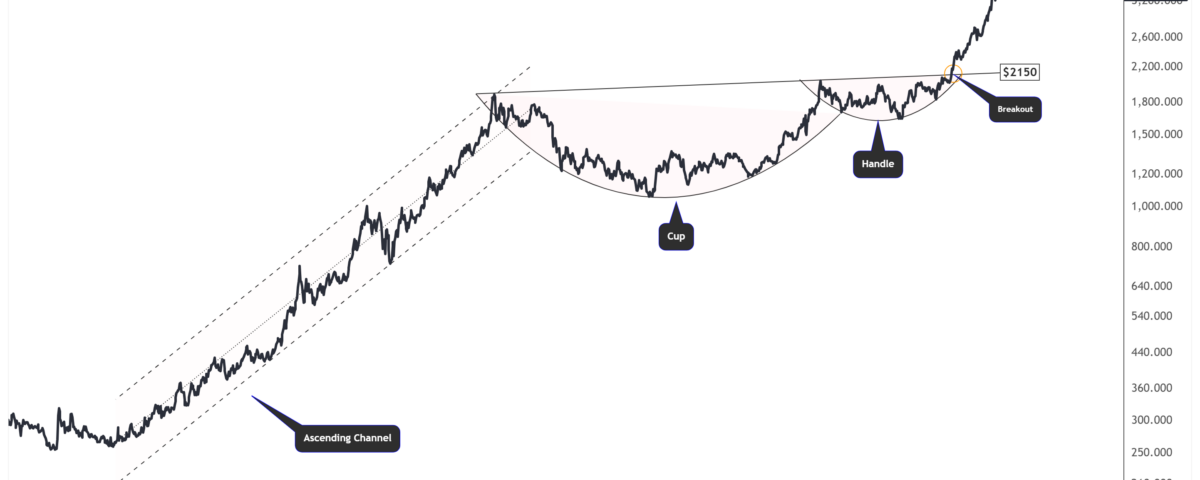
Long-Term Cup and Handle Pattern Points to $4,000
The chart below shows a multi-decade view of gold prices. The cup and handle pattern is formed over several years, starting from the 2011 peak and bottoming out around 2015–2016. The “cup” shows a rounded bottom, signaling long-term accumulation. After that, the “handle” formed as a consolidation zone between 2020 and 2023.
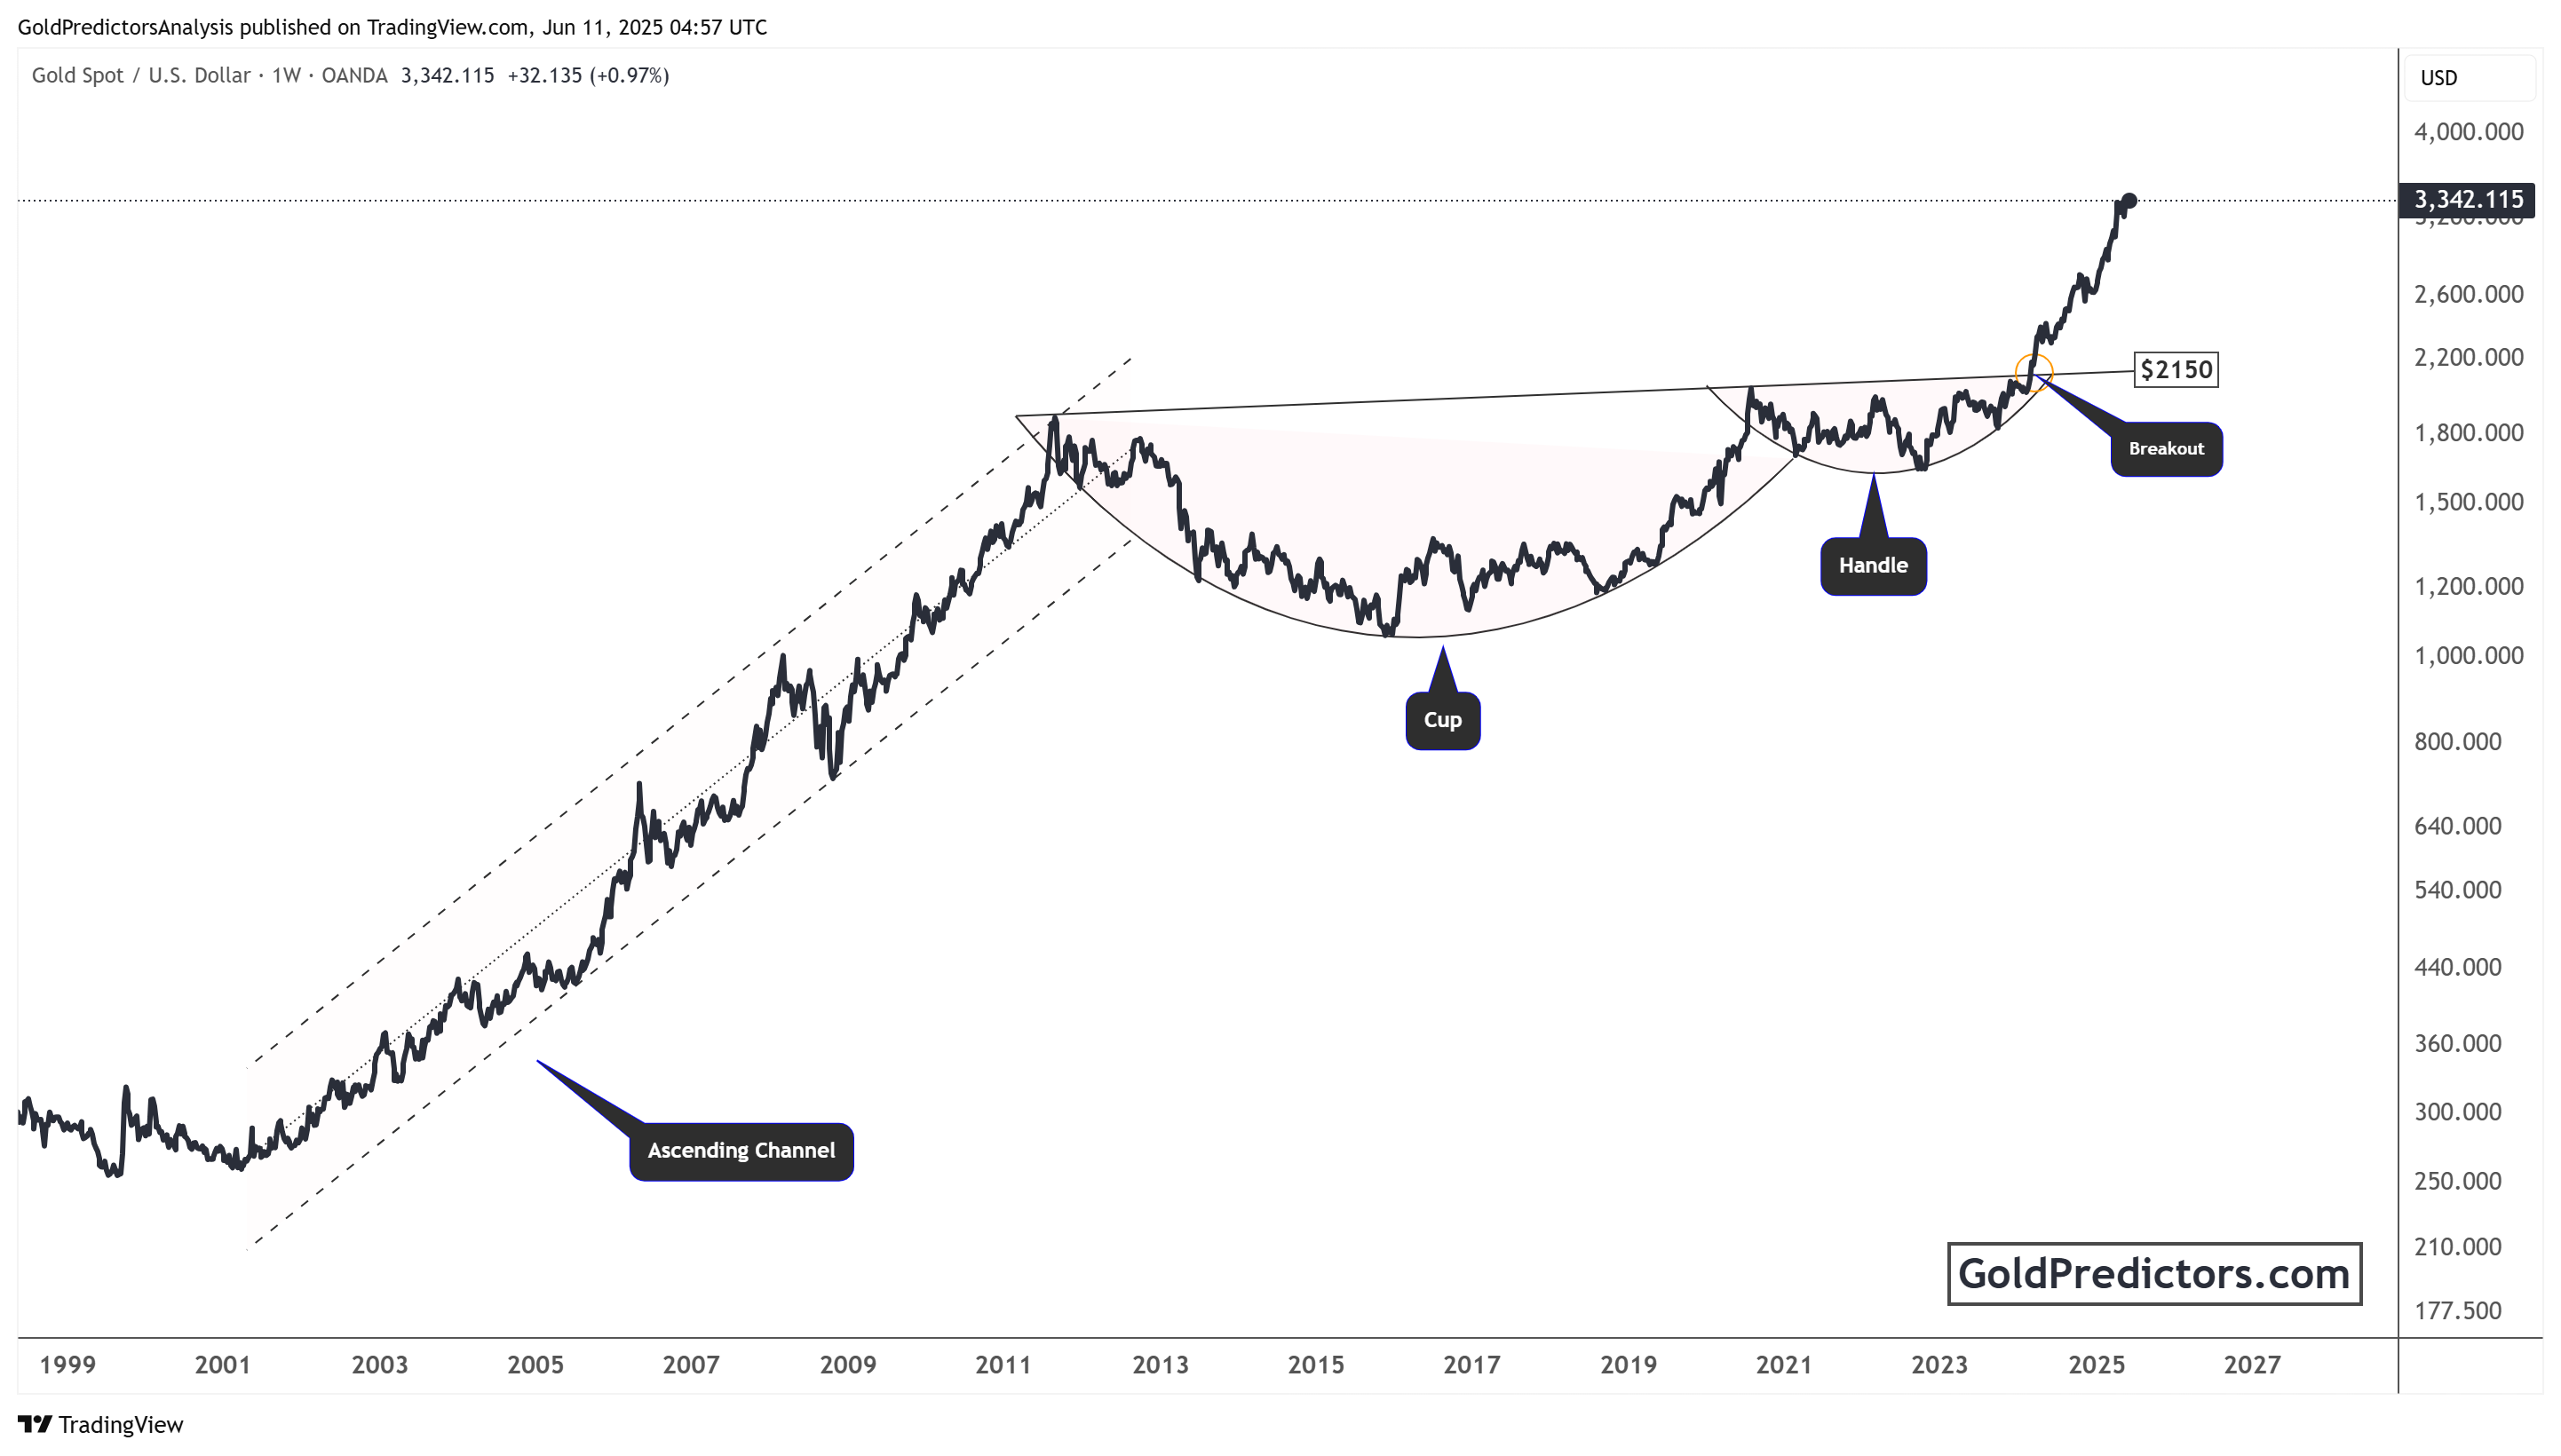
A breakout occurred above the $2,150 resistance level in early 2024. This breakout from the handle confirms a bullish continuation. The breakout was accompanied by a strong rally, pushing gold to current levels above $3,300. A breakout from such a long-term pattern typically results in significant upside.
Historically, a cup and handle breakout leads to sharp price appreciation. The measured target from this pattern can be estimated by measuring the depth of the cup and projecting it above the breakout point. In this case, a long-term price target well above $4,000 is feasible in the coming years if momentum continues. This breakout aligns perfectly with the ascending channel shown in the short-term chart. The convergence of these patterns increases the reliability of the bullish outlook.
Bottom Line
Gold remains firmly in a bullish trend, supported by rising geopolitical risks, a weakening US economy, and strong technical patterns. The ascending channel and the long-term cup-and-handle pattern indicate continued upside momentum. If momentum holds, gold could soon break above $3,500 and move toward the $4,000 target as the Iran-Israel conflict intensifies.
Gold Predictors Premium Membership
Get exclusive short-term and swing trade ideas with precise entry levels, stop-loss, and target prices, including justification and analysis — all delivered directly via WhatsApp.
Our premium service includes deep technical analysis on gold and silver markets. We cover cycle analysis, price forecasting, and key timing levels.
Members also receive a weekly market letter with detailed analysis, commentary from our Chief Analyst, including actionable insights, trade timing, and direction forecasts for gold and silver.
Stay ahead of the market — join our premium community today.


