


Gold Set for Breakout? Technical Signals Point to Bullish Momentum Ahead
Gold remains a focal point for traders and investors amid rising global economic uncertainty. In this environment, technical analysis serves as a vital tool for interpreting market behavior and forecasting future price movements. Recent formations, including the descending channel and the breakout in the Gold/NYSE Composite Index ratio, offer valuable signals about gold’s directional bias. This article explores these key patterns and assesses their implications for short- and long-term price trajectories.
Gold Price Consolidates in Descending Channel as Bullish Breakout Nears
The gold chart below shows the gold spot price on the daily timeframe. Gold is currently trading within a well-defined descending channel. This pattern has formed after gold reached a recent peak and started a series of lower highs and lower lows. The price is now fluctuating between two parallel downward-sloping trend lines.
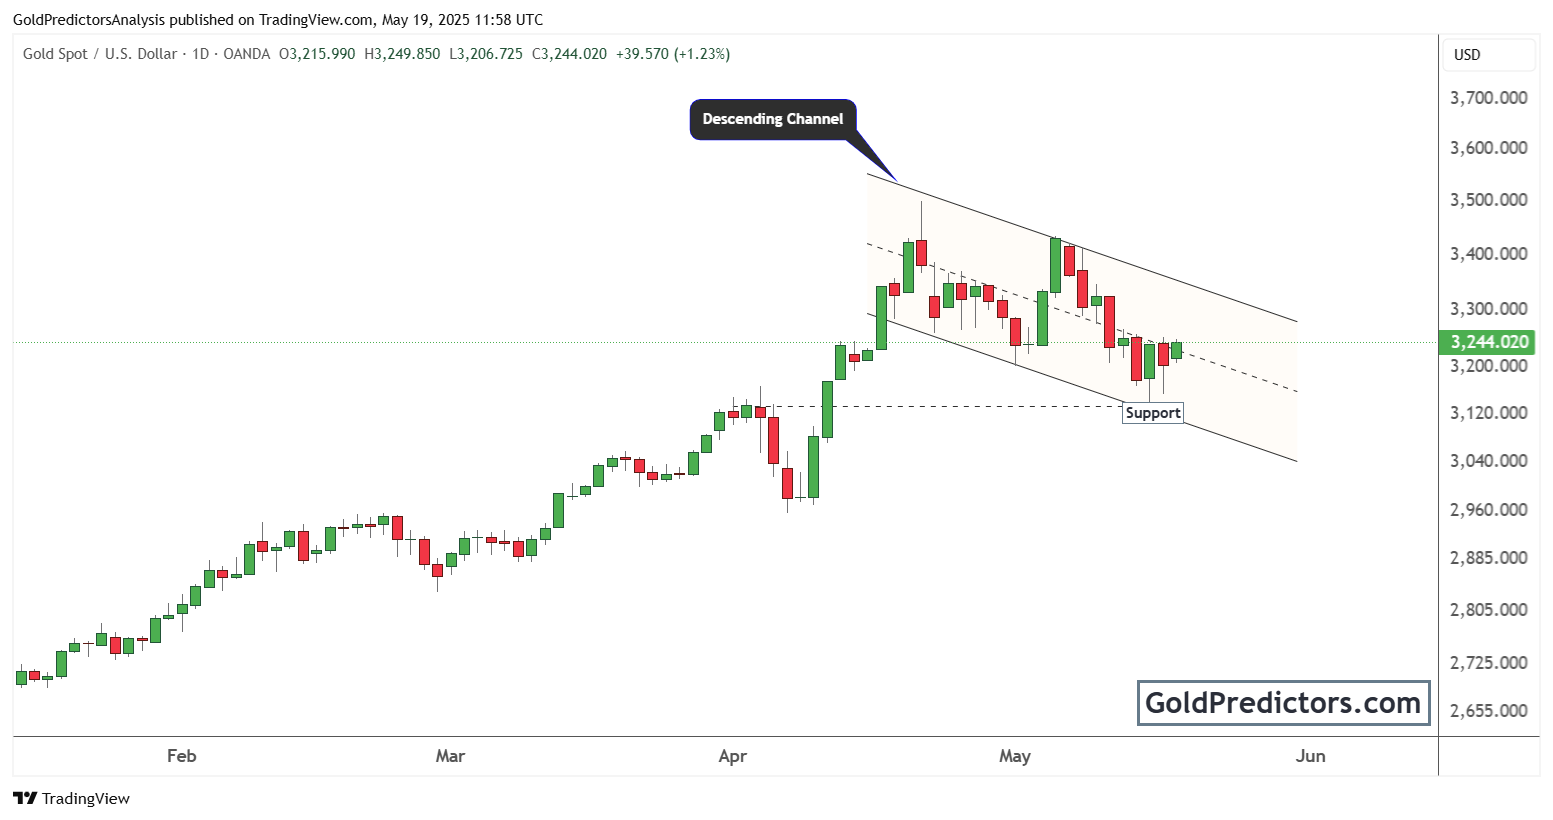
The price has shown strength by bouncing off a support level near the lower boundary of the channel. The green candlestick near the current price level indicates upward momentum. This suggests that buyers are active near support levels. However, the overall channel indicates a bearish bias in the short term unless gold breaks above the upper resistance line at $3,370.
Traders are closely watching this zone. A breakout above the descending channel would signal a shift in momentum and could attract further bullish interest.
Gold vs NYSE Ratio Breakout Signals Start of Long-Term Bull Market
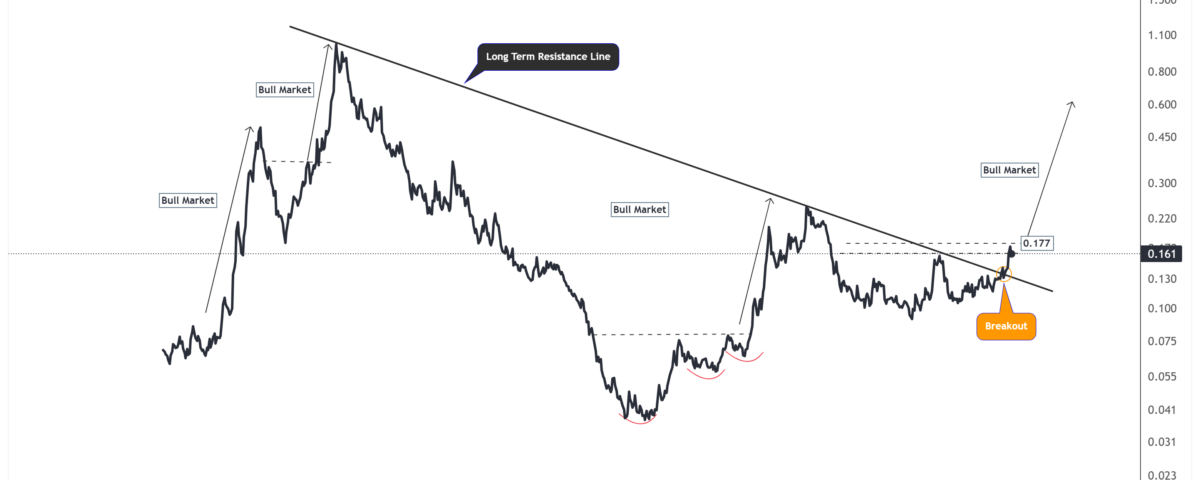
The chart below shows a long-term perspective using the Gold/NYSE Composite Index on the monthly time frame. This chart shows the ratio of gold prices to the NYSE Composite Index. Historically, this ratio has helped identify major turning points in the gold market.
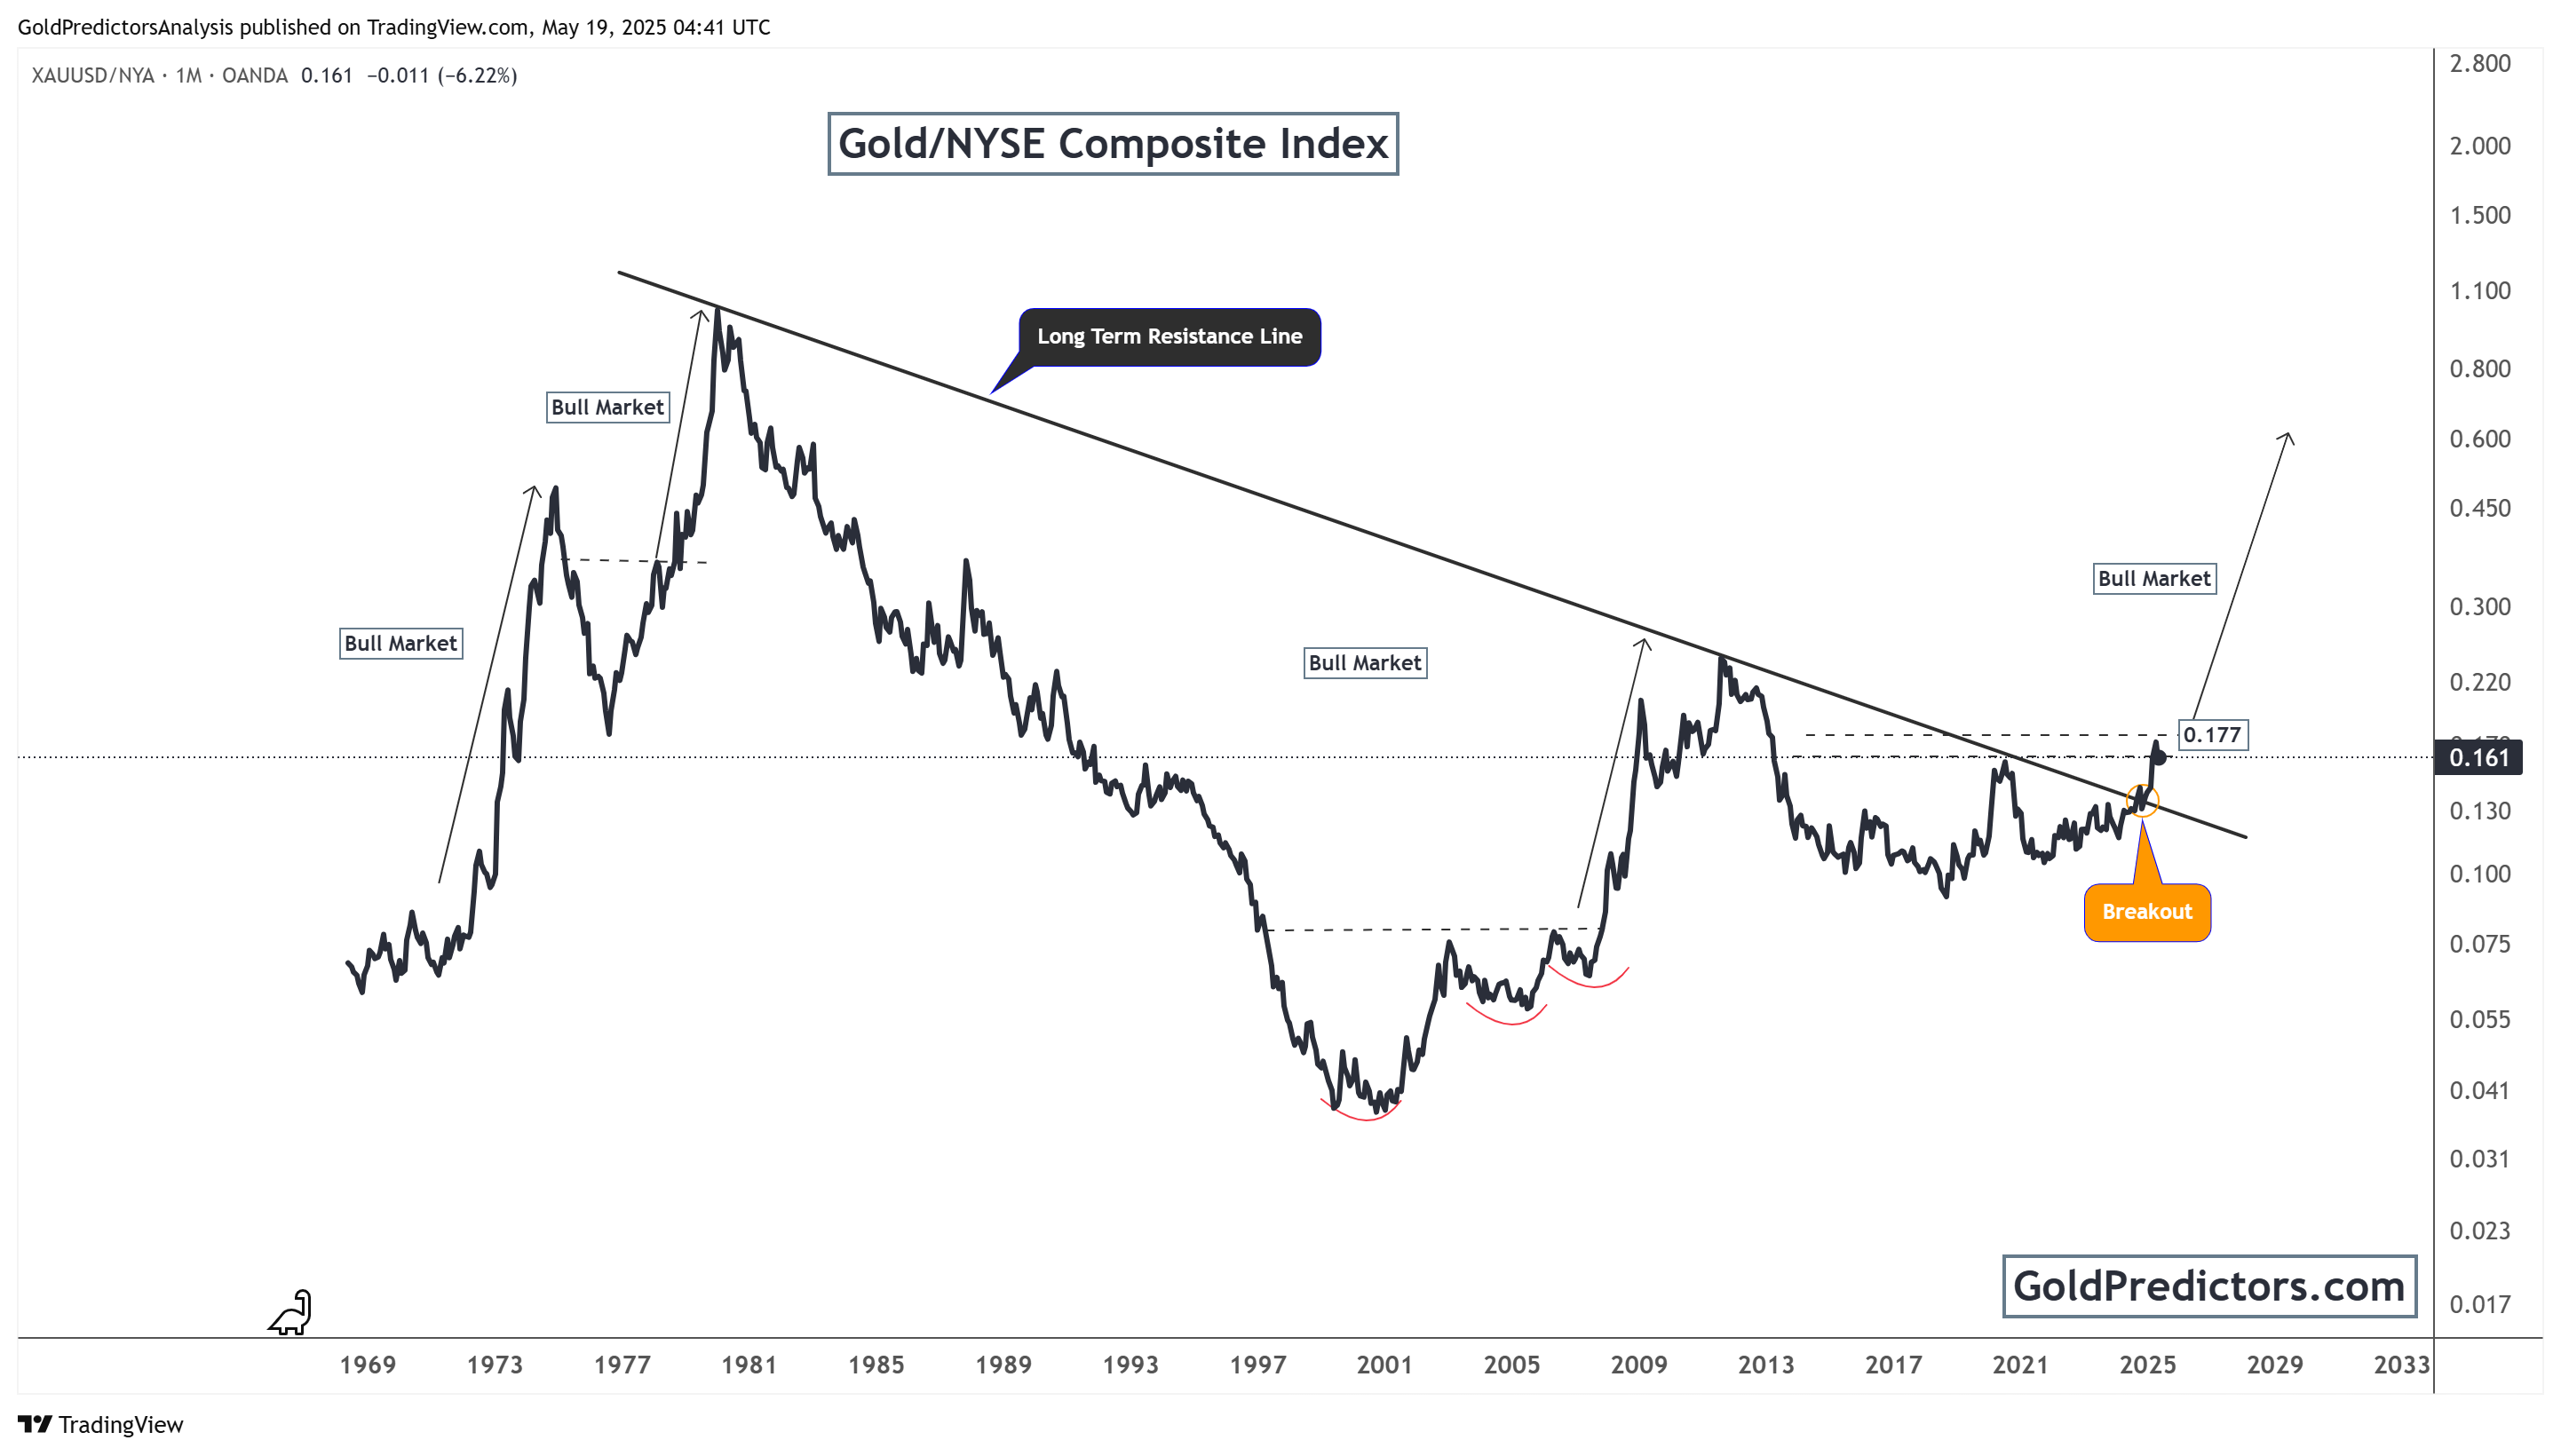
A significant technical event has just occurred. The chart shows that gold has broken out above a long-term resistance line that has capped prices for over four decades. This breakout is a strong bullish signal. It has historically preceded long-term gold bull markets, as seen in the 1970s, early 2000s, and post-2008 crisis periods.
The breakout occurred at the 0.177 level, a key horizontal resistance zone. This confirms a reversal of the long-term downtrend. The pattern suggests the beginning of a major structural shift in favour of gold over equities. Past breakouts of this nature have led to sustained multi-year rallies in gold prices.
Additionally, the chart features multiple bullish technical formations such as inverse head and shoulders and long-term support retests. All these signals strengthen the case for a strong bull market phase ahead. Investors with a long-term horizon may see this as a generational buying opportunity.
Gold Technical Setup Shows Bullish Momentum Across Short- and Long-Term Charts
Gold remains at a critical juncture. The descending channel on the daily chart indicates short-term consolidation and selling pressure. However, the recent rebound near key support levels, accompanied by increased buying interest, points to emerging strength. A confirmed breakout above the upper boundary of the channel could shift the near-term outlook to bullish.
More significantly, the breakout in the Gold/NYSE Composite Index ratio signals a potential long-term structural shift. This rare technical development has historically preceded multi-year bull markets in gold, making it a key indicator for long-term positioning.
Together, these patterns present a compelling technical case. Short-term traders should monitor the descending channel for a breakout confirmation, while long-term investors may already be witnessing the early stages of a new bullish cycle. Gold’s current setup offers strategic opportunities across multiple time horizons.
Gold Predictors Premium Membership
Get exclusive short-term and swing trade ideas with precise entry levels, stop-loss, and target prices, including justification and analysis — all delivered directly via WhatsApp.
Our premium service includes deep technical analysis on gold and silver markets. We cover cycle analysis, price forecasting, and key timing levels.
Members also receive a weekly market letter with detailed analysis, commentary from our Chief Analyst, including actionable insights, trade timing, and direction forecasts for gold and silver.
Stay ahead of the market — join our premium community today.


