Gold Price Surge Continues: Will $3,350 Resistance Break or Trigger Pullback? | Gold Predictors - Forecasting Gold Prices

New York

London

Sydney

Tokyo

Log In

  • Register
  • Lost your password?
gold predictorsgold predictorsgold predictorsgold predictors
  • HOME
  • ABOUT US
    • About Us
    • Social Networks
    • Industry Links
    • Testimonials
  • RESEARCH
    • Scientific Trade Strategies
    • Gold Hub
    • Gold Importance
    • Silver Importance
  • GOLD HUB
  • GOLD ANALYSIS
    • Gold Analysis
    • Technical Analysis
      • Trend Identification
      • Phase Identification
      • Important Levels
      • Volatility Measurement
    • Gold Cycle
      • Short Term Cycles
      • Medium Term Cycles
      • Long Term Cycles
    • Price Action Analysis
      • Phase Identification
      • Historical Pattern Identification
      • Candlestick Pattern Identification
    • Fundamental Analysis of Gold
    • Gold Related Markets Analysis
    • Gold Seasonal
  • TRADING METHODOLOGY
    • Gold Analysis
      • Technical Analysis
      • Gold Cycle
      • Price Action Strategy
      • Fundamental Analysis
      • Gold Related Markets Analysis
      • Gold Seasonal
    • Measure Signal Strength
      • Weak Signal
      • Strong Signal
      • Confirmed Signal
    • Trading Decision
    • Trading Rules
      • Basic Trading Rules
      • Gold Predictors Trading Rules
    • Trade Examples
    • Performance
  • LIVE CHARTS
  • MEMBERSHIPS
    • Free Membership
    • Premium Membership
    • SignUp
  • MEMBERS AREA
    • Free Article
    • Premium Article
    • Trading Signals
    • Long Term Signals
    • Forex Reports
    • Crypto Reports
  • FOREX REPORTS
  • HELP
    • FAQ
    • Contact Us
Login / Register

Gold Price Surge Continues: Will $3,350 Resistance Break or Trigger Pullback?

0
Published by admin at April 17, 2025
Categories
  • Free Articles
Tags
  • forex
  • gold
  • silver
  • US Dollar

The announcement of up to 245% tariffs on Chinese imports significantly escalates trade tensions and injects fresh uncertainty into global markets. This sharp move triggers fear across financial markets and increases safe-haven demand. Gold benefits from such geopolitical and economic instability. As investor sentiment turns risk-averse, capital flows into gold, increasing its price.

China’s restrictions on critical materials add another layer of concern. These elements are essential to global supply chains, especially defence, technology, and manufacturing. Disruptions in these sectors could heighten fears of a prolonged economic conflict. As a result, gold could see strong buying interest as a hedge against trade disruption, inflation, and broader market volatility. The overall impact of gold is bullish in the short to medium term.

Gold Price Reaches Wedge Resistance as Tariff Fears Intensify

The chart below confirms that gold has reached the $3,350 level, aligning perfectly with the upper boundary of the ascending broadening wedge. This target was projected in the 2022 analysis, which identified the breakout above the $2,075 pivot as the key trigger for a move into the $3,000–$3,200 range. With gold testing, the upper wedge resistance, this area becomes a critical inflection point. Rising tensions from the 245% U.S. tariff on China and rare earth supply concerns fueled this rally.

gold

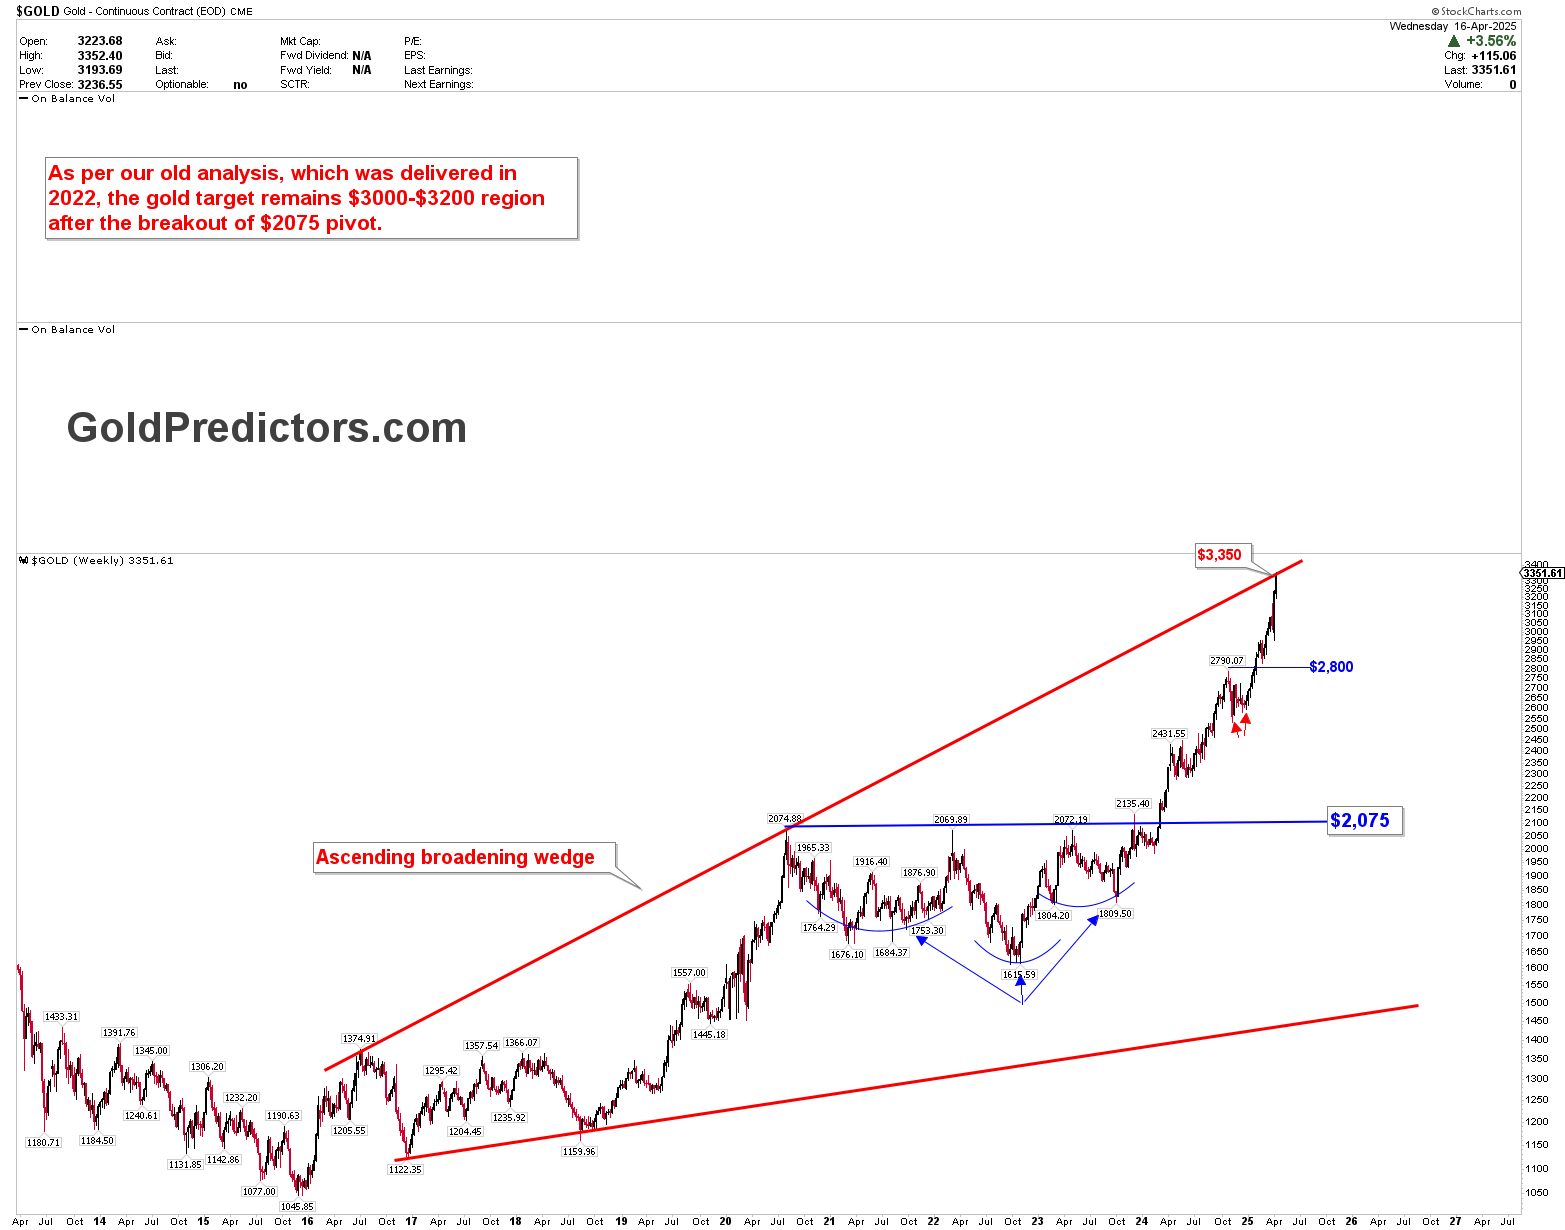
While gold remains supported by global risk aversion and strong liquidity, the $3,350 level may prompt some profit-taking. Historically, this technical wedge pattern can lead to a strong breakout or a corrective pullback. The bullish momentum may extend further if the price holds above $3,200. However, failing to break the wedge resistance could trigger a short-term correction. The following 72 hours will be crucial as market reactions to trade tensions and geopolitical shifts play out.

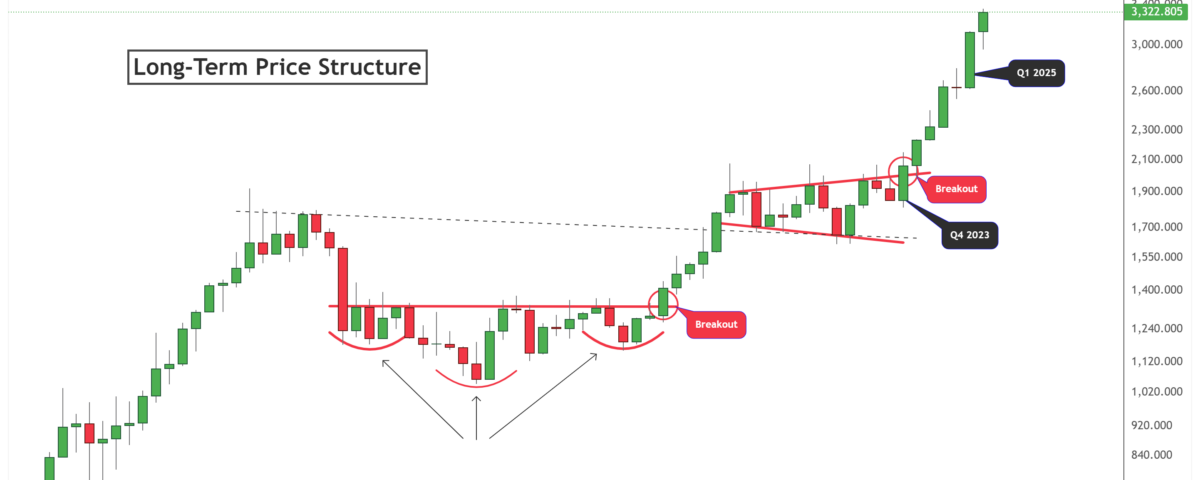
Long-Term Price Structure Supports the Gold Supercycle

The long-term chart below confirms that gold’s breakout in Q4 2023 began a structural shift. This breakout followed years of accumulation and pattern formation, including a multi-year cup and handle between 2013 and 2019. Gold steadily climbed once the price cleared the neckline and the upper trendline, pushing it above $3,300 in Q2 2025. This breakout validated the long-term bullish thesis during the $2,075 pivot breakout discussed in the previous section.

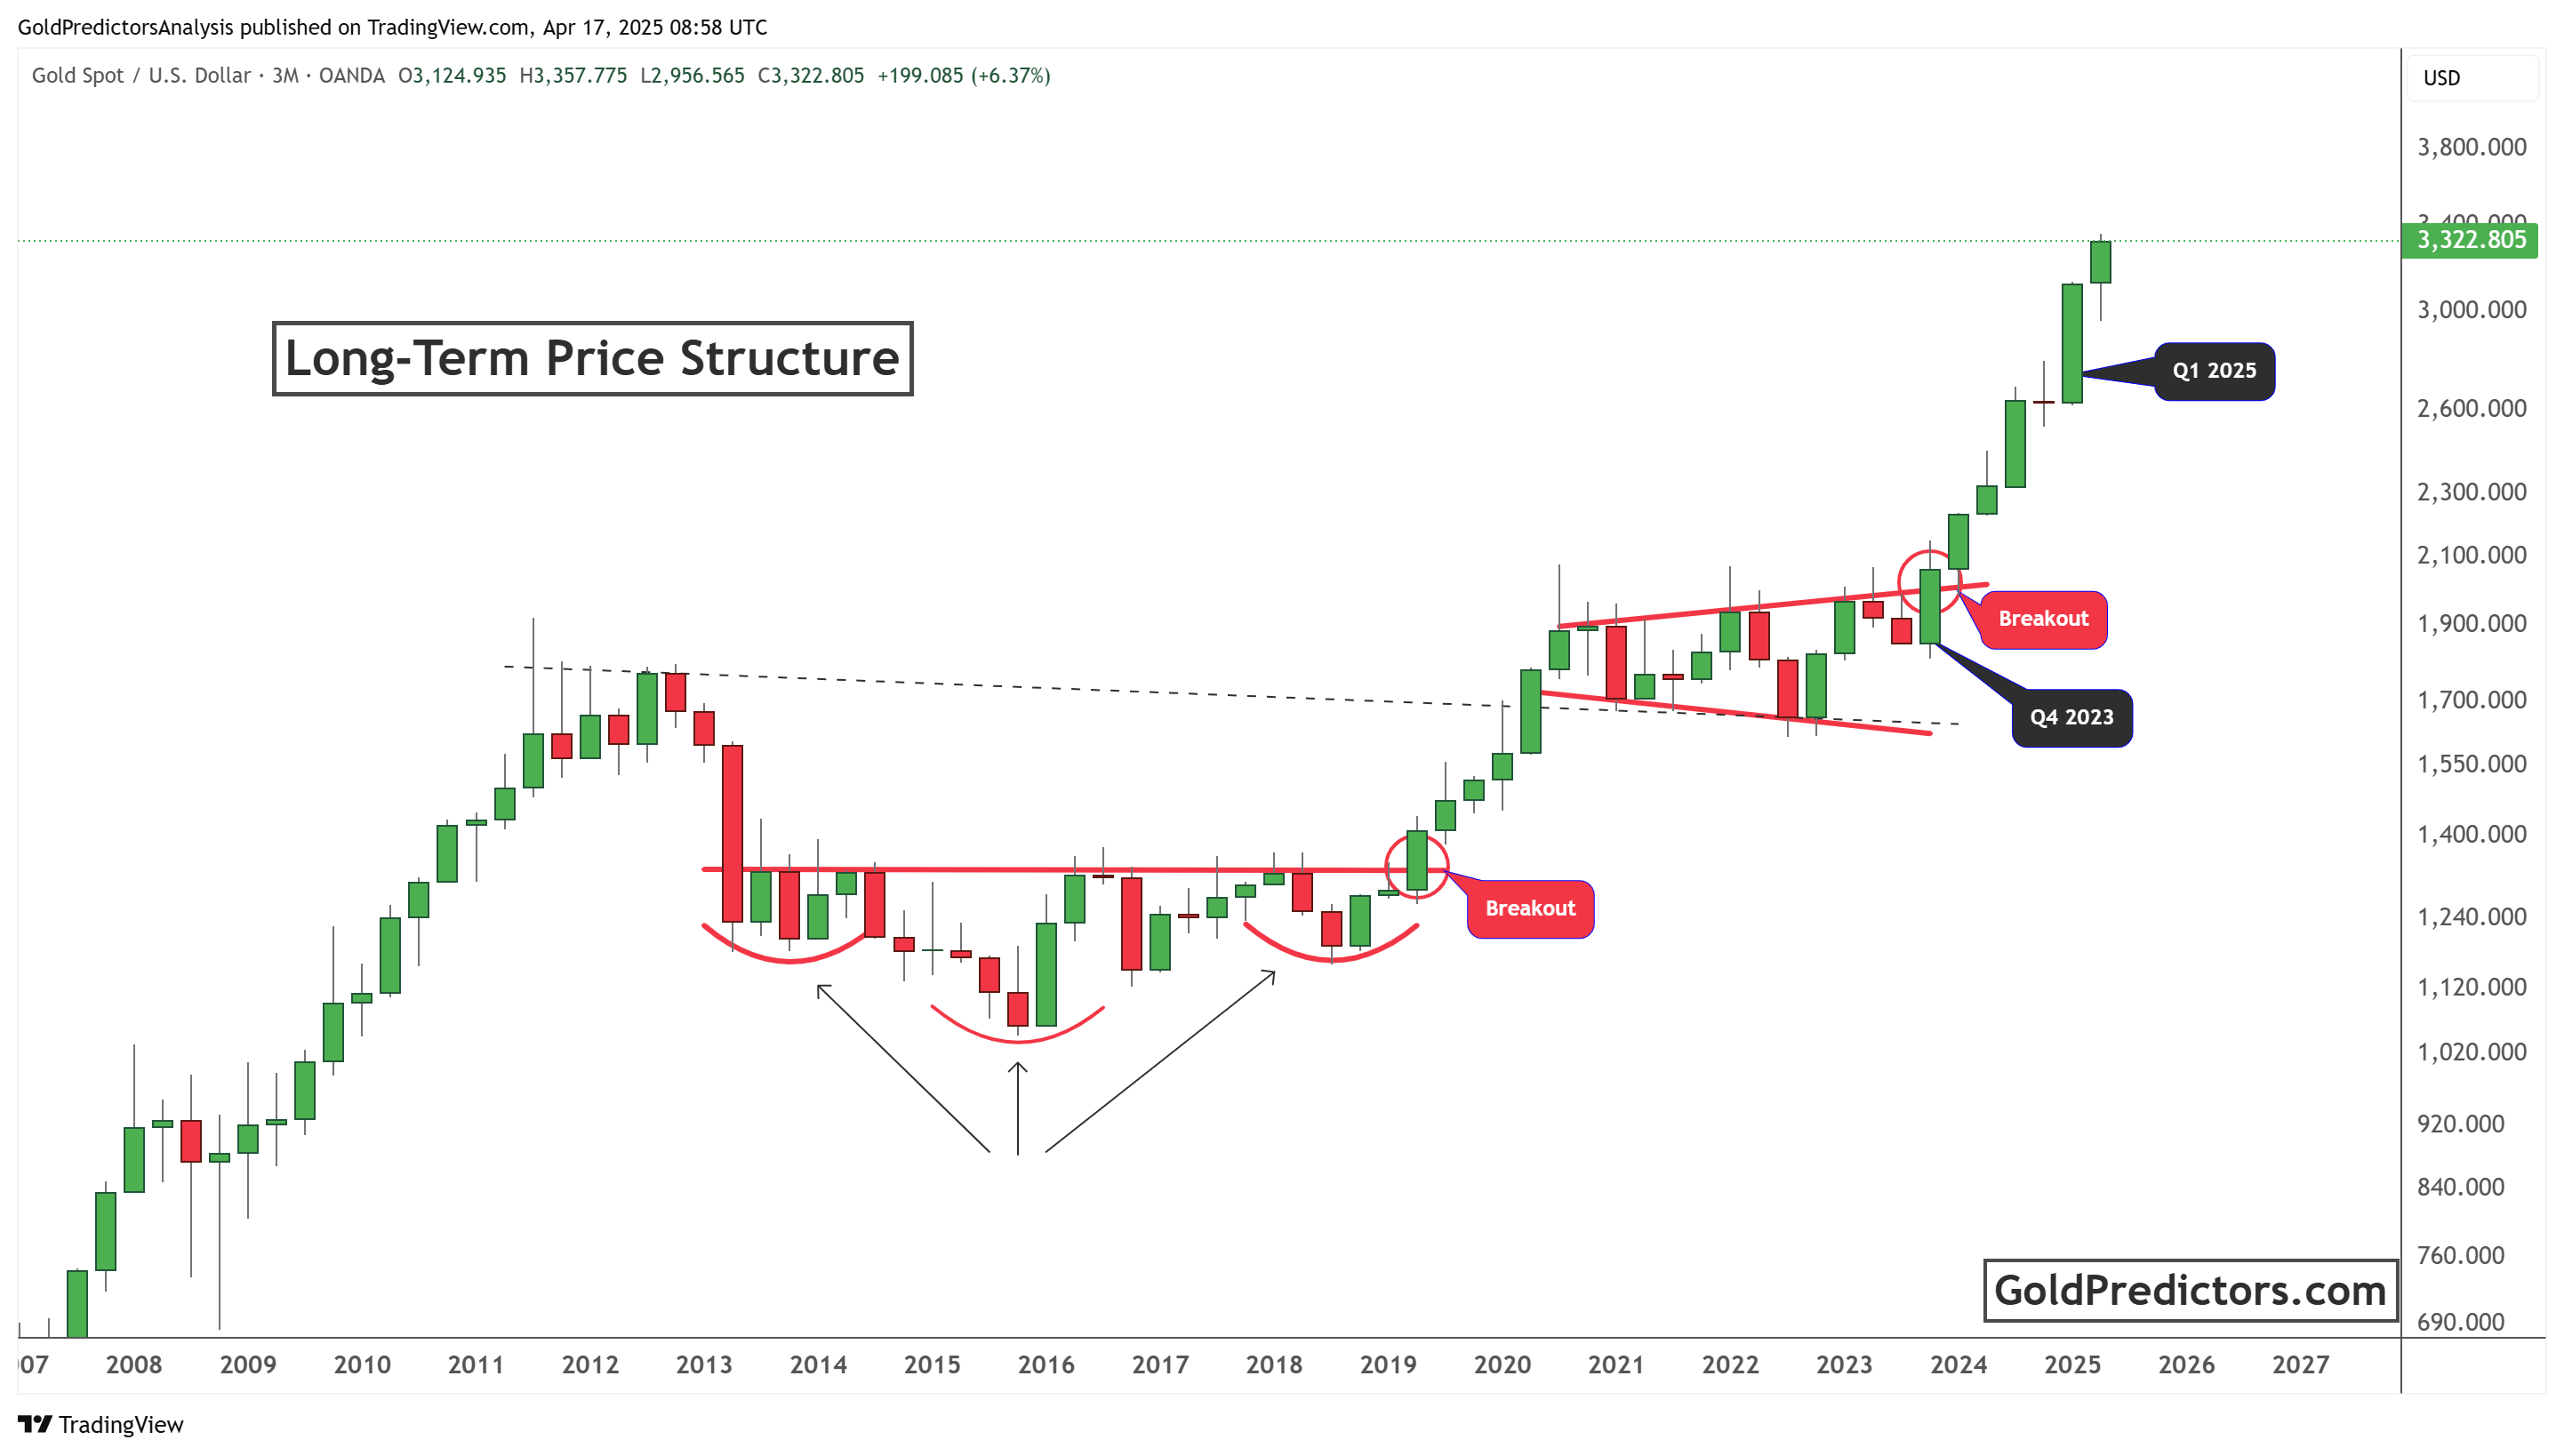
The move aligns with the ascending broadening wedge shown earlier and reinforces the potential for a continued supercycle. The current price action shows acceleration after the Q4 2023 breakout, with strong bullish candles indicating momentum. This pattern signals that gold is in a long-term parabolic phase, driven by global liquidity, trade tensions, and geopolitical uncertainty. As long as the price holds above former resistance zones, significantly in the $2,800 and $3,000 regions, the structure remains intact, and the bullish trend will likely continue.

Bottom Line

Gold benefits from rising global uncertainty, aggressive trade policies, and strong technical momentum. The breakout above key resistance levels, including the $2,075 pivot and the Q4 2023 structure, confirms a long-term bullish trend. With the price now testing the $3,350 level, gold remains well-positioned within a broader supercycle. As long as global trade tensions and liquidity pressures persist, gold will likely attract strong safe-haven demand and maintain upward momentum. If the gold price continues to correct from the $3,350 resistance, it may offer a strong buying opportunity for traders ahead of the next upward wave.

Latest Post

Free Articles

Gold Surge Above $3,400 Amid Iran-Israel Conflict

Gold surge above $3,400 on rising tensions Iran-Israel conflict, driven by an ascending channel and a cup-and-handle pattern …
Read More
June 13, 2025 / admin
Scientific Trade Strategies

Gold (XAUUSD) Swing Trade Case Study: How $1996 Became a Major Buy Zone

Gold (XAUUSD) offers potential trading opportunities for both traders and investors when executed based on …
Read More
June 8, 2025 / admin
Free Articles

Gold Builds Bullish Momentum as Long-Term Patterns Point To $6,000

Gold begins bull cycle in 2025, backed by strong patterns. With prices near $3,323 and …
Read More
June 3, 2025 / admin
Free ArticlesLong Term SignalsMarket Research Lab

Gold Predictors Celebrates 9 Years: Premium Gold and Silver Analysis with Special Offer

Gold Predictors has marked its 9th anniversary in April 2025 …
Read More
May 28, 2025 / admin
Free Articles

Gold Price Forecast: Technical and Inflation-Adjusted Breakouts Signal Bull Market

Gold has broken decades inflation-adjusted resistance, signaling a bull market. Technical and macro trends show …
Read More
May 27, 2025 / admin
Free Articles

Silver Price Poised for Major Surge as Long-Term Patterns Align

Silver has broken out of a long-term triangle and is rising within an ascending channel—strong …
Read More
May 23, 2025 / admin
Become a Premium Member

Related posts

gold pattern
June 13, 2025

Gold Surge Above $3,400 Amid Iran-Israel Conflict


Read more
gold pattern
June 3, 2025

Gold Builds Bullish Momentum as Long-Term Patterns Point To $6,000


Read more

9th

May 28, 2025

Gold Predictors Celebrates 9 Years: Premium Gold and Silver Analysis with Special Offer


Read more

Comments are closed.

ABOUT US

  • About Us
  • Social Networks
  • Industry Links
  • Testimonials
  • Terms & Conditions

TECHNICAL ANALYSIS

  • Technical Analysis
  • Trend Identification
  • Phase Identification
  • Important Levels
  • Volatility Measurement

CYCLE ANALYSIS

  • Gold Cycle
  • Short Term Cycles
  • Medium Term Cycles
  • Long Term Cycles

PRICE ACTION ANALYSIS

  • Price Action Analysis
  • Phase Identification
  • Historical Pattern Identification
  • Candlestick Pattern Identification
© 2017 Gold Predictors. All Rights Reserved.
  • Remember Me
    Lost your password?
    Dont have an account?Sign Up