


Gold Price Breaks Decades-Long Channel as XAUUSD Enters New Bull Market
Gold (XAUUSD) has broken out of a decades-long ascending channel, signaling a major shift in its long-term trend. This breakout ends a multi-year consolidation phase and marks the beginning of a powerful new rally. The move followed a large technical pattern and triggered a sharp vertical surge. At the same time, the gold‑to‑Dow ratio also turned higher, pointing to a clear rotation away from equities. These developments point to a structural change in financial markets and highlight gold’s renewed role as a core asset in the global system.
Gold Enters New Uptrend after Breaking Out of Decades-Long Channel
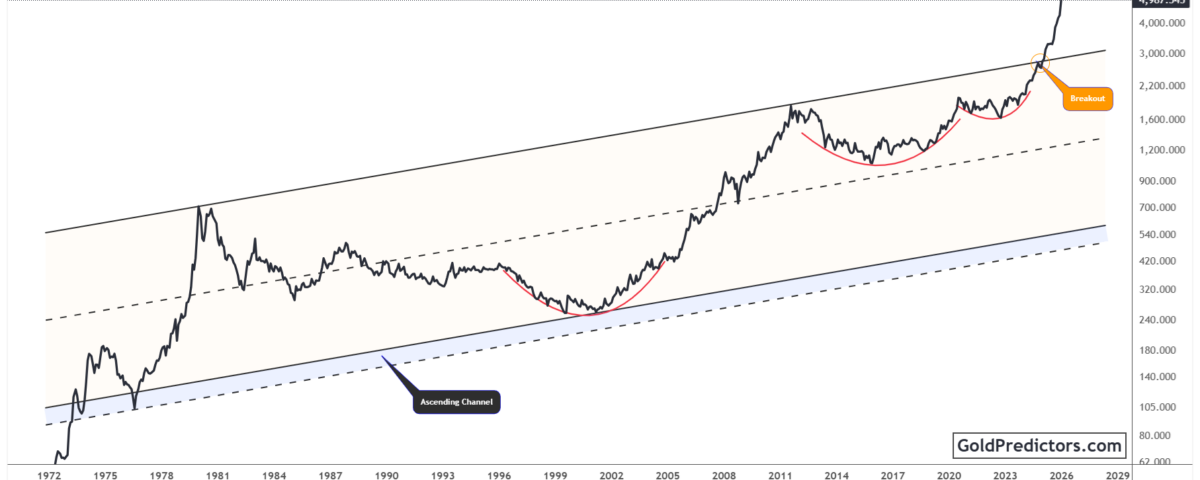
The gold chart below shows a long-term ascending channel that has guided price action for over five decades. This long-term structure supported gold through several major macro cycles, including the 2011 high and the extended consolidation that followed. Each correction found support near key levels, forming rounded bases that sustained the broader uptrend.
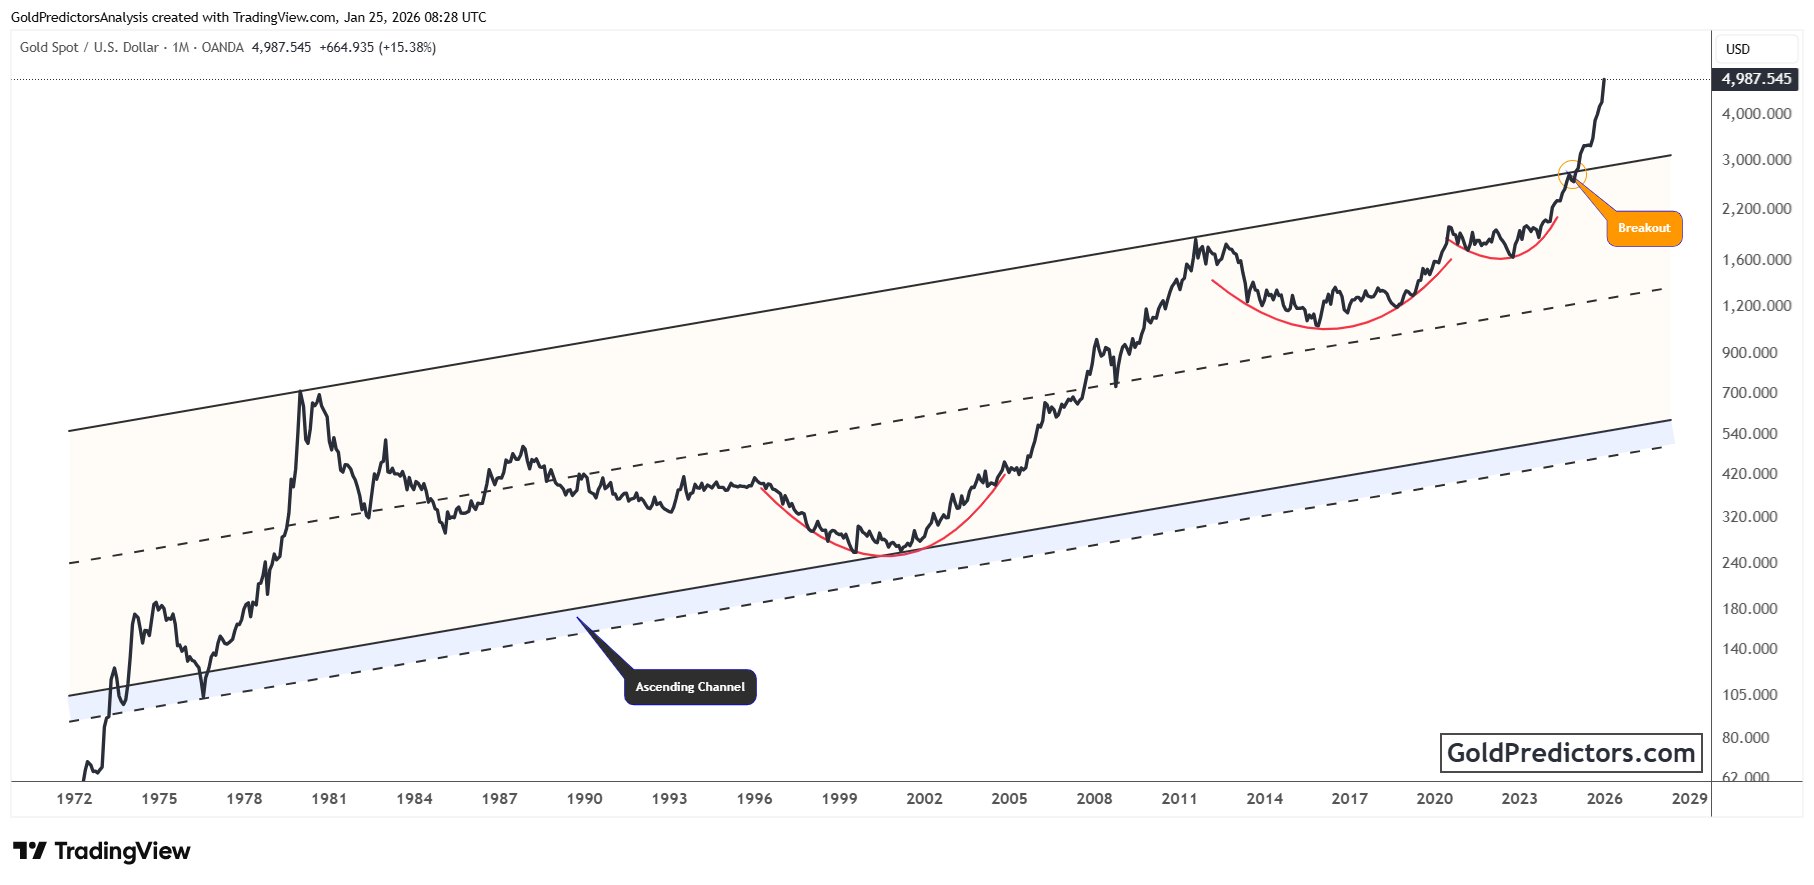
In early 2025, gold decisively broke above the channel’s upper boundary after forming a large cup-and-handle pattern. This breakout occurred after multiple resistance tests and confirmed the end of a multi-decade consolidation. The move triggered a powerful rally, driving gold to its strongest levels in decades. Momentum and volume indicators likely confirm the strength of this breakout, suggesting a lasting transition from range-bound movement to sustained price expansion.
Importantly, the breakout area now serves as a key support level in the current trend. Its validation confirms the structural shift and implies that further gains may follow, especially as global macro conditions continue to favor hard assets. The steep rally in 2025 reflects previous periods of rapid gains, pointing to a new phase of long-term strength in gold.
Gold Set to Outperform Stocks as Ratio Breaks Historical Pattern
The chart below shows the long-term Gold-to-Dow Jones Industrial Average ratio, revealing a repeating pattern of gold outperformance during key turning points. The ratio followed a broadening wedge structure, forming lower highs and lower lows before bottoming near the lower boundary. Each time it reached this support zone, the ratio reversed sharply, marking the beginning of a strong phase where gold outperformed equities.
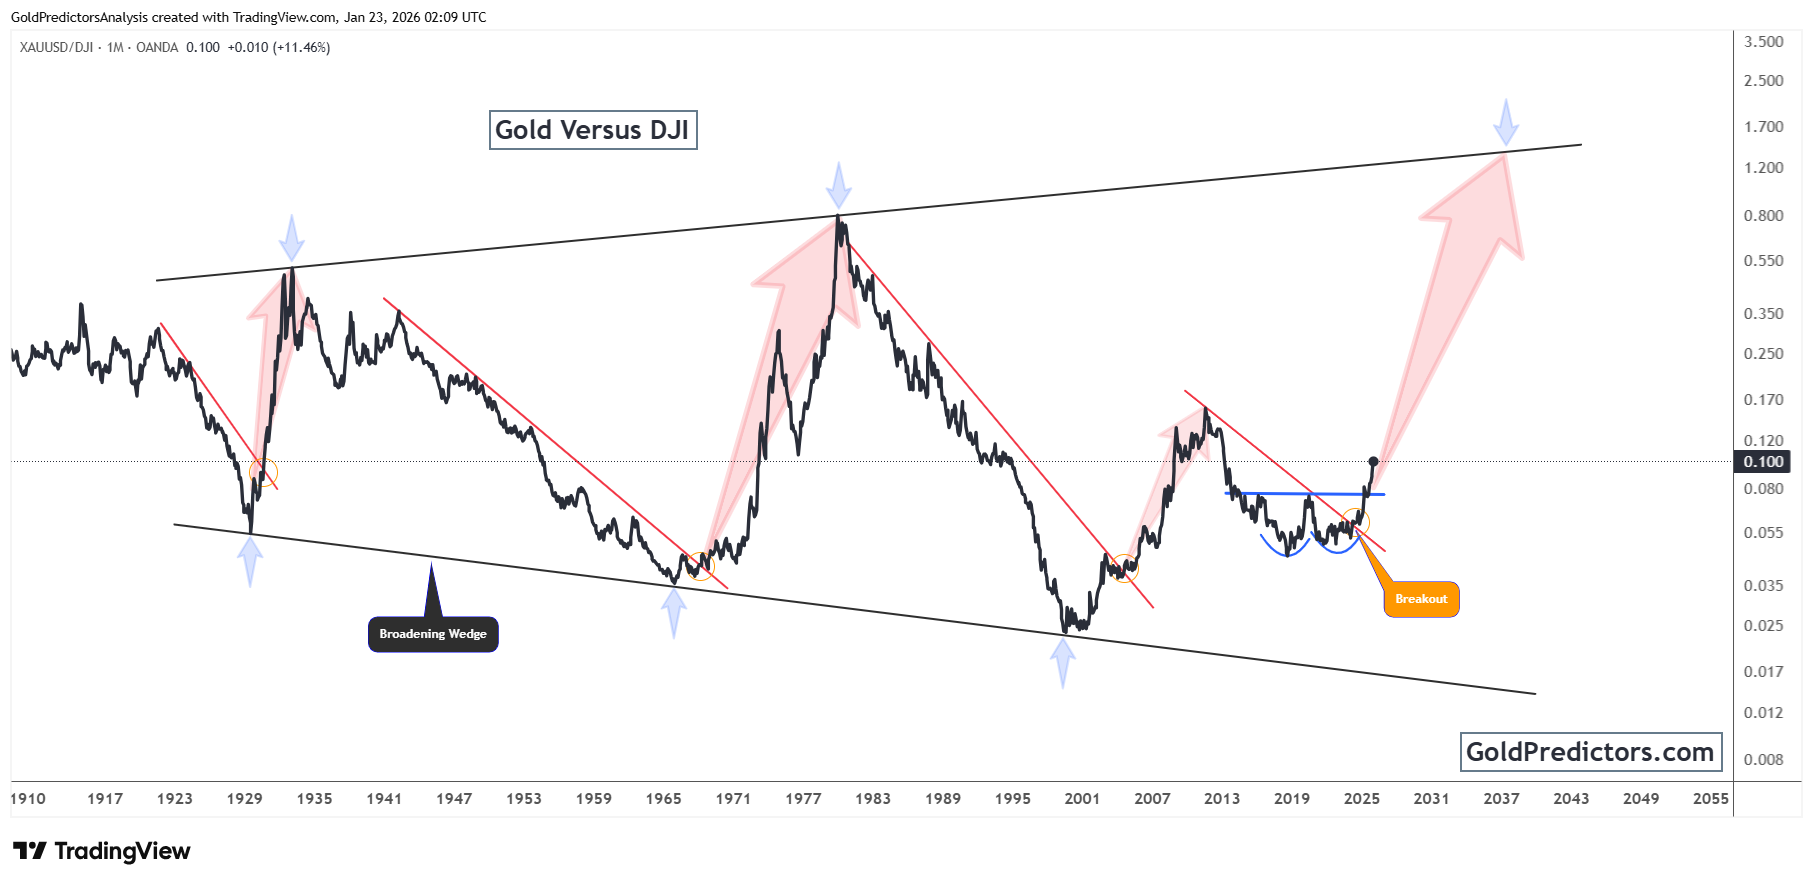
Recent price action shows a clear breakout from the long-standing downtrend line, following a multi-year rounded base. The breakout is confirmed by a clean move above neckline resistance and strong upward momentum, similar to previous reversal patterns. This breakout suggests a significant shift in capital flow, where gold could once again begin outperforming the Dow over the coming years.
If the historical pattern repeats, the ratio may rise toward the upper boundary of the broadening wedge, implying strong relative strength in gold. Past moves from similar breakout points have resulted in steep, multi-year rallies. The current setup mirrors those earlier periods and indicates that gold may be entering a new long-term cycle of outperformance against equities.
Conclusion: Gold Enters Structural Bull Market after Historic Breakout and Ratio Shift
Gold has broken out of a decades-long channel, signaling a historic shift in trend. The move confirms the end of a prolonged consolidation phase and marks the beginning of a powerful new advance. With momentum building and macro conditions turning favorable, gold is now entering a structural bull market. This breakout sets the stage for a multi-year period of sustained upside.
At the same time, the gold-to-Dow ratio has broken out of a multi-year downtrend line, signaling renewed rotation out of equities and into real assets. This ratio has reversed from key support and shows early signs of a sustained uptrend. If the pattern continues, gold could outperform stocks over the coming years, restoring its role as a core store of value during periods of market stress.
These developments point to a broader revaluation of gold’s position in global markets. With technical breakouts confirmed and macro conditions aligned, gold appears poised for continued outperformance in the years ahead. This turning point signals the start of a new cycle characterized by long-term growth and rising strategic demand for gold.
Gold Predictors Premium Membership
Get exclusive short-term and swing trade ideas with precise entry levels, stop-loss, and target prices, including justification and analysis — all delivered directly via WhatsApp.
Our premium service includes deep technical analysis on gold and silver markets. We cover cycle analysis, price forecasting, and key timing levels.
Members also receive a weekly market letter with detailed analysis, commentary from our Chief Analyst, including actionable insights, trade timing, and direction forecasts for gold and silver.
Stay ahead of the market — join our premium community today.


