Gold Price Analysis: XAU/USD Pulls Back from Channel Resistance as Gold vs Microsoft Ratio Breaks Out
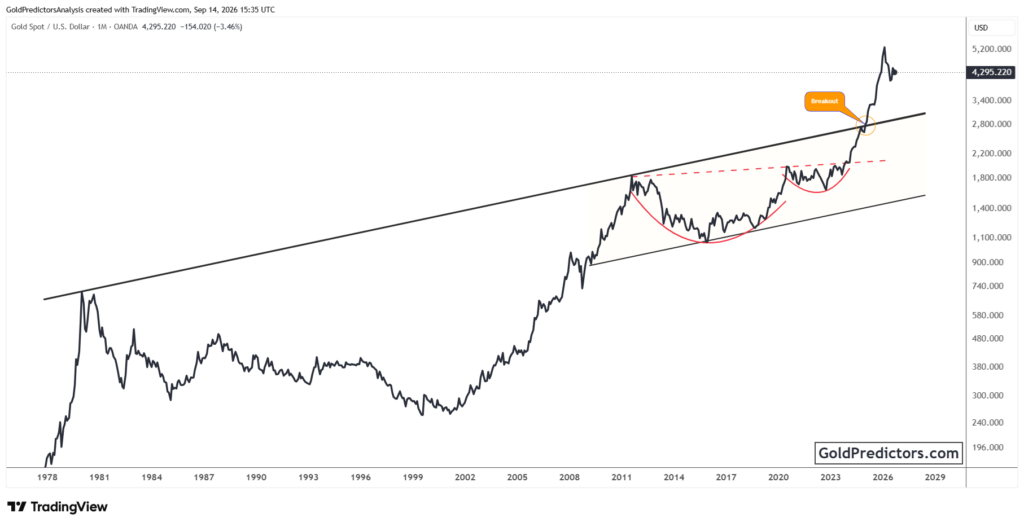
Gold (XAUUSD) prices have eased after reaching a major long-term resistance level. The metal recently broke above triangle resistance before rallying toward the upper boundary of a multi-decade ascending channel. The current pullback reflects a pause after the advance, while the broader long-term bullish structure remains intact. At the same time, the Gold versus Microsoft ratio has broken above a long-term triangle pattern and is now pulling back after the breakout, signaling a potential shift in relative strength. These technical developments highlight important long-term structures that could determine gold’s next major direction.
Gold Technical Analysis: XAU/USD Pulls Back from Multi-Decade Channel Resistance
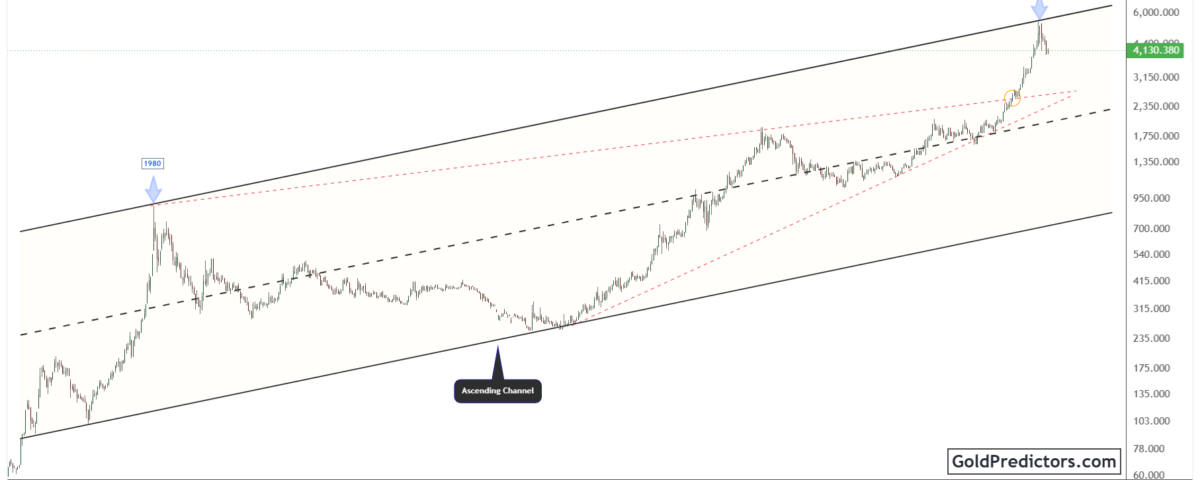
The gold chart below shows a long-term ascending channel that has guided price action for more than five decades. The lower boundary has consistently provided support during major corrections, while the upper boundary has acted as resistance during previous market cycles. Price has repeatedly respected both boundaries, highlighting the strength of this long-term trend structure.
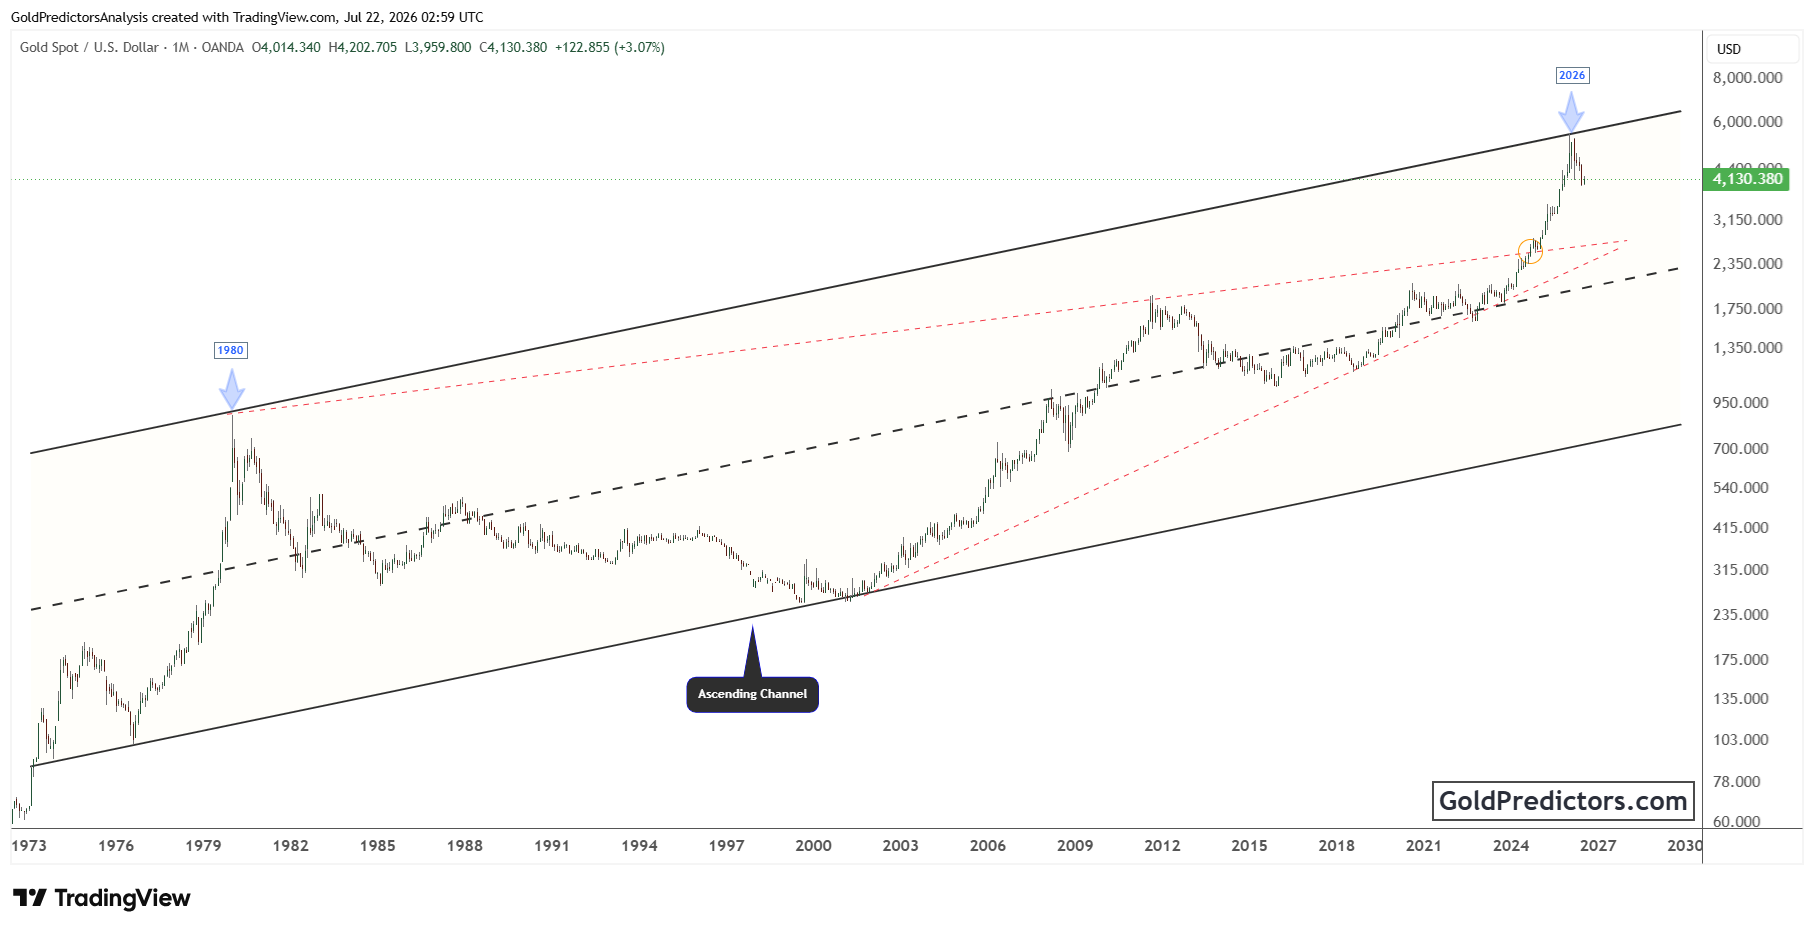
The chart also shows how gold moved between the channel boundaries throughout different periods. After reaching the upper boundary in 1980, gold entered an extended consolidation phase before finding support near the lower boundary. The recovery from the early 2000s strengthened the upward structure as price continued to advance within the ascending channel.
Gold recently broke above the triangle resistance and rallied toward the upper boundary of the long-term ascending channel. Price reached this major technical resistance, where previous market cycles also marked important turning points, before facing rejection. The recent pullback reflects a pause after the breakout and strong advance. As long as the broader structure remains intact, the long-term outlook stays constructive. However, a deeper decline could lead to a more extended correction within the channel.
Gold vs Microsoft Ratio Breaks above Long-Term Triangle Resistance
The chart below shows the Gold versus Microsoft ratio trading within a long-term triangle pattern that has guided price action for several decades. The descending resistance trendline has limited every major recovery over the years. At the same time, the horizontal support has consistently held during previous pullbacks, confirming it as a key support area. This structure has kept the broader trend under pressure for many years.
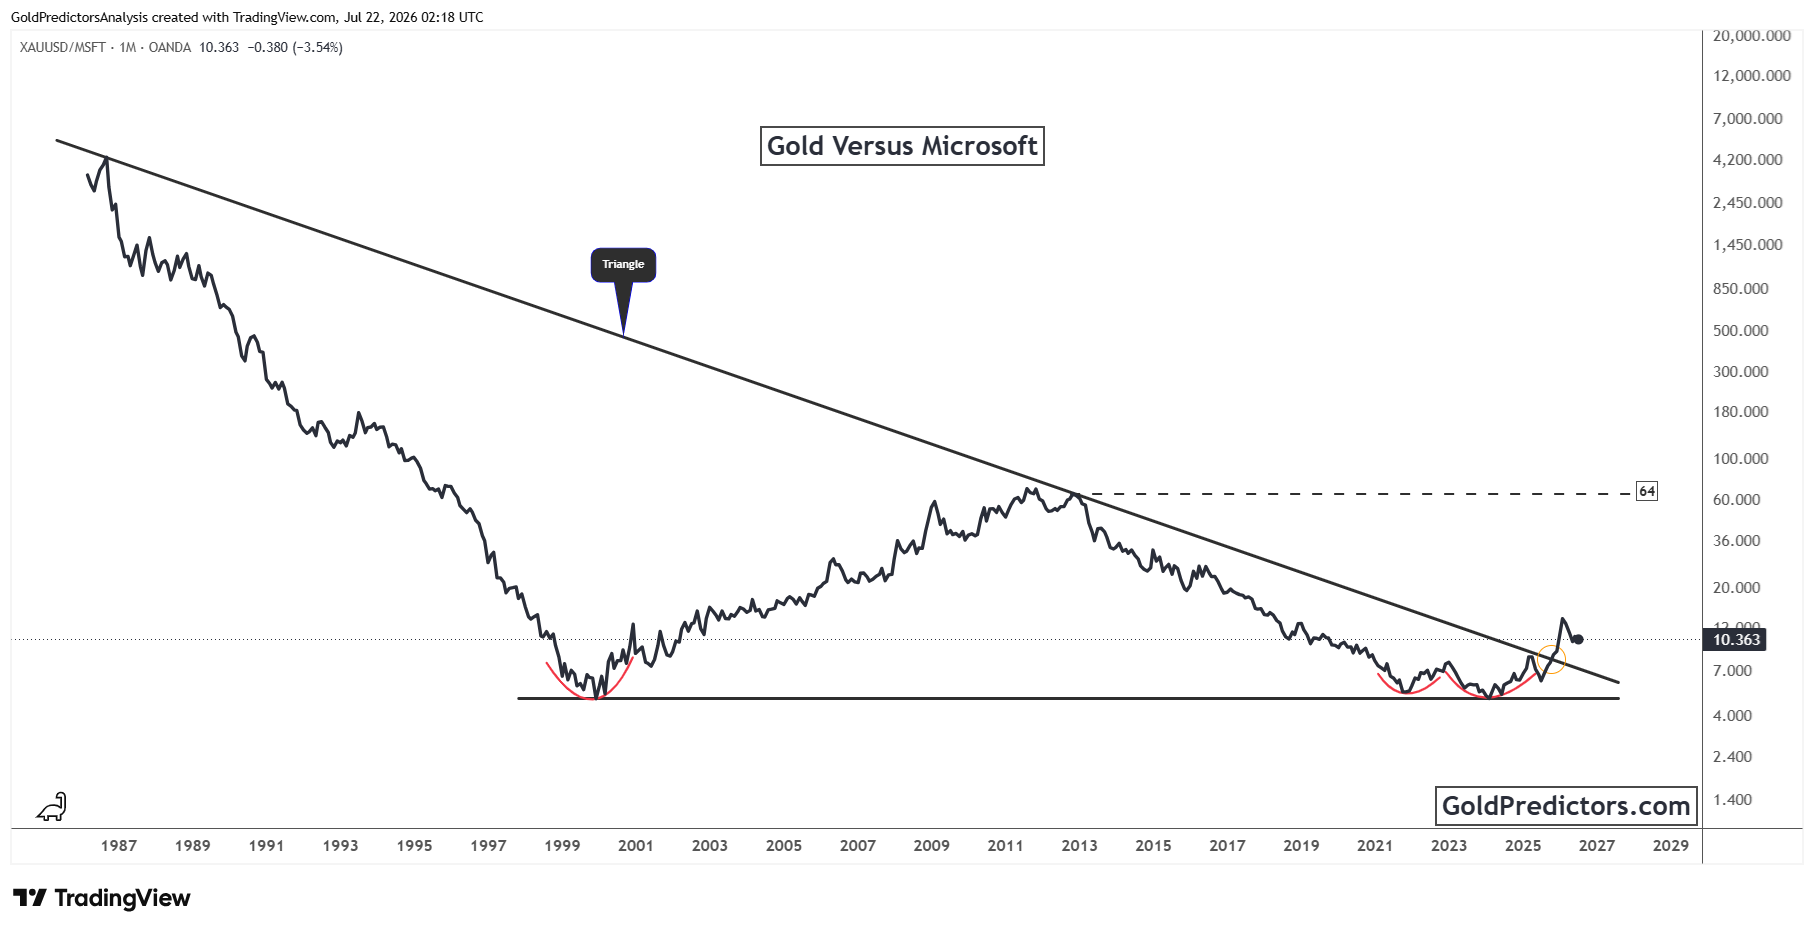
The ratio recently moved higher after another test of the horizontal support and briefly traded above the descending resistance trendline. The ratio has since pulled back but remains above the breakout zone. The former resistance trendline may now act as support if the ratio remains above it. Holding this level could strengthen the broader technical structure, while a move back below the trendline would weaken the breakout.
The current move has shifted attention to whether Gold can begin to outperform Microsoft after many years of relative weakness. Sustained strength above the former resistance could indicate that the long-term technical structure is starting to change. Until stronger confirmation develops, the recent breakout should be viewed as an early signal rather than a completed trend reversal.
Gold Outlook: Long-Term Bullish Trend Holds as Gold vs Microsoft Ratio Breaks Out
Gold remains in a strong long-term uptrend despite the recent pullback from multi-decade channel resistance. The breakout above the long-term triangle continues to support the broader technical structure. The current decline appears to be a pause after a strong advance rather than a reversal. The long-term technical outlook remains positive despite the current correction.
At the same time, the Gold versus Microsoft ratio is showing early signs of a potential long-term shift. The ratio recently moved above the descending resistance trendline before pulling back, but it remains above the breakout zone. This suggests that gold may begin to improve its relative performance against Microsoft. However, the breakout still requires stronger confirmation before a sustained trend reversal can be established.
Overall, both charts point to important long-term technical developments. Gold continues to hold its broader bullish structure, while the Gold versus Microsoft ratio is showing early signs of improving relative strength. The coming months will be important in confirming whether these breakouts can support the next phase of the long-term trend.
Gold Predictors Premium Membership
Get exclusive short-term and swing trade ideas with precise entry levels, stop-loss, and target prices, including justification and analysis — all delivered directly via WhatsApp.
Our premium service includes deep technical analysis on gold and silver markets. We cover cycle analysis, price forecasting, and key timing levels.
Members also receive a weekly market letter with detailed analysis, commentary from our Chief Analyst, including actionable insights, trade timing, and direction forecasts for gold and silver.
Stay ahead of the market — join our premium community today.