


Gold Looks to Find Support for a $4,000 Target
Gold (XAUUSD) has broken out of a long-term ascending channel and surged past the key $3,000-$3,200 resistance level. This breakout ended years of steady consolidation and signalled strong bullish momentum. Rising geopolitical tensions and renewed investor demand supported the move. A cup-and-handle pattern, forming since 2011, further confirms this upward trend. Gold’s breakout above $2,100 in 2024 triggered a sharp rally, with a potential target of $3,500. However, the consolidation in the $3,000 to $3,500 region indicates further upside to $4,000.
Gold Breaks Out of Long-Term Ascending Channel
The gold chart below presents a weekly view from 2018 to mid-2025, highlighting a well-defined ascending channel. This channel provided consistent upward momentum, with gold rising from below $1,200 to over $3,300. Each time the price approached the lower trendline, it bounced upward, confirming support. Likewise, the upper trendline consistently acted as resistance, creating a stable upward channel over several years.
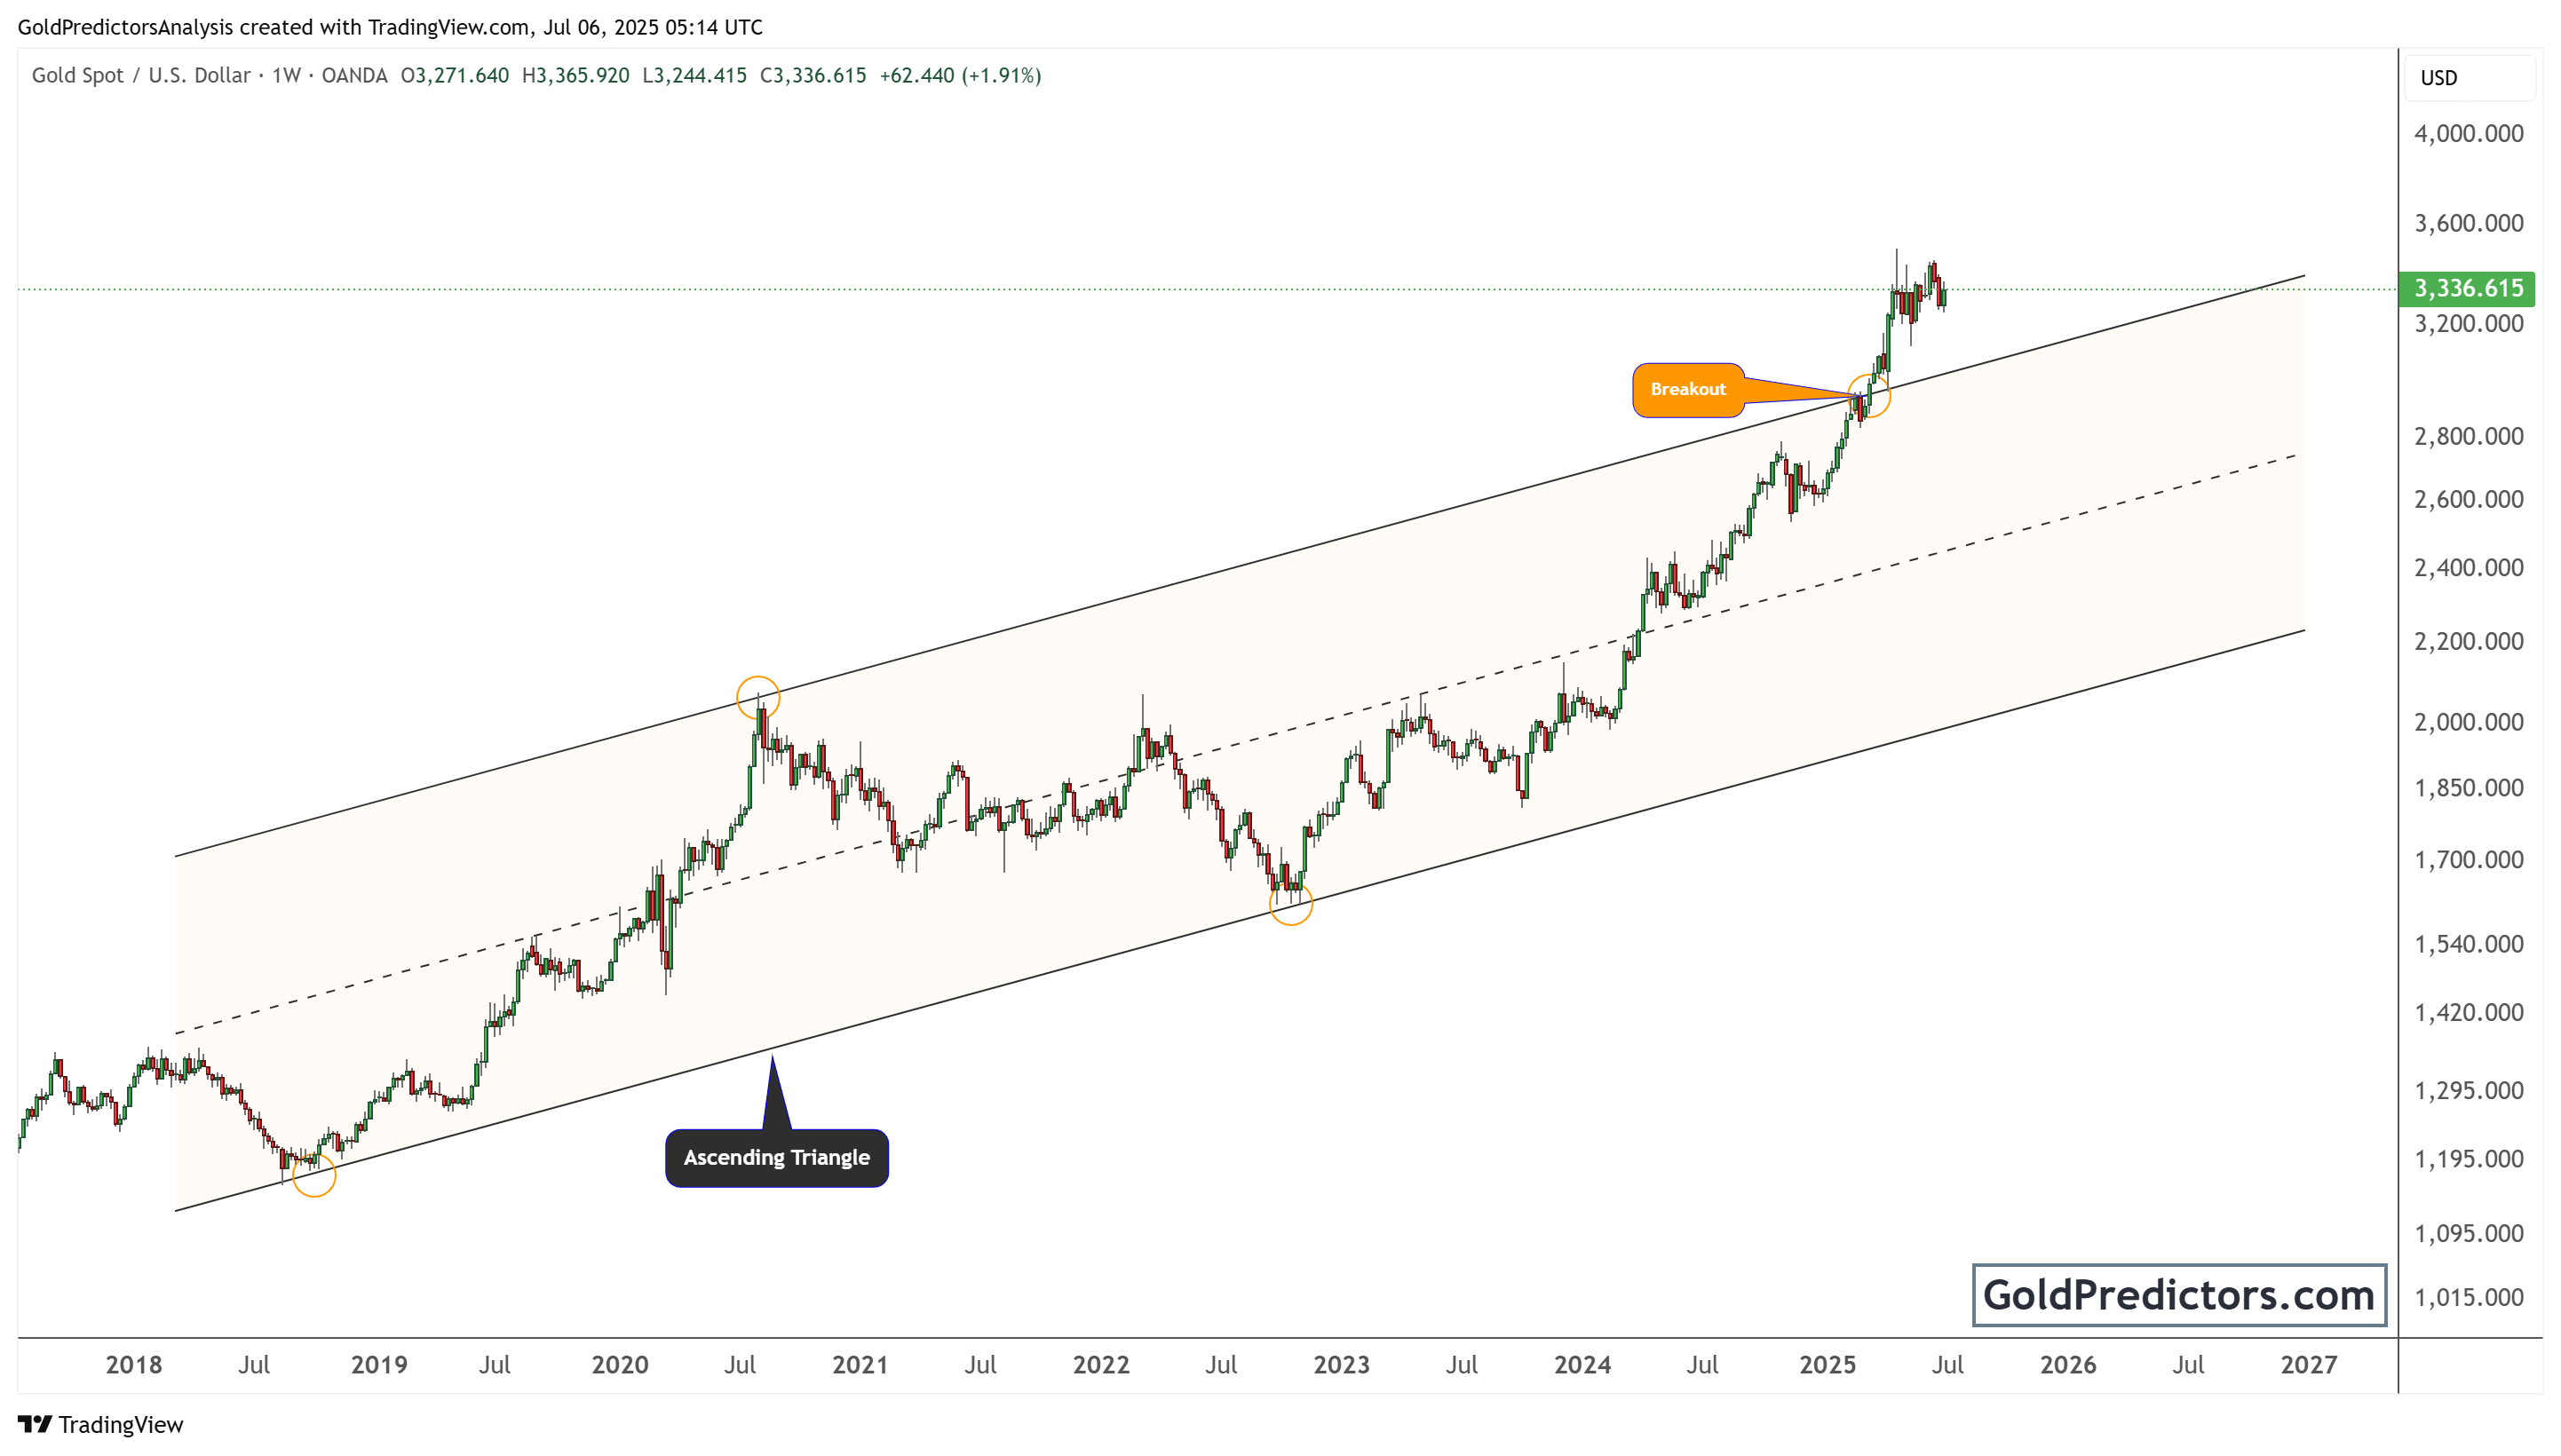
In early 2025, gold broke through the upper resistance of this channel, signalling a significant bullish breakout. This event marked the end of a long consolidation period and suggested renewed upward momentum. The price climbed decisively to $3,500, driven by increased buying interest and rising geopolitical uncertainties. This breakout was an early signal that gold was entering a more aggressive phase of its long-term trend.
Leading up to the breakout, gold had formed an ascending triangle near the channel’s midline, indicating accumulation and strength. This pattern served as a launching point, providing gold with the momentum needed to overcome resistance. Since the breakout, gold has maintained a position above the upper trendline and is now consolidating in a range above $3,300. This development confirms that the gold market has entered a new phase of heightened volatility and potentially faster price appreciation. A correction back to the ascending channel support at $3,000 will be considered as a strong buying opportunity for investors.
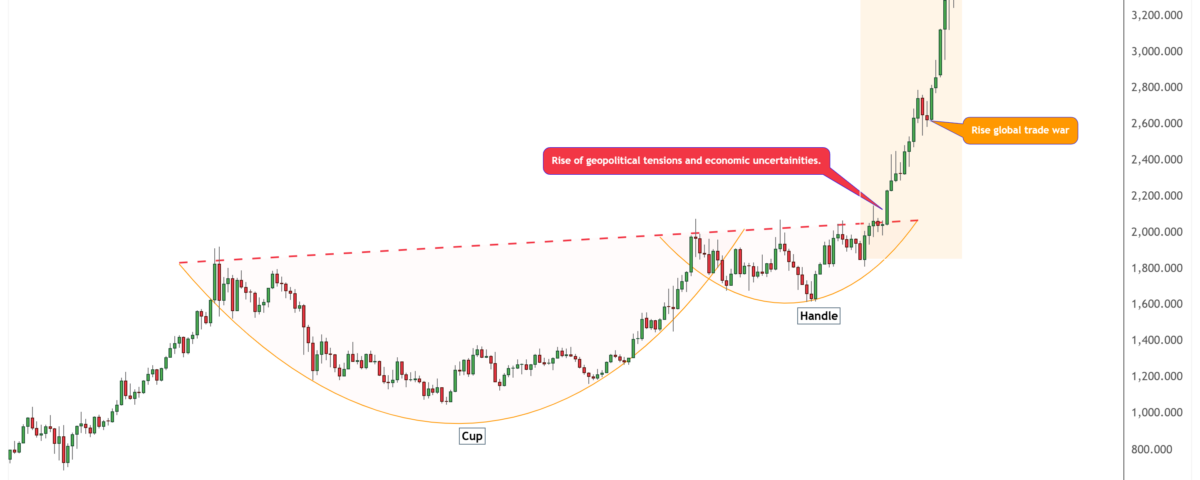
Cup and Handle Breakout Fuels Gold Rally toward $4,000 Price Target
The gold chart below shows monthly data from 2008 to 2025, presenting a clearer picture of a long-term bullish setup. It reveals a classic “cup and handle” pattern that has taken shape over more than a decade. The cup was formed between 2011 and 2020, followed by the handle from 2020 to 2023. This formation is a bullish continuation pattern, which signals the start of a strong upward trend.
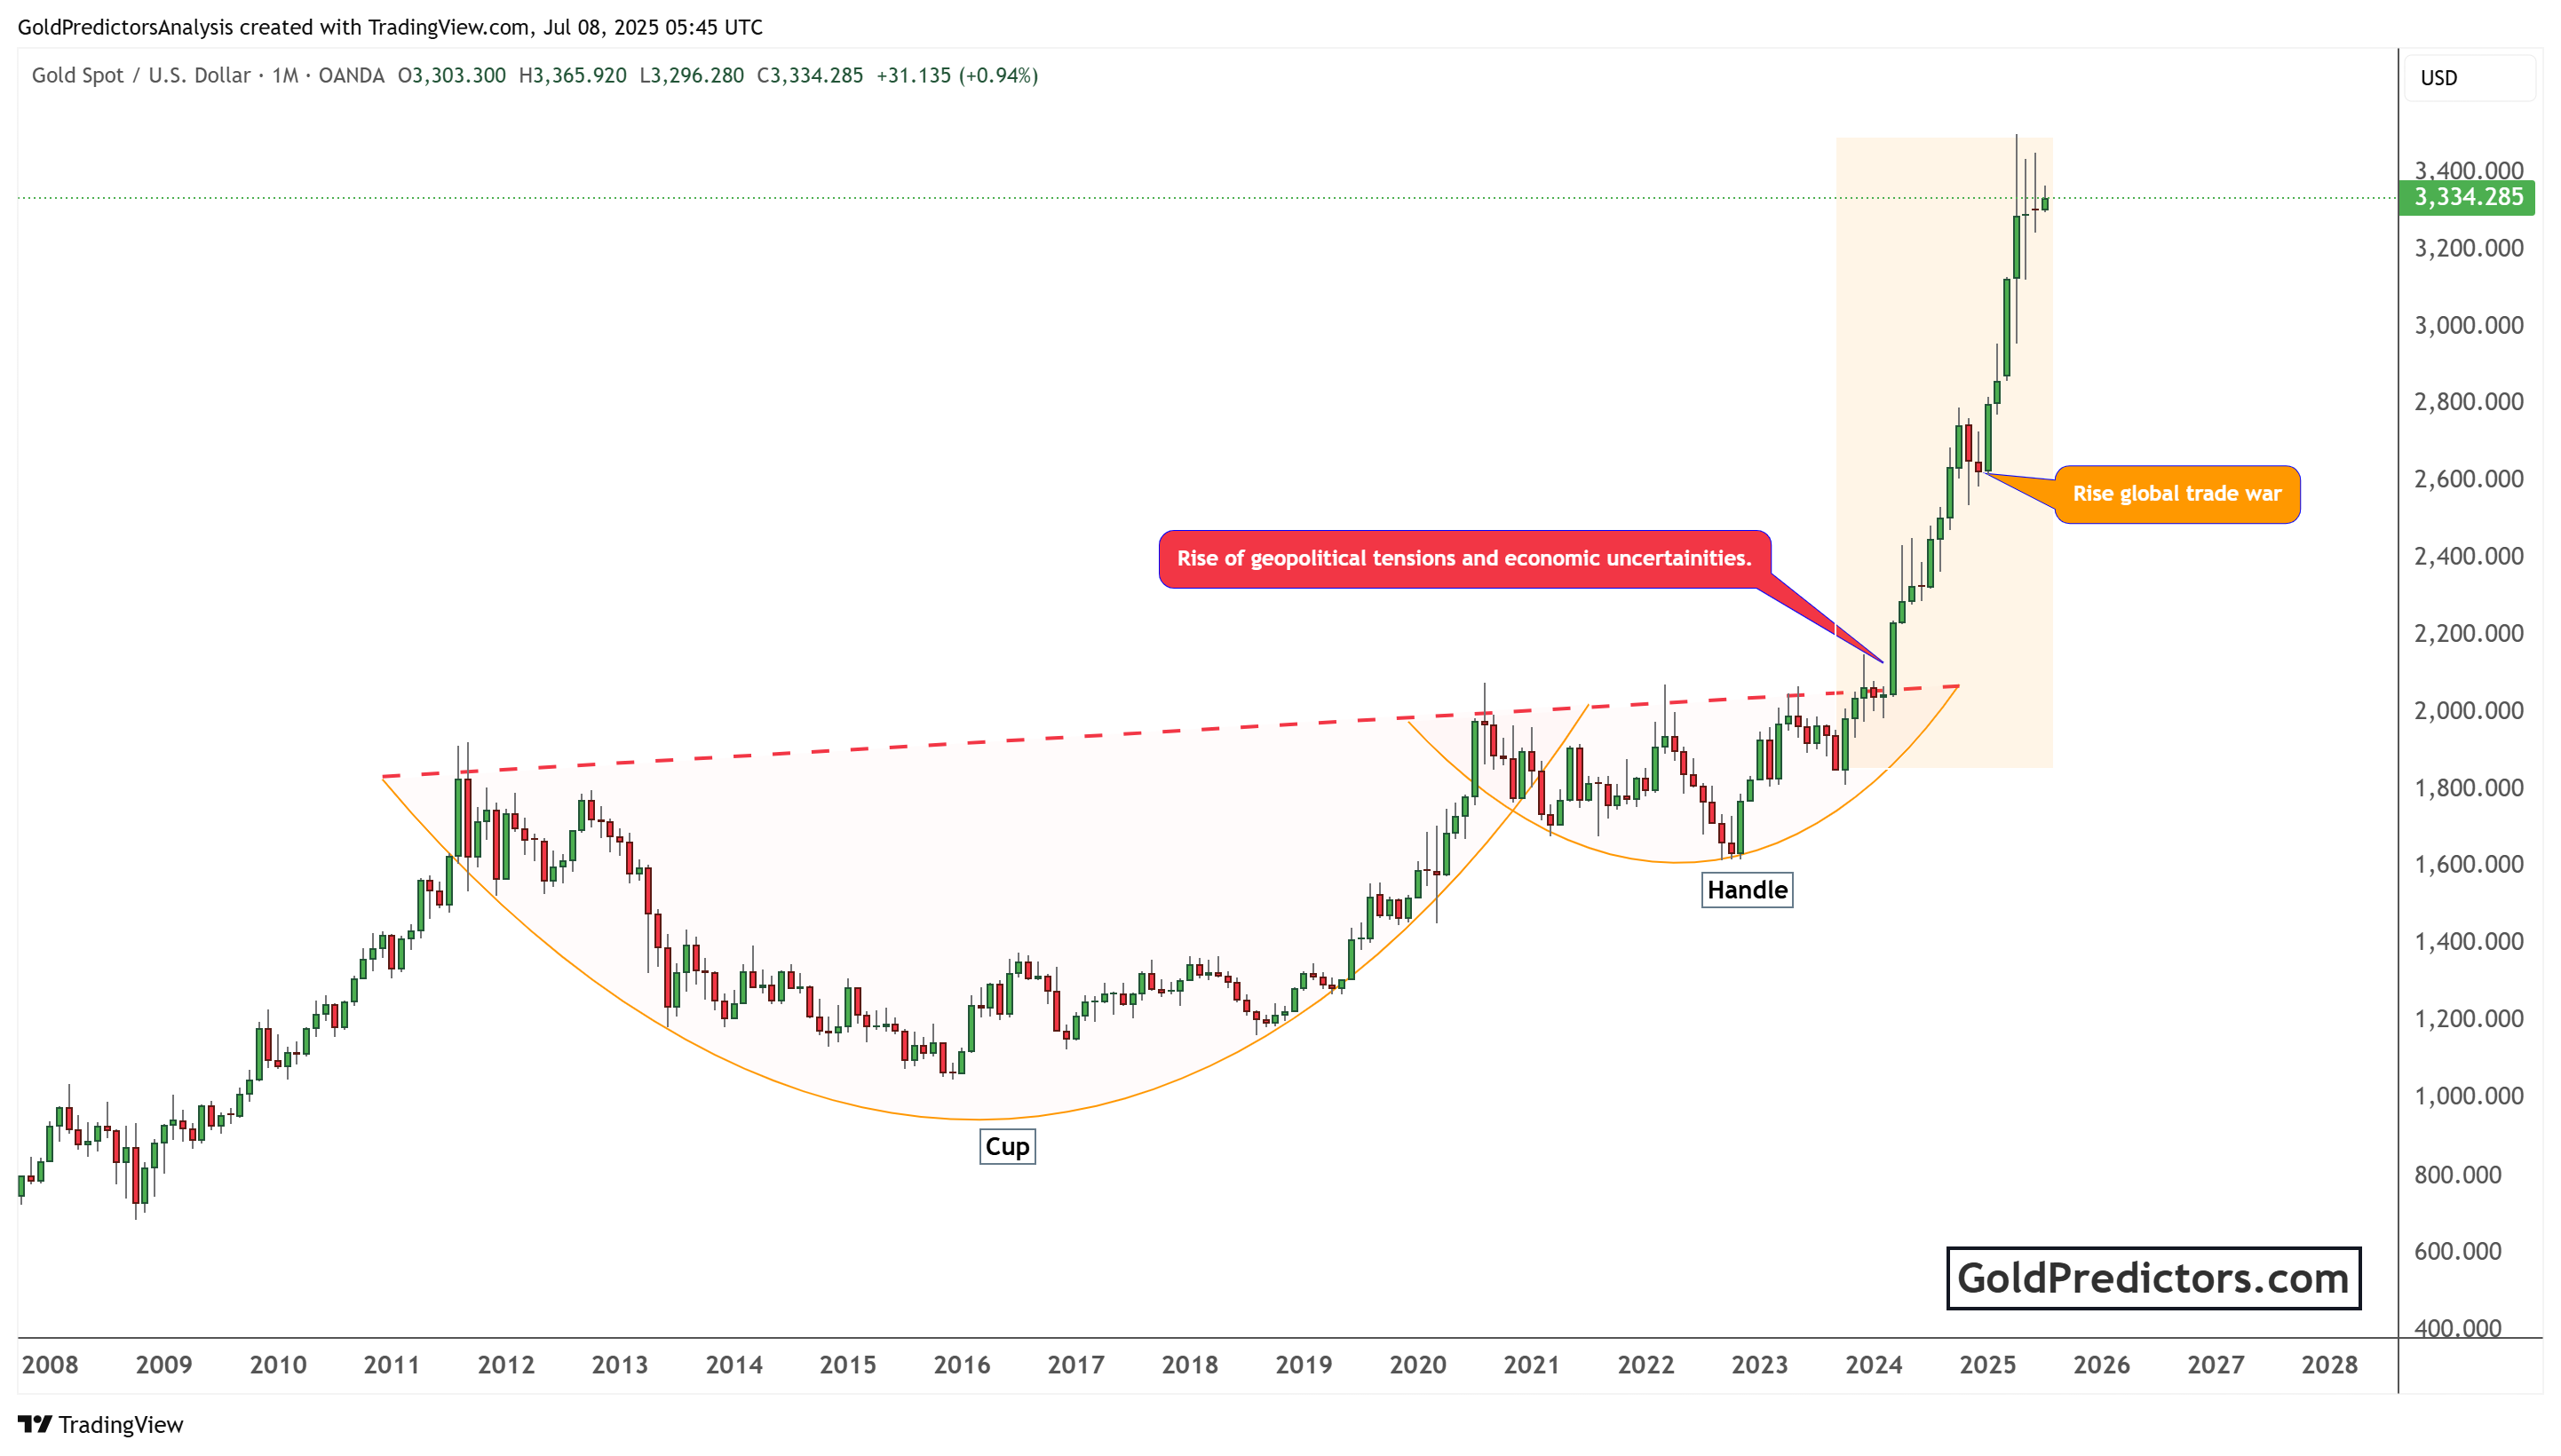
In early 2024, gold broke above the neckline of the cup and handle pattern at around the $2,100 level. This breakout occurred alongside rising geopolitical tensions and growing economic uncertainties, both of which increased investor demand for gold as a safe-haven asset. The combination of technical and fundamental factors significantly strengthened the bullish move.
After the breakout, gold entered a rapid rally phase, surging from $2,100 to over $3,300 in just over a year. This steep rise was further supported by growing fears of a global trade war, which prompted investors to seek refuge in defensive assets like gold. Based on the height of the cup and handle formation, the projected price target is expected to lie between $3,800 and $4,000 by the end of the year. Historically, gold has followed through strongly after similar breakouts, supporting a continued bullish outlook.
Conclusion: Technical Outlook for Gold Remains Bullish
Gold has entered a new phase of strength following its breakout from a long-term ascending channel in early 2025. This technical shift marked the end of a prolonged consolidation period and confirmed renewed investor interest in the metal. With gold maintaining support above $3,000, the price action suggests sustained upward momentum into 2026.
The multi-year cup and handle pattern adds further weight to the bullish scenario. Gold’s breakout above $2,100 in 2024 triggered a powerful rally, underpinned by global uncertainties and safe-haven demand. The projected target of $3,800 to $4,000 remains firmly in play, supported by historical performance and current market dynamics.
The price is consolidating at the strong resistance of $3,500. These consolidation increases the risk of an upside breakout. Therefore, any correction in gold towards the $3,000 region will be considered a strong buying opportunity for traders and investors to target the $4,000 region.
Gold Predictors Premium Membership
Get exclusive short-term and swing trade ideas with precise entry levels, stop-loss, and target prices, including justification and analysis — all delivered directly via WhatsApp.
Our premium service includes deep technical analysis on gold and silver markets. We cover cycle analysis, price forecasting, and key timing levels.
Members also receive a weekly market letter with detailed analysis, commentary from our Chief Analyst, including actionable insights, trade timing, and direction forecasts for gold and silver.
Stay ahead of the market — join our premium community today.


