Gold Breaks Out as Tech Stocks Fall Behind: A 2025 Market Shift | Gold Predictors - Forecasting Gold Prices

New York

London

Sydney

Tokyo

Log In

  • Register
  • Lost your password?
gold predictorsgold predictorsgold predictorsgold predictors
  • HOME
  • ABOUT US
    • About Us
    • Social Networks
    • Industry Links
    • Testimonials
  • RESEARCH
    • Scientific Trade Strategies
    • Gold Hub
    • Gold Importance
    • Silver Importance
  • GOLD HUB
  • GOLD ANALYSIS
    • Gold Analysis
    • Technical Analysis
      • Trend Identification
      • Phase Identification
      • Important Levels
      • Volatility Measurement
    • Gold Cycle
      • Short Term Cycles
      • Medium Term Cycles
      • Long Term Cycles
    • Price Action Analysis
      • Phase Identification
      • Historical Pattern Identification
      • Candlestick Pattern Identification
    • Fundamental Analysis of Gold
    • Gold Related Markets Analysis
    • Gold Seasonal
  • TRADING METHODOLOGY
    • Gold Analysis
      • Technical Analysis
      • Gold Cycle
      • Price Action Strategy
      • Fundamental Analysis
      • Gold Related Markets Analysis
      • Gold Seasonal
    • Measure Signal Strength
      • Weak Signal
      • Strong Signal
      • Confirmed Signal
    • Trading Decision
    • Trading Rules
      • Basic Trading Rules
      • Gold Predictors Trading Rules
    • Trade Examples
    • Performance
  • LIVE CHARTS
  • MEMBERSHIPS
    • Free Membership
    • Premium Membership
    • SignUp
  • MEMBERS AREA
    • Free Article
    • Premium Article
    • Trading Signals
    • Long Term Signals
    • Forex Reports
    • Crypto Reports
  • FOREX REPORTS
  • HELP
    • FAQ
    • Contact Us
Login / Register

Gold Breaks Out as Tech Stocks Fall Behind: A 2025 Market Shift

0
Published by admin at April 22, 2025
Categories
  • Free Articles
Tags
  • dollar
  • forex
  • gold
  • US Dollar
gold pattern

Gold has always held a special place in the financial markets. Investors often move their capital to safe-haven assets in uncertain times. Gold has recently surged to new all-time highs, attracting major attention from analysts and traders across the financial markets. On the other hand, technology stocks are showing signs of weakness compared to gold. This article shows that gold is breaking out of major pivotal zones, while the technology sector remains uncertain. Based on this analysis, gold is likely to be the top performer in 2025.

Gold Breaks Resistance and Reaches New Highs

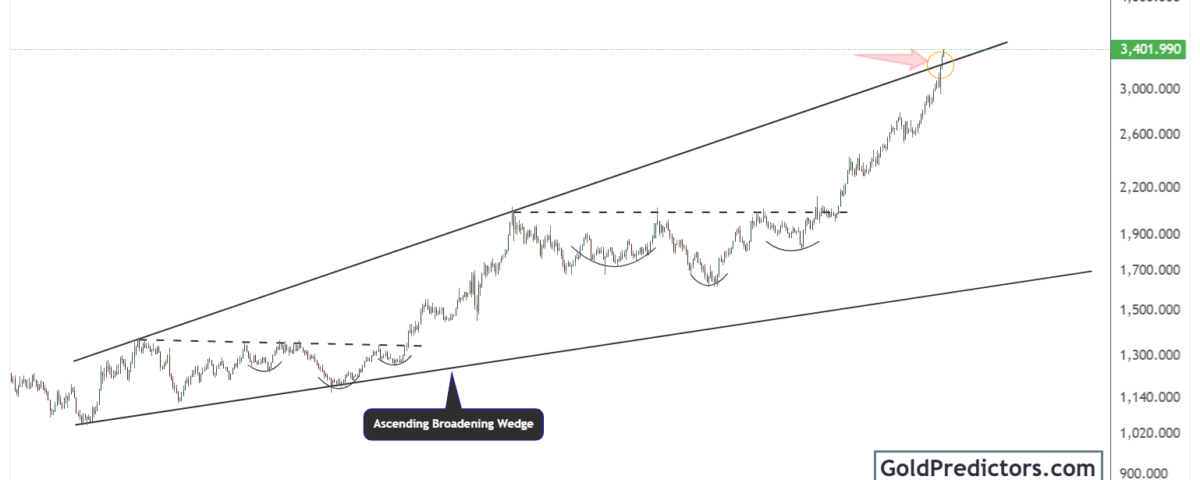
The weekly gold chart shows that gold has been trading within a long-term “Ascending Broadening Wedge” pattern. This chart pattern suggests rising volatility and potential for higher prices. The upper and lower trend lines have been respected for many years. Each dip found support on the lower trend line, and each rally reached the upper boundary.

gold pattern

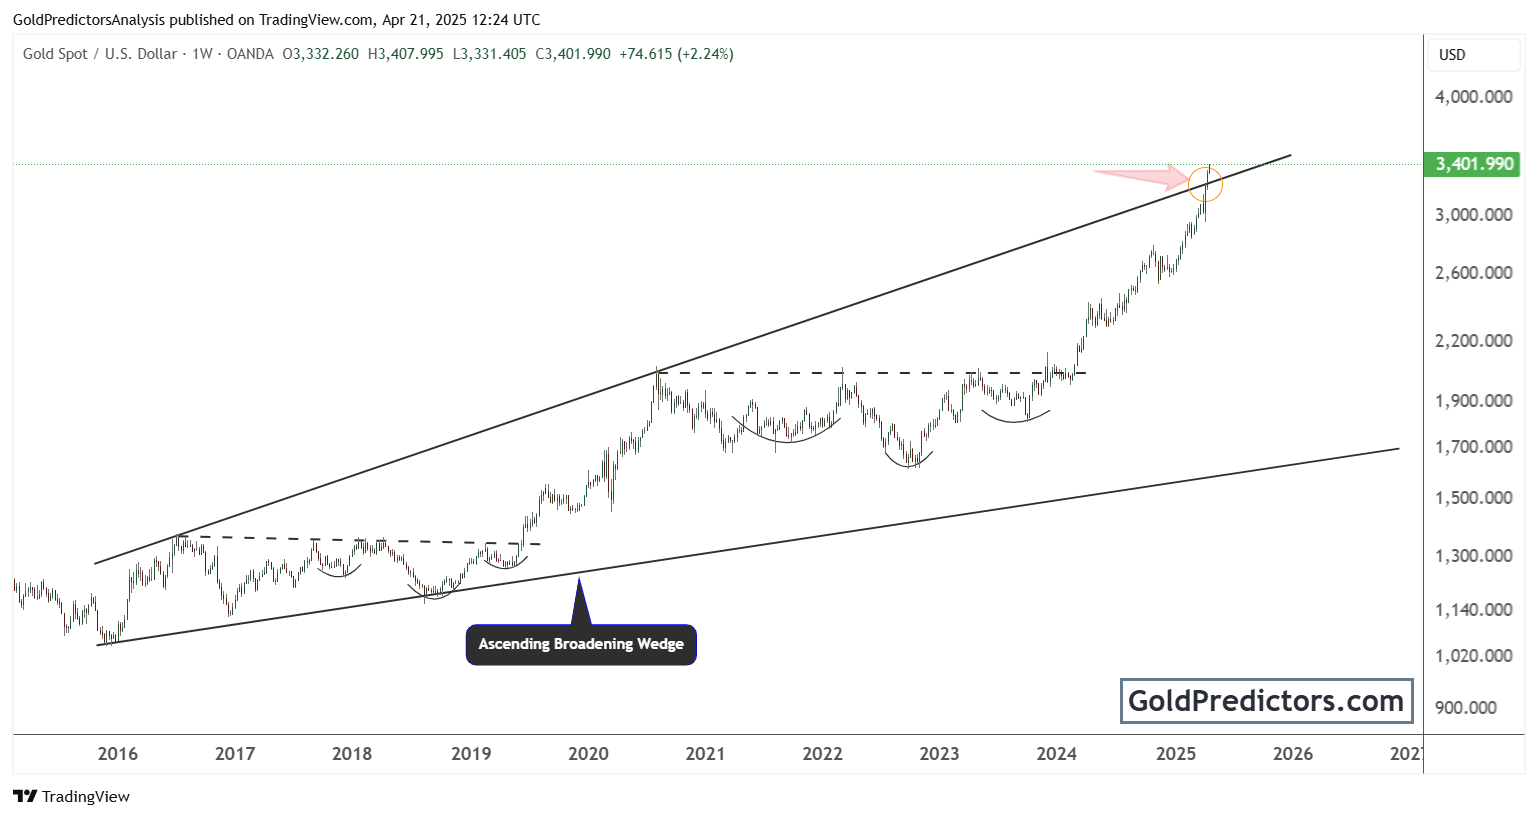
In early 2025, gold finally broke above the upper resistance of this wedge. This breakout is marked clearly on the chart with an orange circle and a red arrow. Gold currently hits $3,500 per ounce, a new all-time high. This price level breaks years of consolidation and signals that gold remains in a new bull cycle.

The inverted head and shoulders formations are visible within the wedge. These are continuation patterns, and they have led to upward momentum. The latest breakout from this pattern suggests that gold could climb even higher in the coming months. The breakout from the broadening wedge indicates that the price may result in explosive moves. This technical setup supports a bullish case for gold in 2025.

Gold Outperforms Tech: How Gold is Surpassing Technology Stocks in 2025?

The gold monthly chart below compares the performance of the Technology Select Sector SPDR Fund (XLK) versus gold. This monthly chart covers the period from 1998 to 2025. It shows a long-term battle between tech and gold. For over a decade, tech outperformed gold, especially after 2011. But things have changed recently.

gold pattern

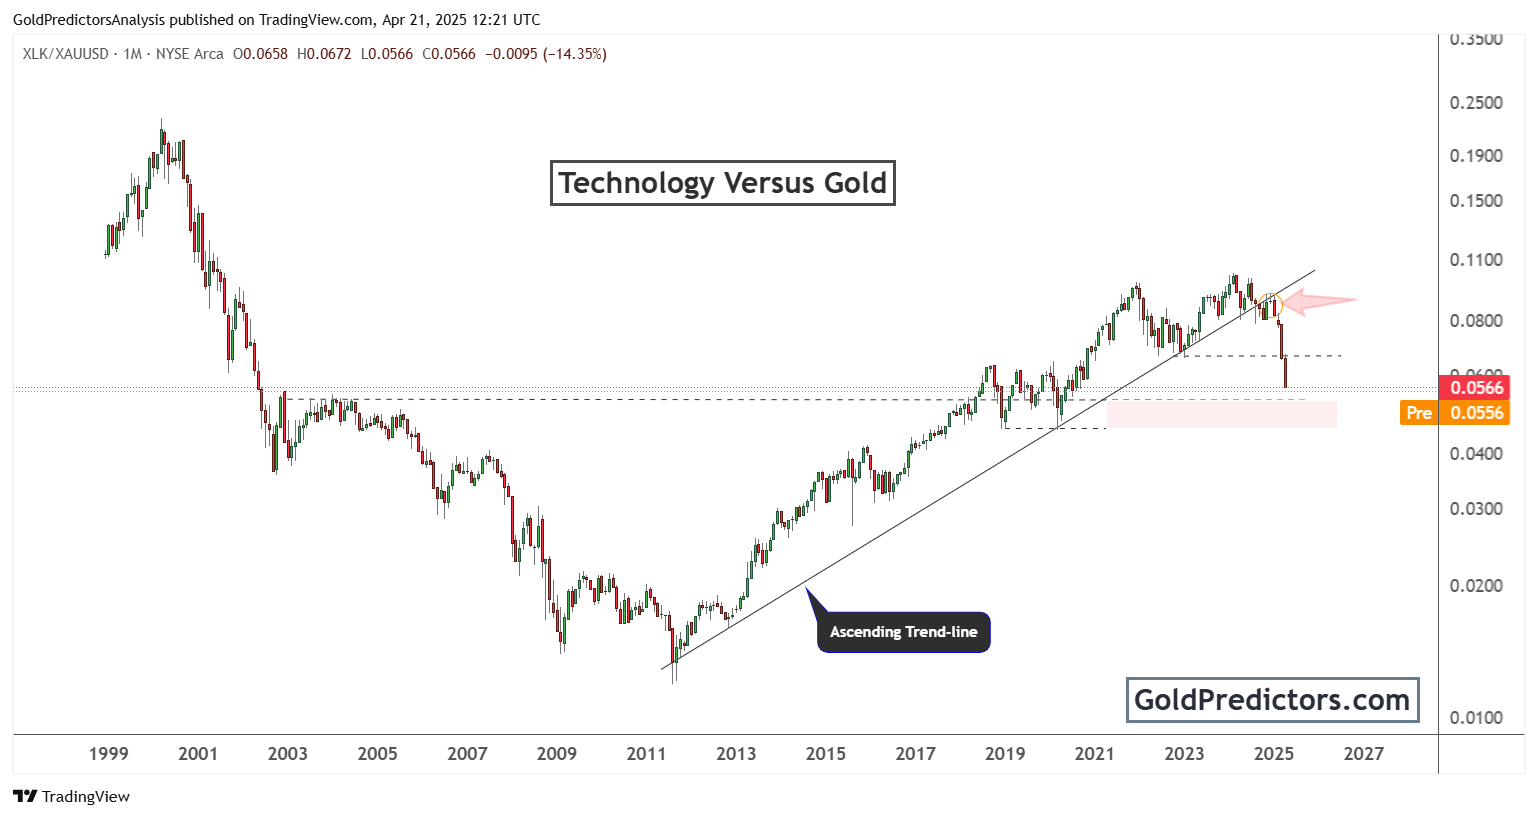
The ratio broke below a long-term ascending trend line, highlighted with a red arrow and a yellow circle. The chart also shows a sharp decline in the ratio. It dropped by around 14.35% in just one month, reaching a level of 0.0566. This steep fall shows that gold is outperforming technology stocks at an accelerating pace.

There is also a strong support zone marked in the pink shaded area. If the ratio continues to fall, it could reach that zone, showing even more weakness in tech. Investors seem to be pulling their money from technology and putting it into safer assets like gold. The long bull run of tech may be cooling off, while gold is gaining traction.

This trend could continue through 2025 as inflation fears, interest rate uncertainties, and global instability push investors toward real assets.

Final Words

Gold recently broke through its long-term resistance, showing a strong chance for continued growth. The charts clearly show a positive pattern, suggesting that gold may keep rising in 2025. This is a strong signal for investors to consider gold a safer and more reliable investment as market uncertainty grows.

On the other hand, technology stocks are facing increased weakness. The long-standing trend of tech outperforming gold has reversed, with tech stocks showing a significant decline compared to gold. As investors move towards safer assets, gold seems to be the stronger performer.

Looking ahead, global economic challenges could continue to drive gold’s upward momentum. With inflation concerns, interest rate uncertainty, and geopolitical instability, gold’s appeal as a safe-haven asset will likely grow. As we move into 2025, gold could remain the top choice for investors seeking stability in uncertain times.

Latest Post

Free Articles

Gold Looks to Find Support for a $4,000 Target

Gold surges above $3,200, breaking a decade-long pattern. Technicals and global tensions point to a bullish run toward $4,000 …
Read More
July 28, 2025 / admin
Free Articles

Gold to Silver Ratio Reversal: Why Silver Could Outperform Gold in 2025

Gold breaks out of a decades-long pattern as silver gains momentum—both metals signal the start …
Read More
July 14, 2025 / admin
Free Articles

Silver Breakout 2025: Price Eyes $50 and Beyond

Silver’s 2025 breakout above $30 signals potential for a $50 surge, with historical trends supporting …
Read More
July 11, 2025 / admin
Free Articles

Gold Price Consolidates Below $3,500—Next Target $4,000?

Gold’s consolidation below $3,500 signals a potential breakout, positioning prices toward a $4,000 rally driven …
Read More
July 9, 2025 / admin
Free Articles

Gold (XAUUSD) Enters Bullish Supercycle After Historic Breakout Against US Equities

Gold breaks out of decades-long resistance as it gains strength over equities, signaling a decisive …
Read More
July 8, 2025 / admin
Free Articles

Why Gold May Reach $4,000: Bullish Breakout Signals Long-Term Rally

Gold’s breakout has fueled a powerful rally above $3,300, with strong support and looks for …
Read More
July 6, 2025 / admin
Become a Premium Member

Related posts

gold pattern
July 28, 2025

Gold Looks to Find Support for a $4,000 Target


Read more
gold pattern
July 14, 2025

Gold to Silver Ratio Reversal: Why Silver Could Outperform Gold in 2025


Read more
silver pattern
July 11, 2025

Silver Breakout 2025: Price Eyes $50 and Beyond


Read more

Comments are closed.

ABOUT US

  • About Us
  • Social Networks
  • Industry Links
  • Testimonials
  • Terms & Conditions

TECHNICAL ANALYSIS

  • Technical Analysis
  • Trend Identification
  • Phase Identification
  • Important Levels
  • Volatility Measurement

CYCLE ANALYSIS

  • Gold Cycle
  • Short Term Cycles
  • Medium Term Cycles
  • Long Term Cycles

PRICE ACTION ANALYSIS

  • Price Action Analysis
  • Phase Identification
  • Historical Pattern Identification
  • Candlestick Pattern Identification
© 2017 Gold Predictors. All Rights Reserved.
  • Remember Me
    Lost your password?
    Dont have an account?Sign Up