


Fluctuations in Gold
This is a continuation of the previous free update. The bullish and bearish outlooks for gold prices have been presented in both cases. Now is the time to make a choice. According to the premium article, the price is retracing from the first weekly resistance level of $1,815. The price has now returned to the $1,785 support level. Gold has closed back on the juncture of the 100 and 200 DMA(Daily Moving Averages) yesterday, for traders who look for moving averages to determine the next move in financial instruments. It indicates that fluctuations in gold will increase with high volatility within $1,835 and $1,700 band until a breakout.
Market Outlook
The 10-year Treasury yield has risen to 1.675% and is expected to rise further. Inflationary pressures are pushing up market expectations for interest rate hikes. Breakout above 1.75% would aim for 2.35%. According to last week’s expectations, the dollar index fall down. It is because the CPI and average hourly earnings are increasing at rates greater than 5% per year. The Chinese yuan has also broken through resistance, putting further downward pressure on the US dollar. If the dollar weakens, gold demand will rise, but gold prices will remain volatile, with large swings in both directions, until a clear breakout happens. These large moves are the result of a pending decision on technical price charts.
The premium members have been informed of the tricky area where the big decision might take place. When prices trade in such a significant area, price volatility increases with the increment in the risk in the financial market. As stated in last week’s report, a weekly close above $1,800 in spot gold will be the first indication to look for the $1,835-$1,850 region in spot gold.
On the other hand, it was discussed that a weekly close above $24.30 in spot silver will be the first indication to look for further upside in silver. The weekly close in spot gold was $1,792, and the weekly close in spot silver was $24.299. This is due to the fact that markets never allow investors or traders to easily eat profits. There is still no confirmed trading signal for the trade to be executed. We are looking for a trading signal in gold and silver to deliver to premium members in such a high-risk environment.
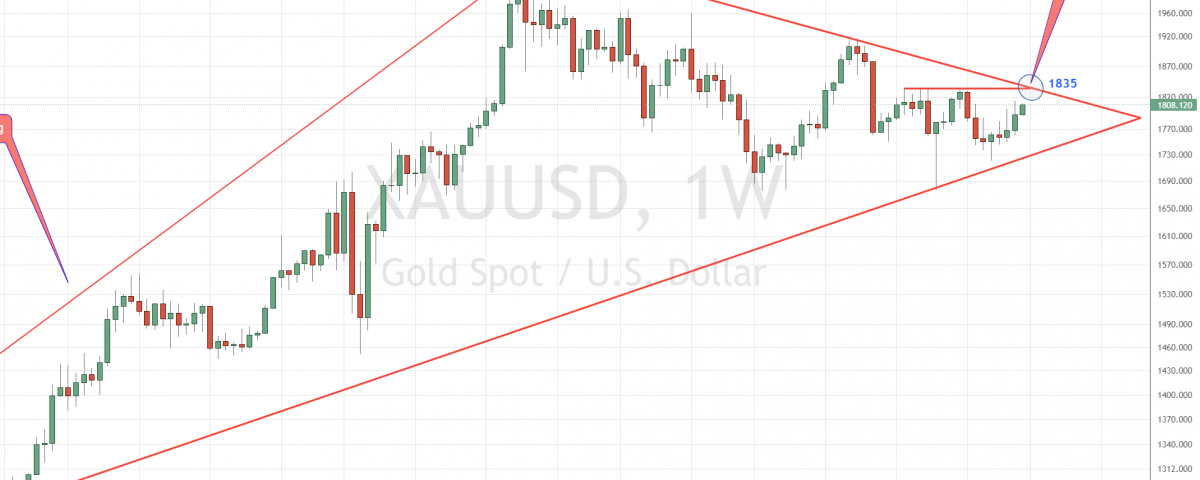
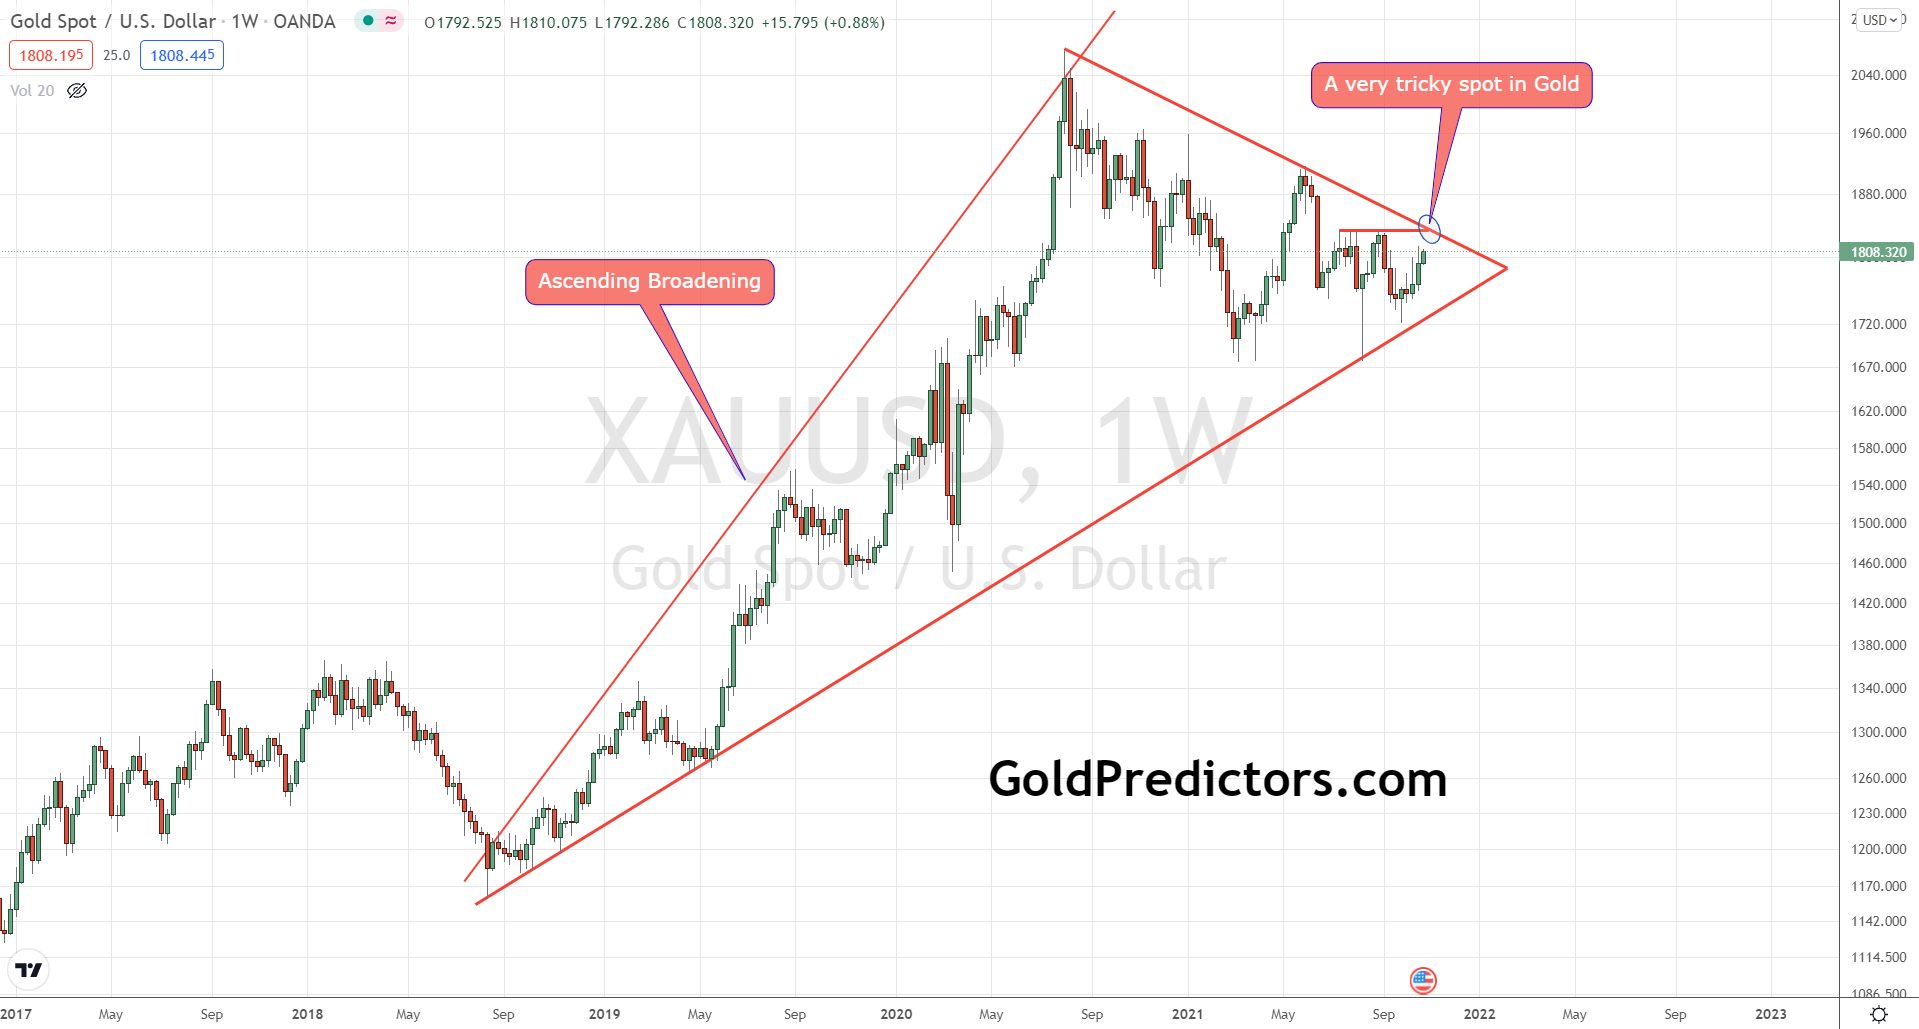
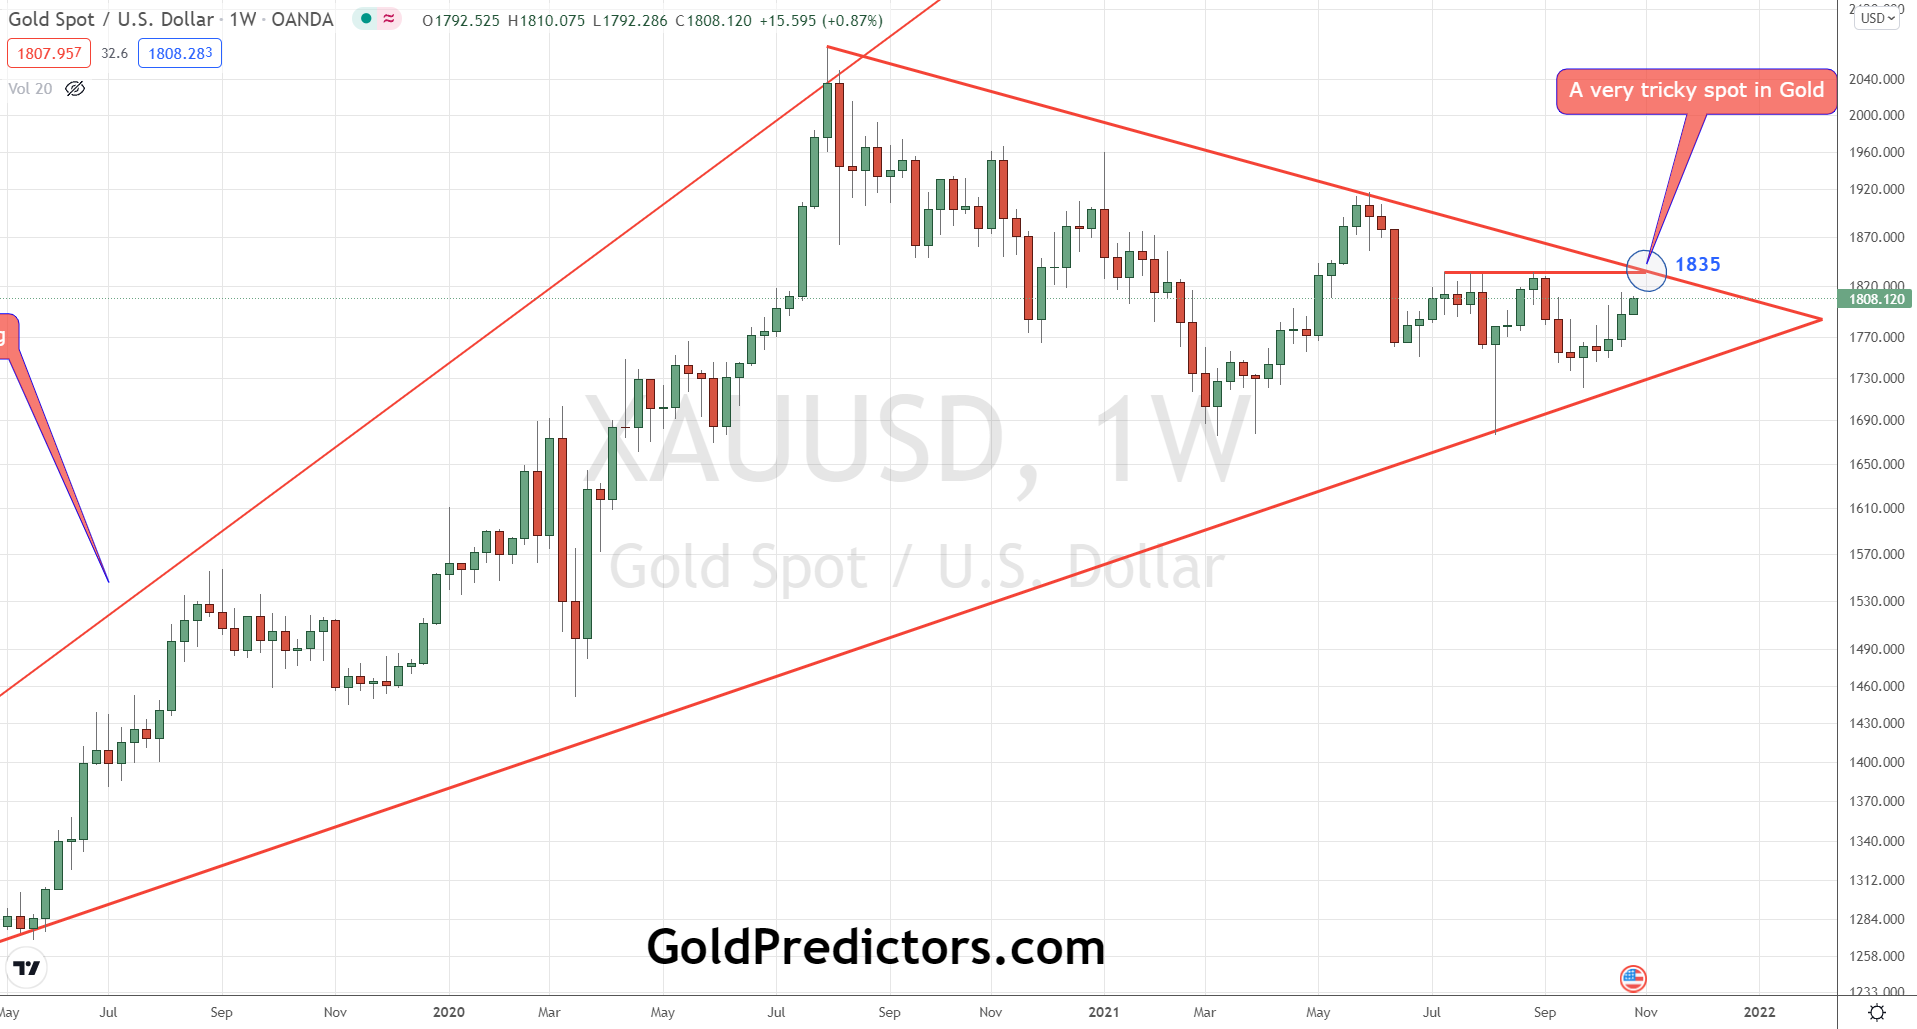
Gold Critical Juncture
The chart below depicts the formation of an ascending broadening pattern, which indicates that the big moves are about to happen. Unfortunately, the movement’s direction is still unknown. The chart shows that the price is approaching a key resistance juncture that was highlighted last month. The resistance number of $1,835 has become the monthly resistance, and a close above $1,835-$1,850 would trigger massive moves. In contrast, if prices break below the ascending triangle, the price will fall. Premium articles will elaborate on our expectations and further analysis. One thing is certain: increasing volatility in trading will increase both the risks and the rewards.
To receive Free Updates, please register as Free Member.
To receive Premium Articles, Trading signals and premium stuff, please register as Premium Member.


