


How to Play Gold Tricky Spot?
Gold prices have risen last week but failed to close above $1,800. Silver prices followed the gold price trend and closed the week at $24.299 (Spot Silver). A weekly close above $24.30 in spot silver was a bullish signal, as mentioned in the previous article. Silver has simply puzzled market participants with just one cent. Both metals are approaching a critical level where a large significant move in either direction is likely. This critical juncture is referred to as the gold tricky spot.
The name “tricky spot” comes from the fact that prices frequently deceive investors with excessive volatility and large moves. When the price trades at tricky spot, determining the next course of action is a difficult task. The trading during this environment and controlling the risk is a very difficult task.
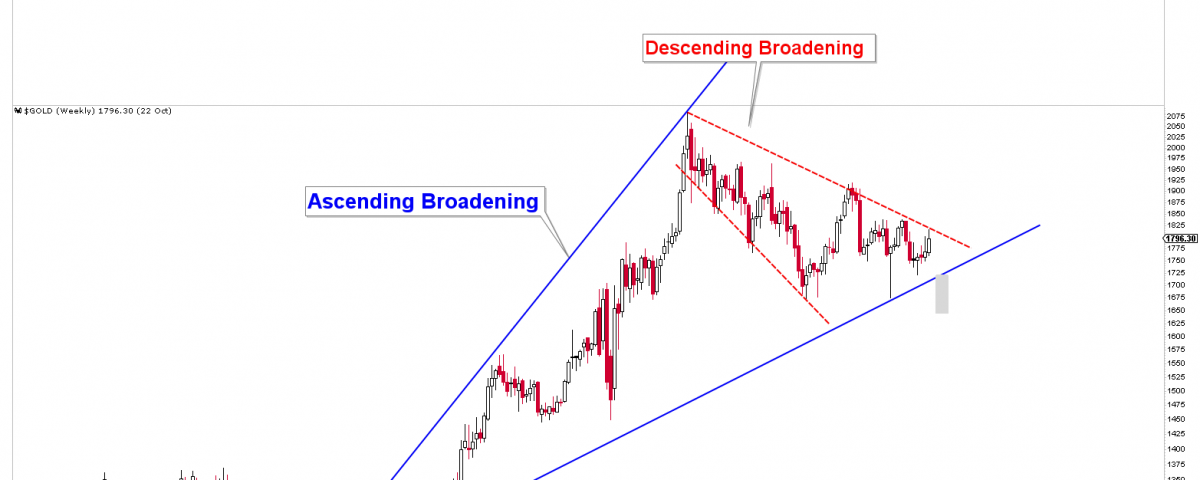
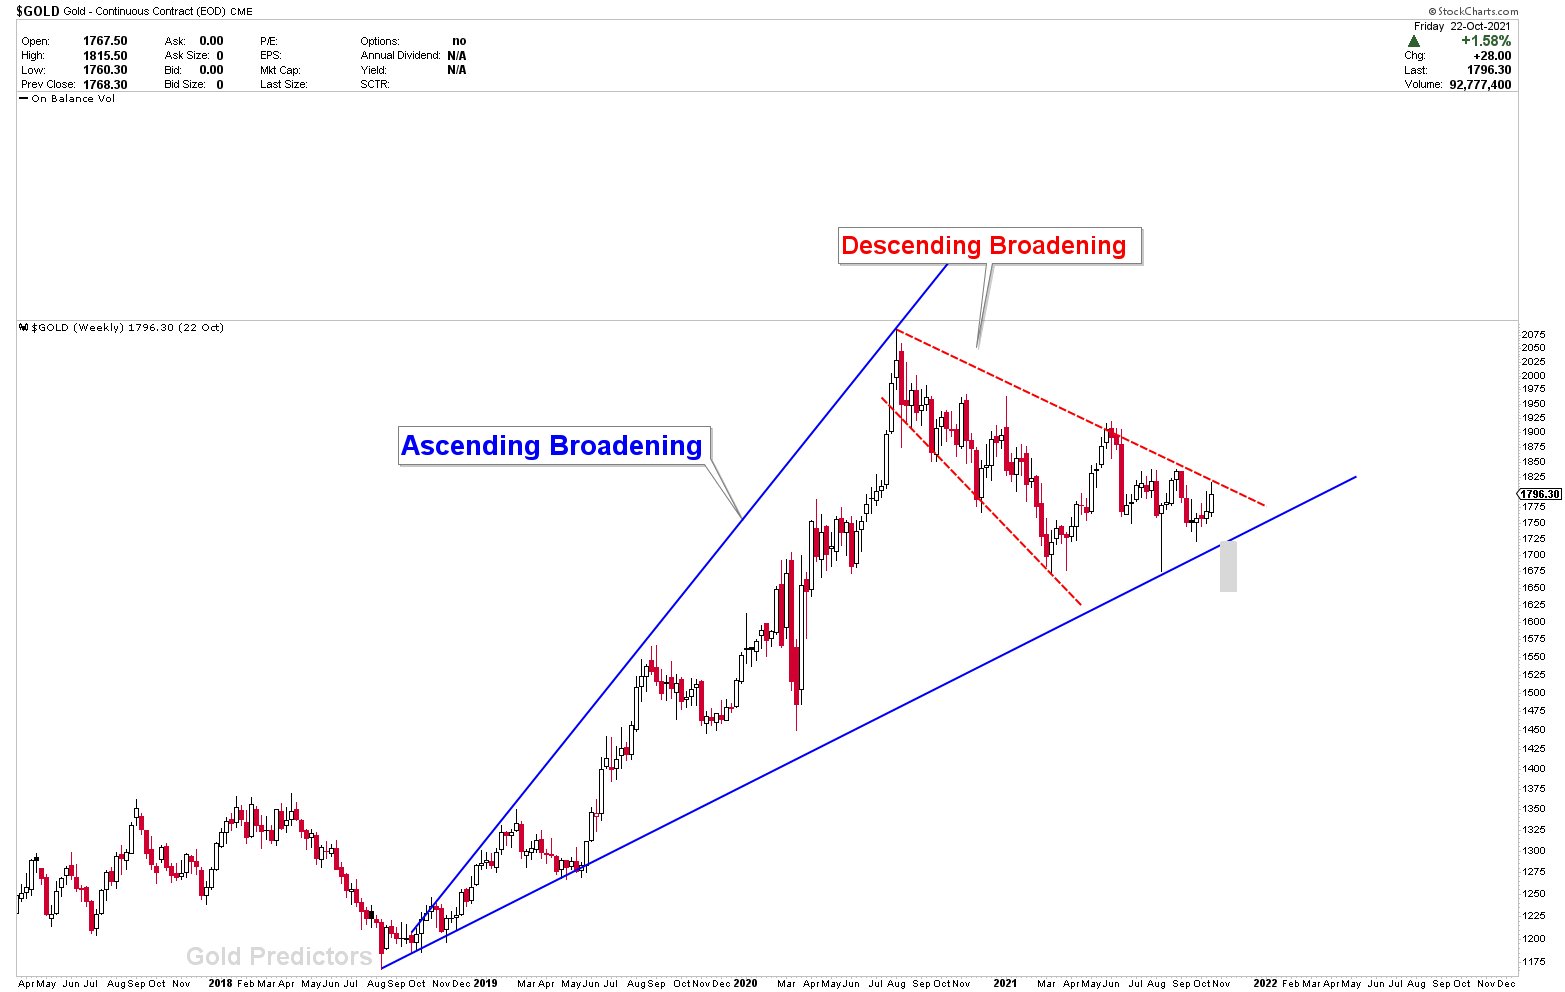
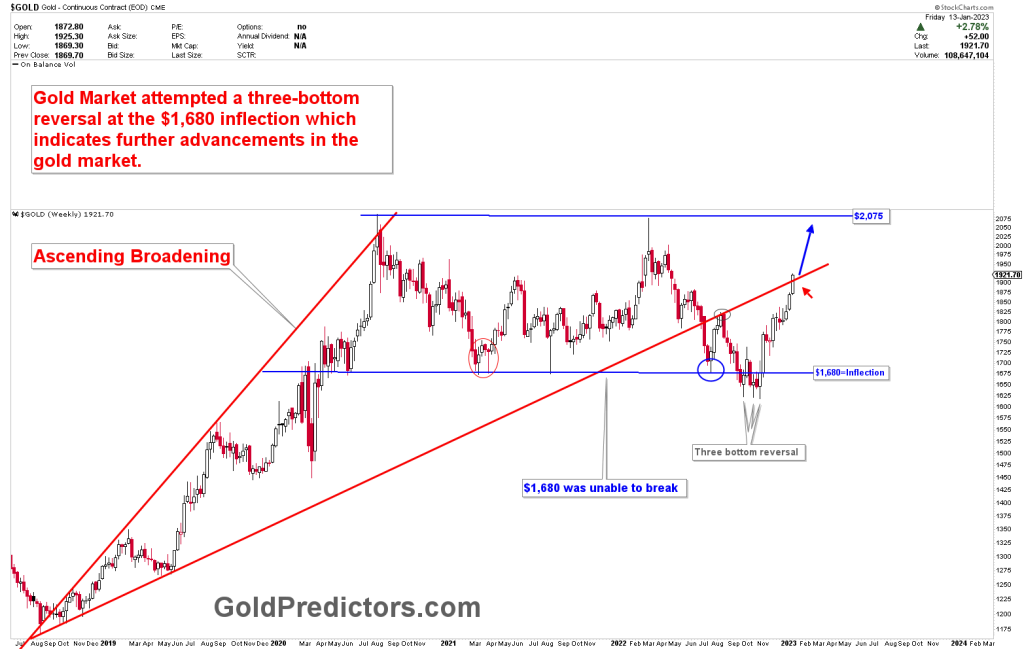
The chart below depicts a major pattern in the gold market, indicating that the next big move in either direction is about to happen soon. The chart depicts the formation of ascending broadening patterns where the price has been stuck for several months. Now, the recent drop in gold markets has produced descending broadening patterns, which are bullish price patterns if broken upside. The gold market is now on the verge of descending broadening, where the next big move must occur. As expected, the US dollar index fell last week. A move below the last week’s low will cause the index to fall even further in the near future. If this happens, gold and silver may skyrocket to hit the important resistance juncture. The US dollar index is currently trading sideways with big ranges.
This article will go over the personal thoughts, trading comments, market overview, gold cycles, gold tricky spot, and important levels for the coming week.
To receive the premium updates, please register as a Member.