Dollar Can Trigger A Gold Bubble
The current bearish patterns in dollar indicate that dollar can trigger a gold bubble.
The subject portrays research on long-term investment opportunities intended to acquire gold & silver or accumulate long-term securities
Open Positions
Bought 1 Spot Gold 1206, September 2018
Bought 1 Spot Gold 1206, September 2018
Bought 1 Spot Gold 1414, June 2019
Bought 1 Spot Silver 14.50, March 2020
Bought 1 Spot Silver 14.50, March 2020
Bought 1 Spot Silver 14.50, March 2020
New Stop Loss for Silver Positions: 16.50
New Stop Loss for Gold Positions: 1410
Based on the study, we have new pending orders to enter in gold and silver markets. Please read until the end.
To study the fundamental outlook of market, we will use another update. Here we investigate the possibility of another good long term entries to our long term trading portfolio.
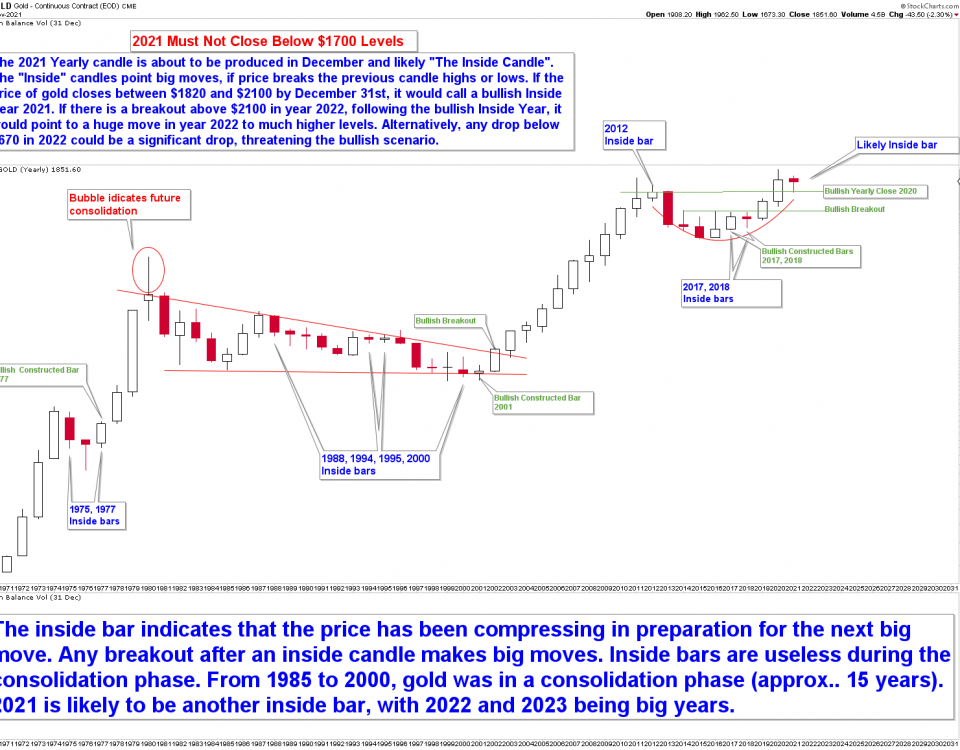
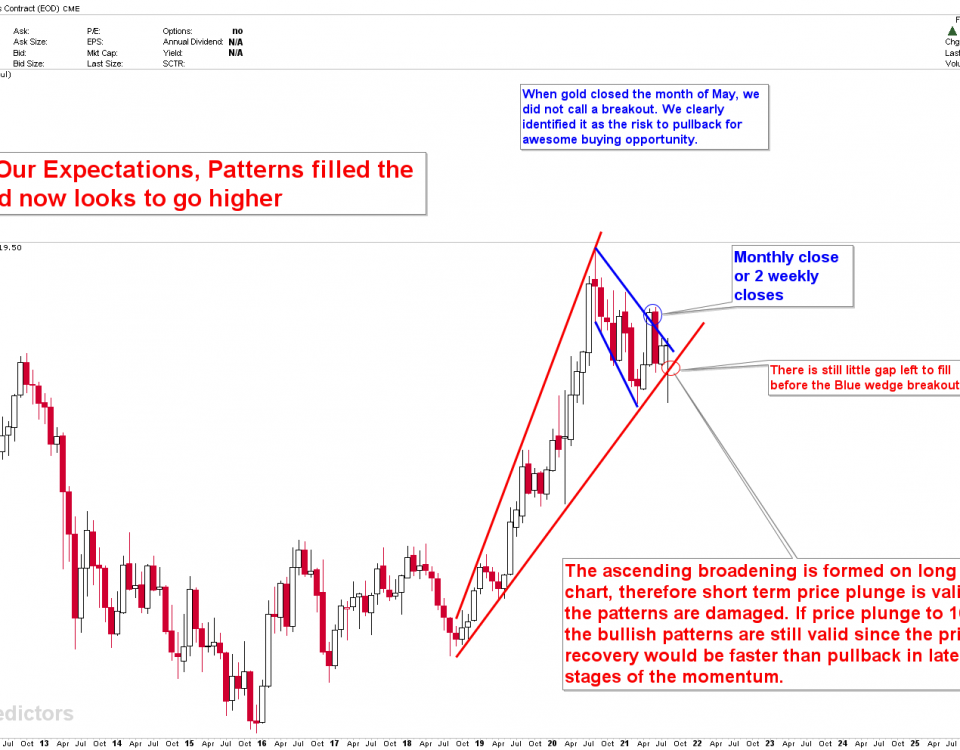
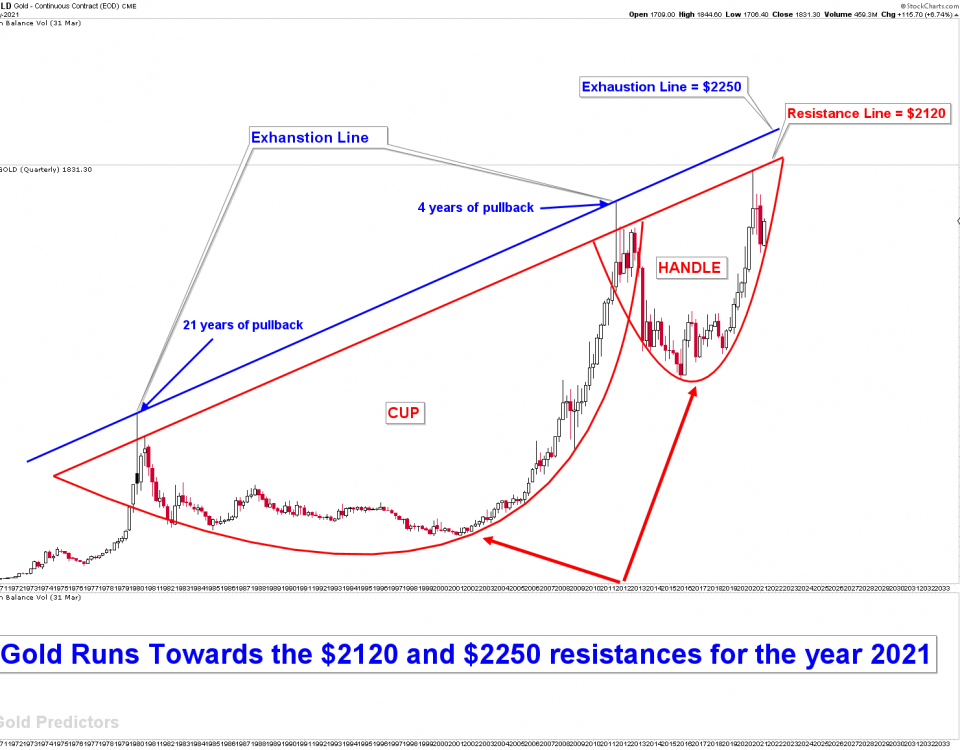
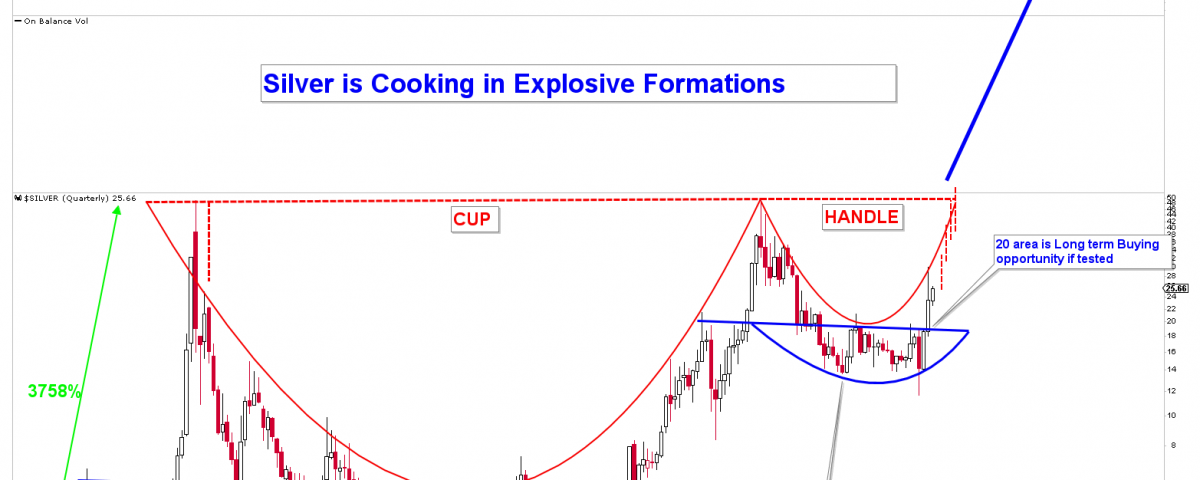
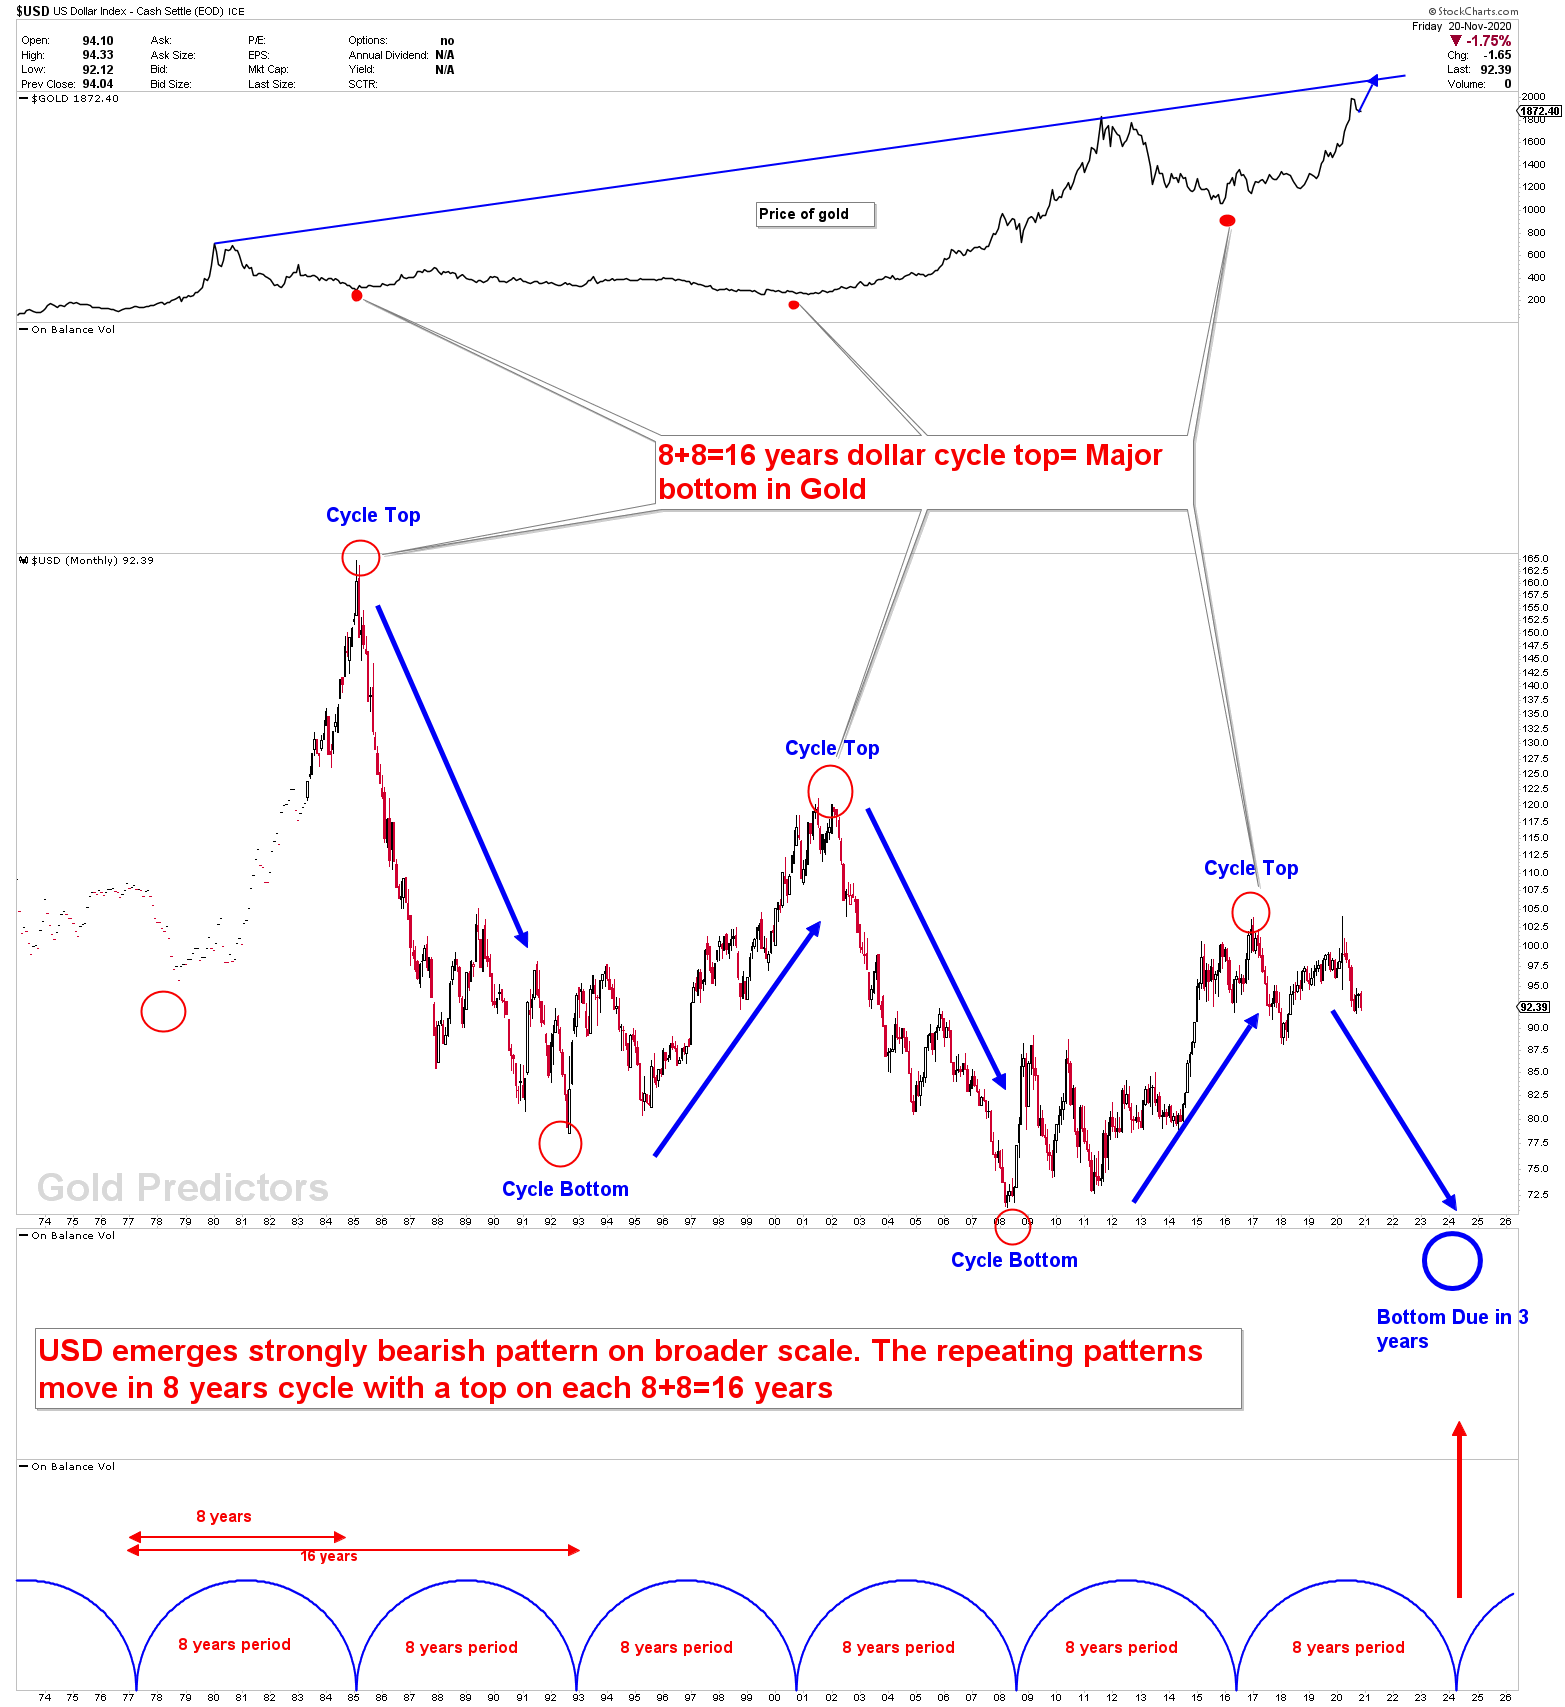
Looking at the dollar eight years’ cycle, it is clear that dollars shift in a clear period of eight years and top cycles every sixteen years. When dollar has reached its peak, it adds fuel to the price of gold. Dollar’s recent peak, which generated an 8-years low on the price of gold chart , appears very constructive and shows gold bubble through long-term barriers. Gold currently hits our established 2000-2100 resistance and constructive retracement towards 1800 indicate a good opportunity to get into Gold and Silver trading portfolio.
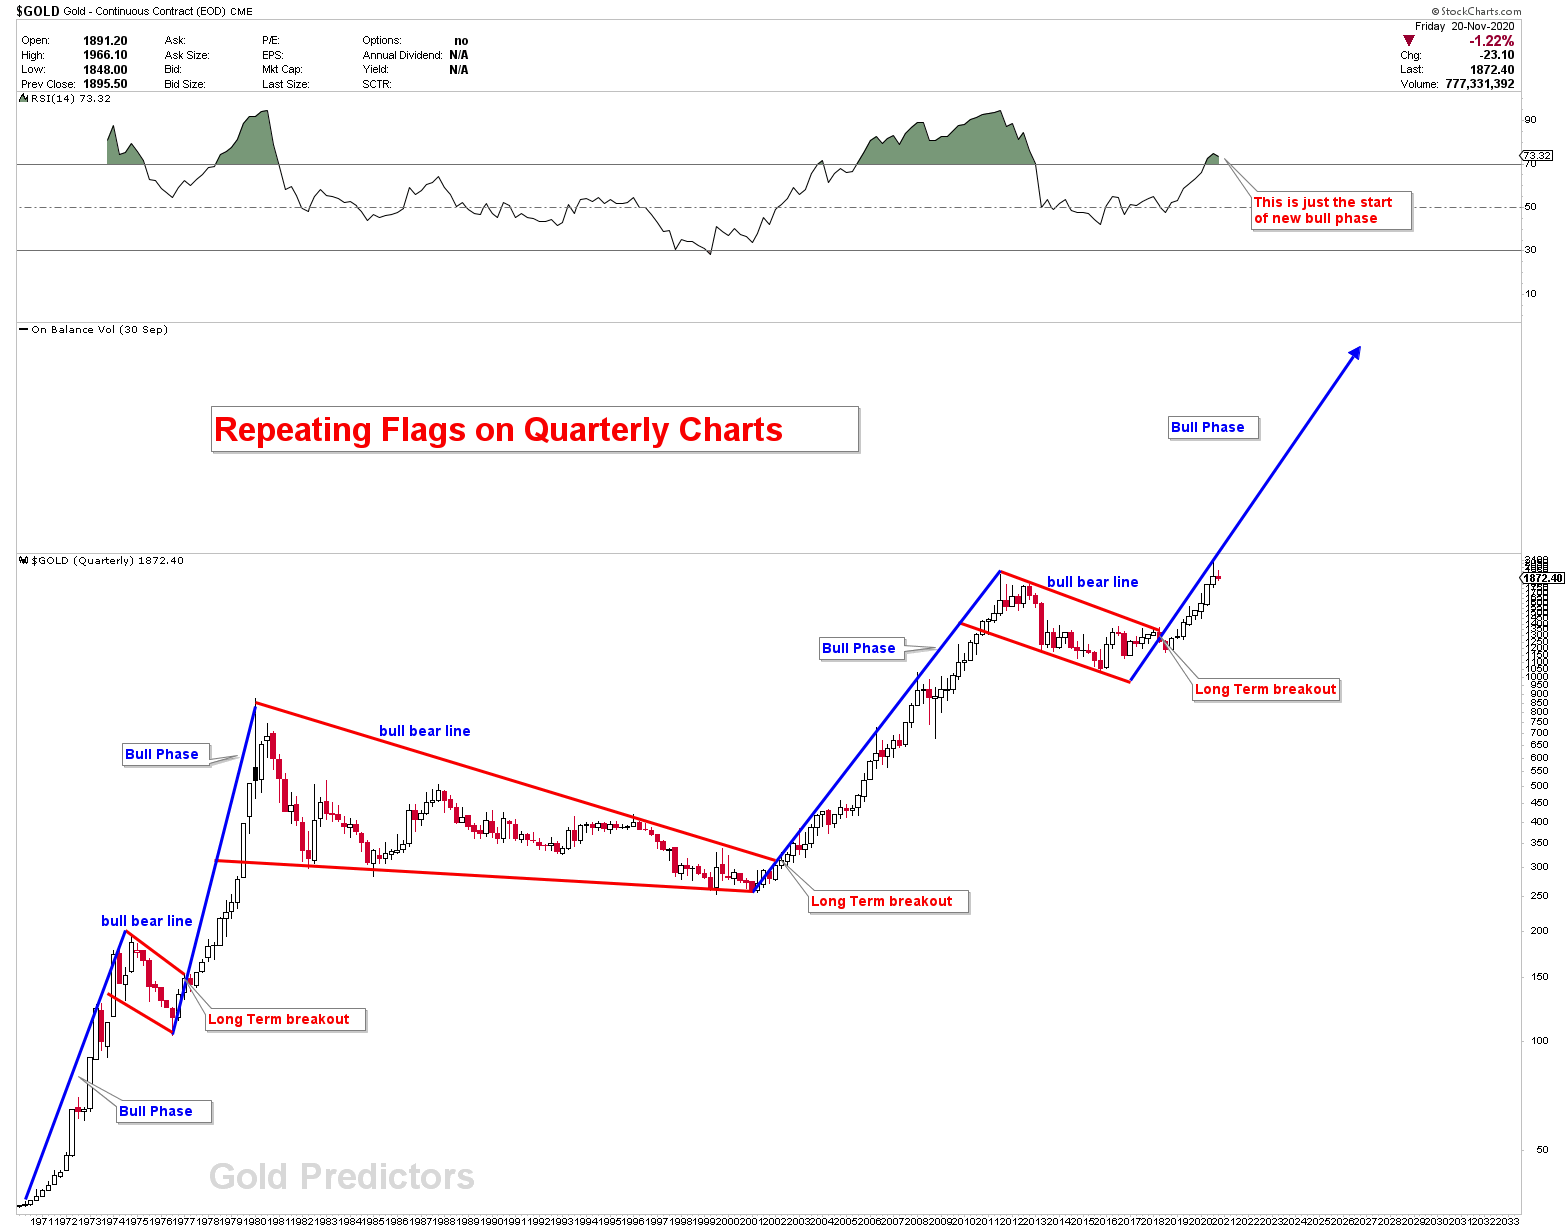
The following chart illustrates the emergence of major flags in quarterly gold charts. Gold enters the long-term Bull Phase once each flag is broken to upside and prices do not likely look back on monthly charts. The flags are a long-term breakout. The latest breakout took place in January 2019 and RSI remains above overbought regions during the bull phase of gold bubble.
The Content is reserved for Premium Members. Please login before reading


