Gold Price Forecast: Is Gold Still Strong Against Inflation?
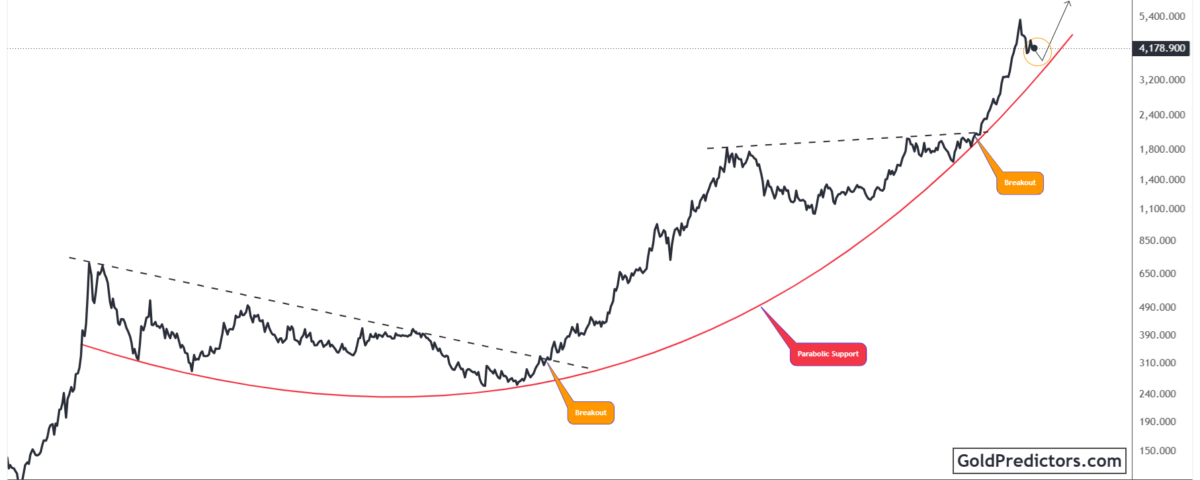
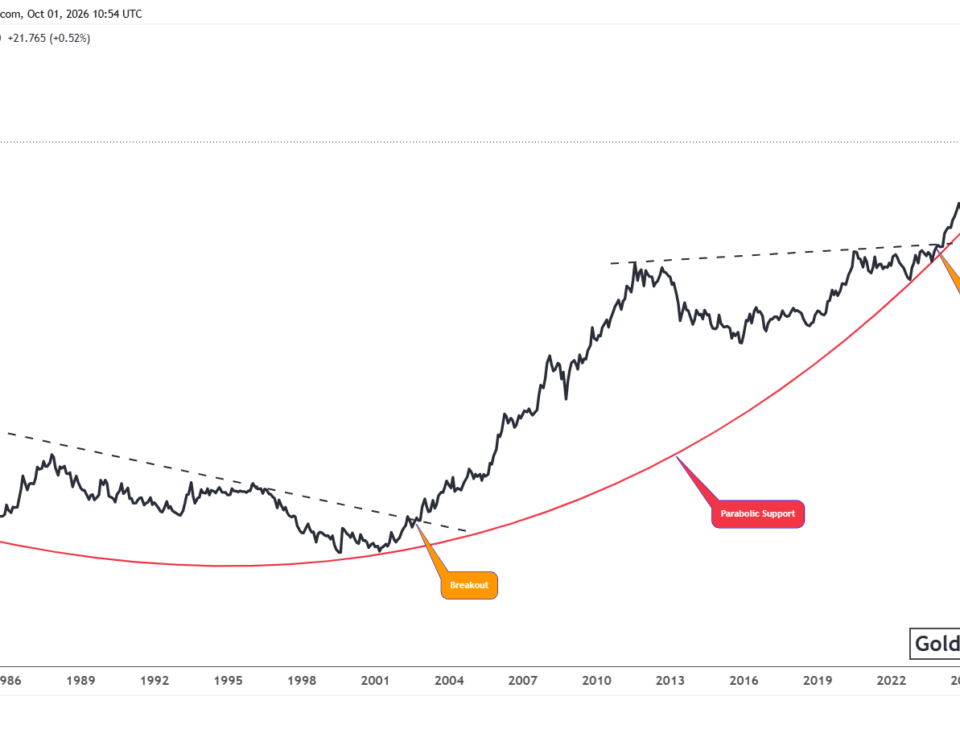
Gold (XAU/USD) is stabilizing after its sharp correction from the record area. The Price remains above the rising parabolic support and well above the major multi-decade breakout zone. This keeps the broader structure constructive, although recent volatility calls for caution. The Gold/CPI ratio also remains above its cup-and-handle breakout. It is now testing the lower side of a rising structure. These patterns suggest that gold’s larger trend remains intact, but the next move depends on support holding and the market’s response to US employment data.
Gold Market Outlook: Softer PCE Inflation Shifts Attention to US Payrolls
Softer US inflation data helped gold stabilize as it continued to consolidate after its recent decline. The headline PCE Price Index rose 0.3% in August and 3.4% from a year earlier. Core PCE increased 0.2% during the month and 3.0% annually. Following the release, markets priced a 37% chance of an October Federal Reserve rate increase, down from 45%. Gold remained broadly steady, while a firm US dollar and elevated Treasury yields limited gains.
Employment data now carries greater importance. Private payrolls increased by 90,000 in September, compared with a revised increase of 36,000 in August. The figure also exceeded the forecast of 70,000. Markets expect the official nonfarm payrolls report to show around 90,000 new jobs, while the unemployment rate may remain at 4.1%. The report is scheduled for Friday. A firm employment reading could lift rate expectations and Treasury yields. A weaker result could support a more patient Fed approach and improve the environment for gold.
Gold’s Parabolic Support: Could Stability Allow a Gradual Recovery?
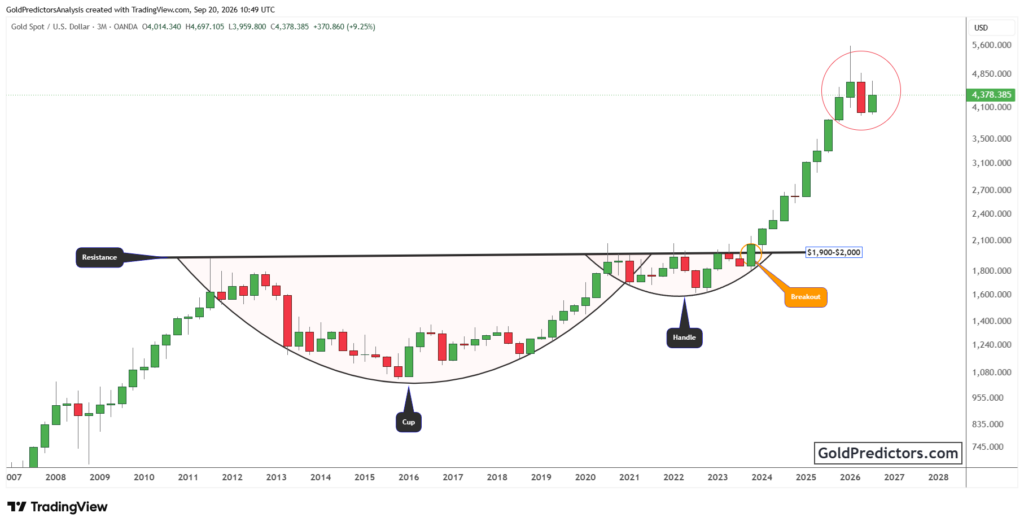
The monthly gold chart shows a broad upward structure supported by a rising parabolic curve. The metal previously moved above a major resistance area that had limited progress for many years. This breakout led to a rapid rise before the recent correction brought the price back toward the curved support line.
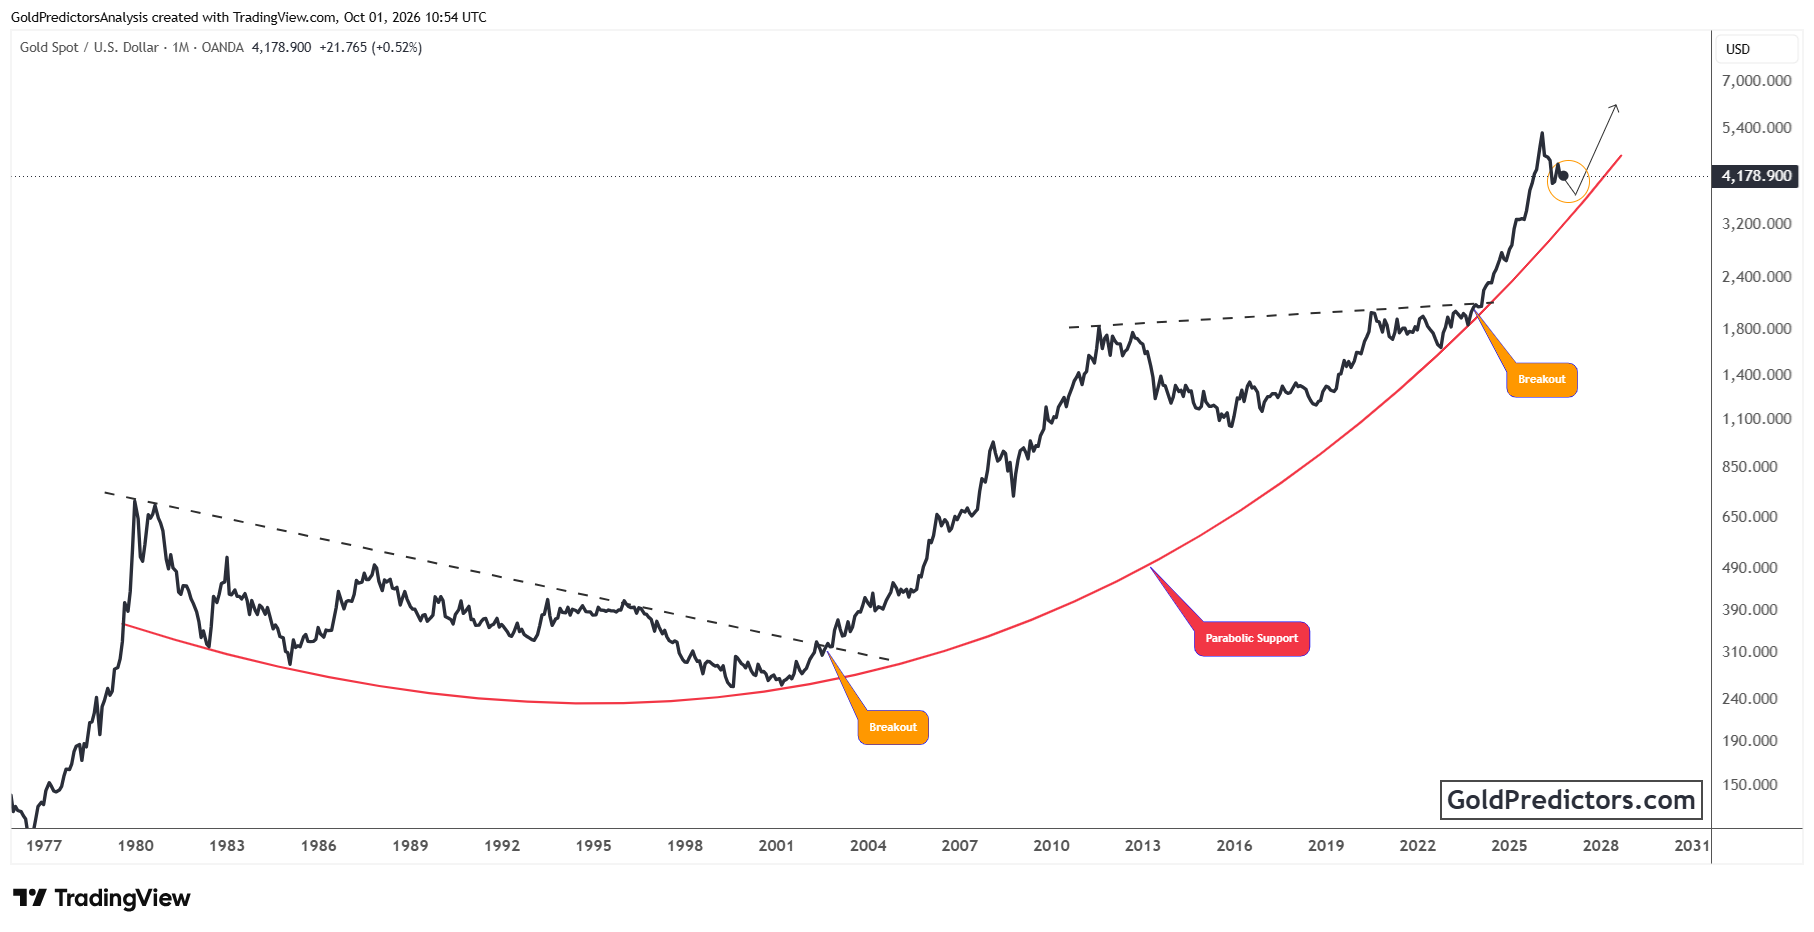
Gold is currently holding above that curve. This area provides an important base for the present structure. Continued monthly closes above it could allow price to consolidate and gradually recover toward the previous record region. A move above that region would strengthen the case for another expansion. However, gold must first establish a stable base and move through recent resistance.
The downside risk also deserves attention. A sustained monthly move below the parabolic curve would weaken the current structure. It could lead to a wider period of consolidation before another major move develops. Even in that case, the earlier multi-decade breakout would remain relevant because price still trades far above the former resistance zone.
Gold’s Strength against Inflation Faces a Rising Support Test
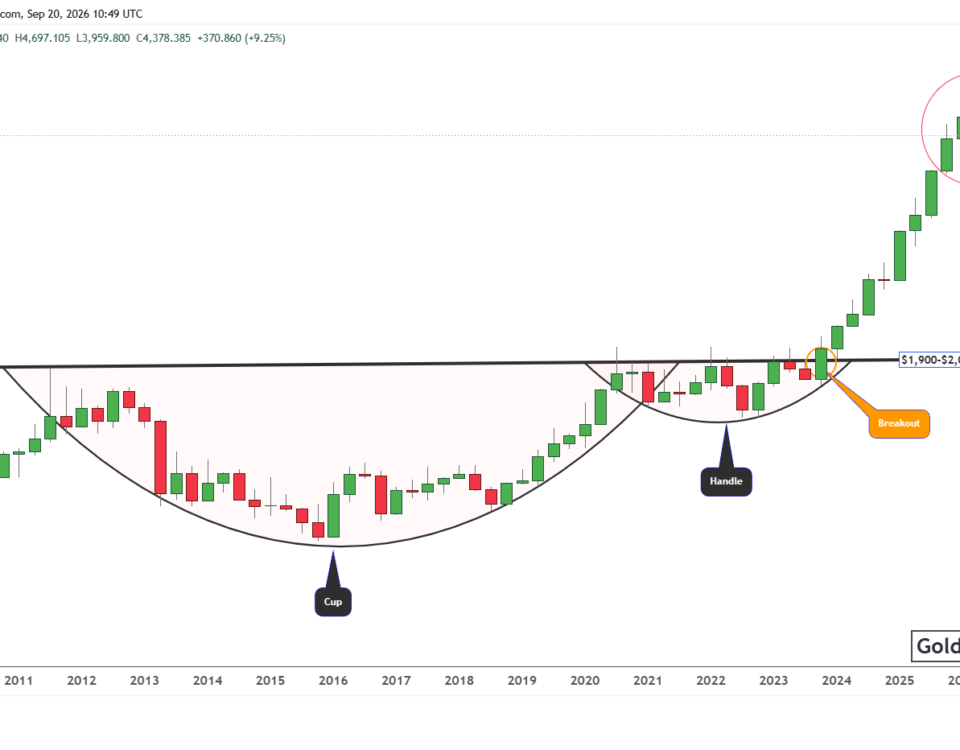
The Gold/CPI ratio is holding near 12.5 after correcting from the upper side of its rising structure. The ratio remains comfortably above the former resistance area that completed the large cup-and-handle pattern. This means gold continues to perform well relative to consumer prices despite the recent decline.
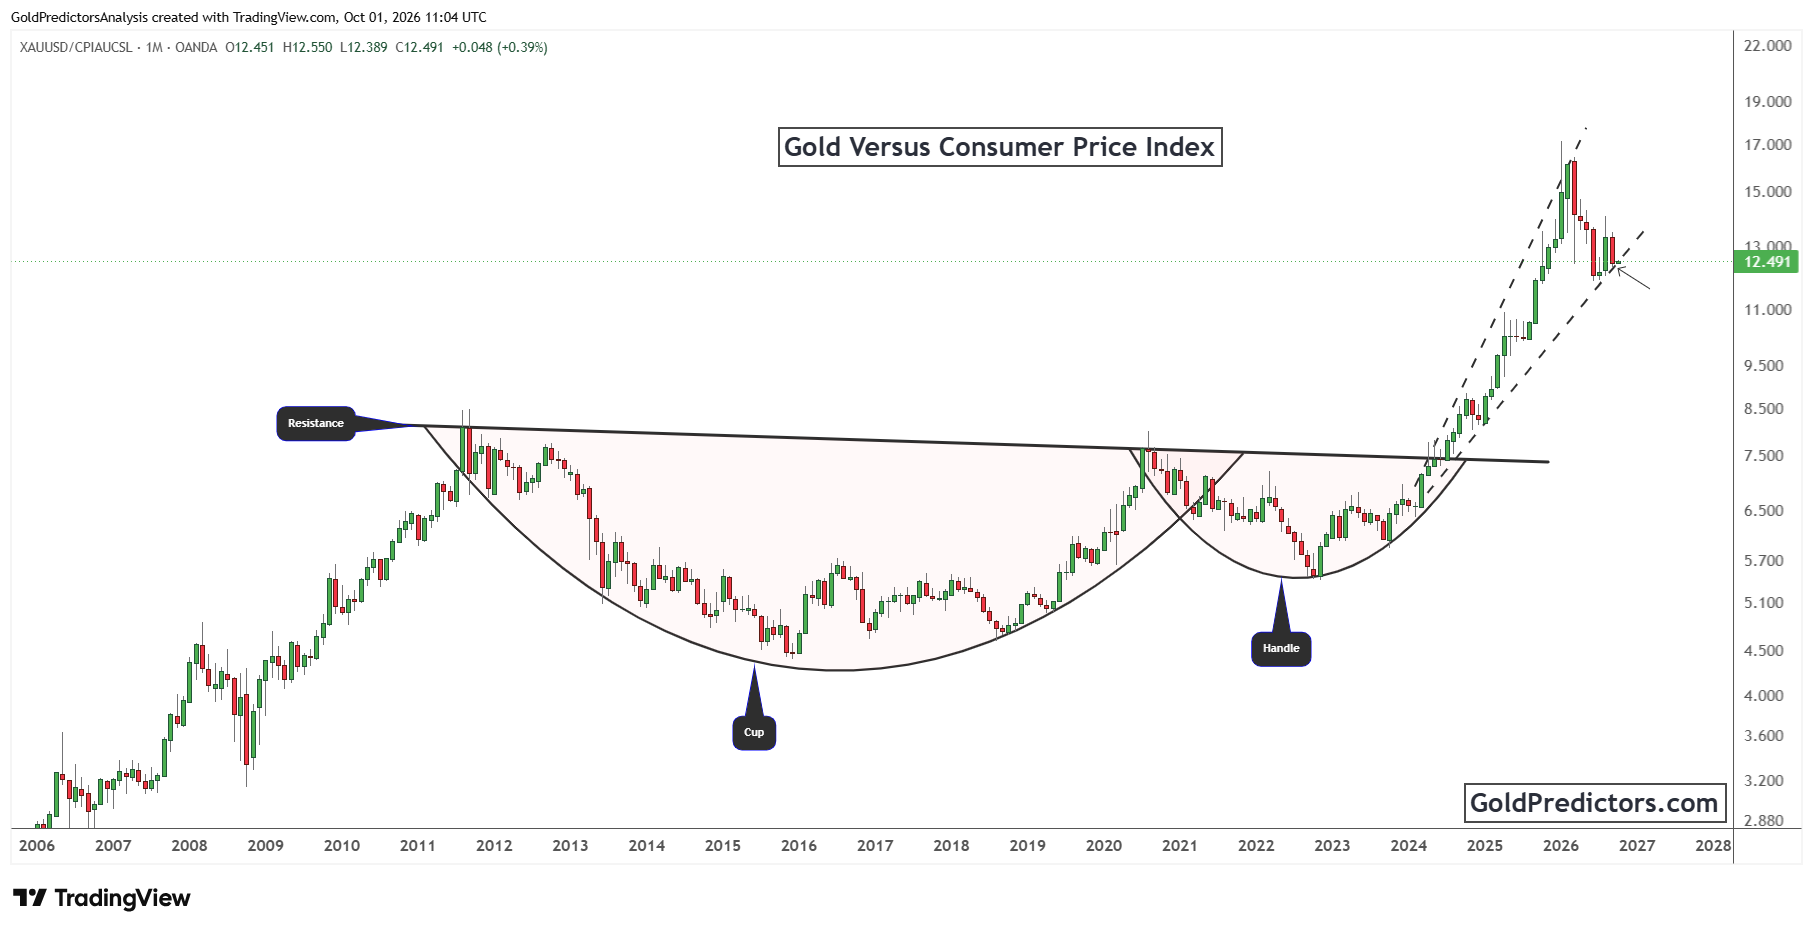
The ratio is now testing the lower boundary of its rising range. Holding this area could allow relative strength to improve again. That would suggest gold is maintaining its purchasing power against inflation. A sustained move below this boundary would weaken the structure and could signal a longer period of consolidation in inflation-adjusted terms.
Both charts currently present a similar message. Gold and the Gold/CPI ratio remain near rising support after major breakouts. Stability in both structures would provide stronger evidence that the recent correction is losing momentum.
Gold Price Outlook: What Could Strengthen or Weaken the Broader Trend?
Gold’s outlook remains constructive but conditional. Softer PCE inflation has reduced expectations for an immediate Fed rate increase, but the employment report could quickly change the rate outlook. Gold remains above its rising parabolic support, while the Gold/CPI ratio holds above its major breakout. If these structures remain intact, gold could recover toward its previous record area. A loss of support would instead increase the risk of broader consolidation. The reaction to payroll data and the behavior around monthly support will provide the next important direction.
Gold Predictors Premium Membership
Get exclusive short-term and swing trade ideas with precise entry levels, stop-loss, and target prices, including justification and analysis — all delivered directly via WhatsApp.
Our premium service includes deep technical analysis on gold and silver markets. We cover cycle analysis, price forecasting, and key timing levels.
Members also receive a weekly market letter with detailed analysis, commentary from our Chief Analyst, including actionable insights, trade timing, and direction forecasts for gold and silver.
Stay ahead of the market — join our premium community today.