Gold vs Google: Is the Ratio Ready to Challenge Long-Term Resistance?
Gold (XAU/USD) remains above its major long-term breakout trendline despite the latest decline from higher levels. Price continues to hold well above former resistance, keeping the major breakout structure intact. At the same time, the Gold versus Google ratio remains within a large descending channel. The ratio is holding above the support trendline but remains below key resistance. A break above this resistance would be needed for gold to show stronger relative performance against Google. These developments keep focus on gold’s long-term technical structure and its performance relative to Google.
Gold Price Analysis: Long-Term Breakout Remains Intact
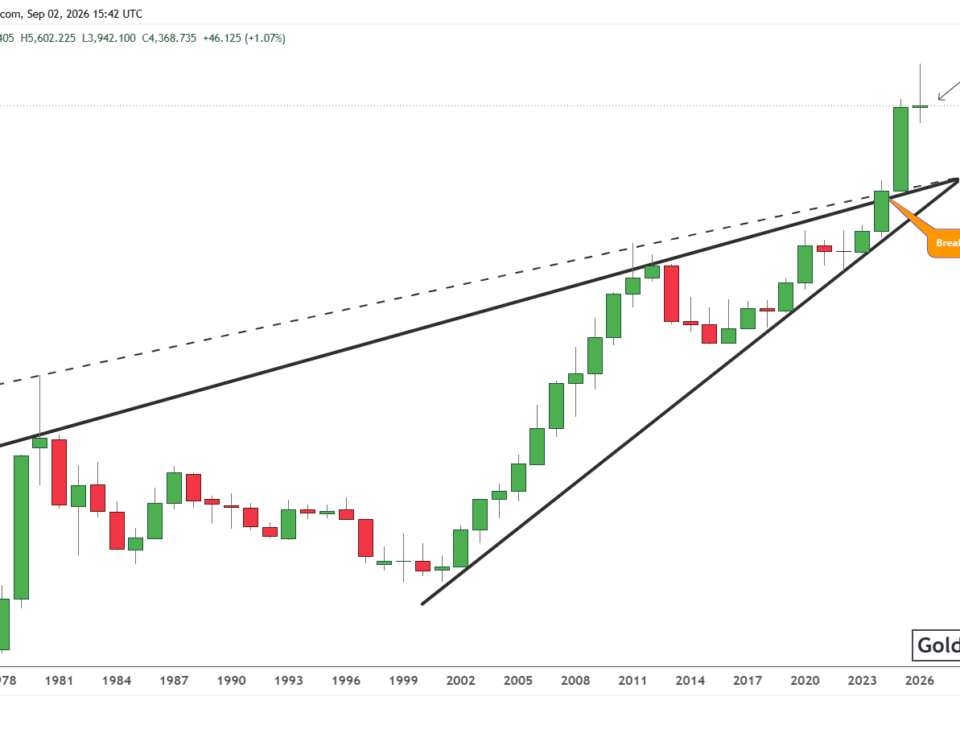
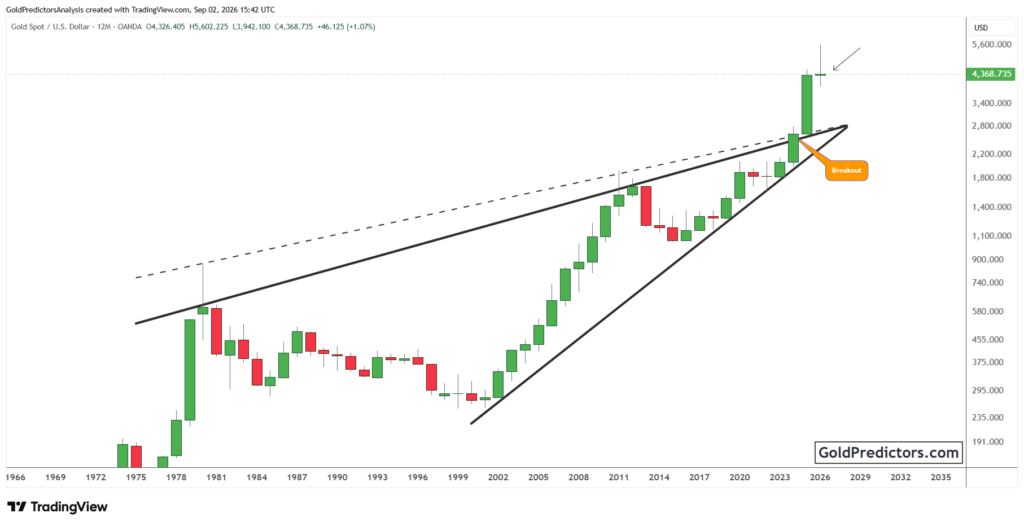
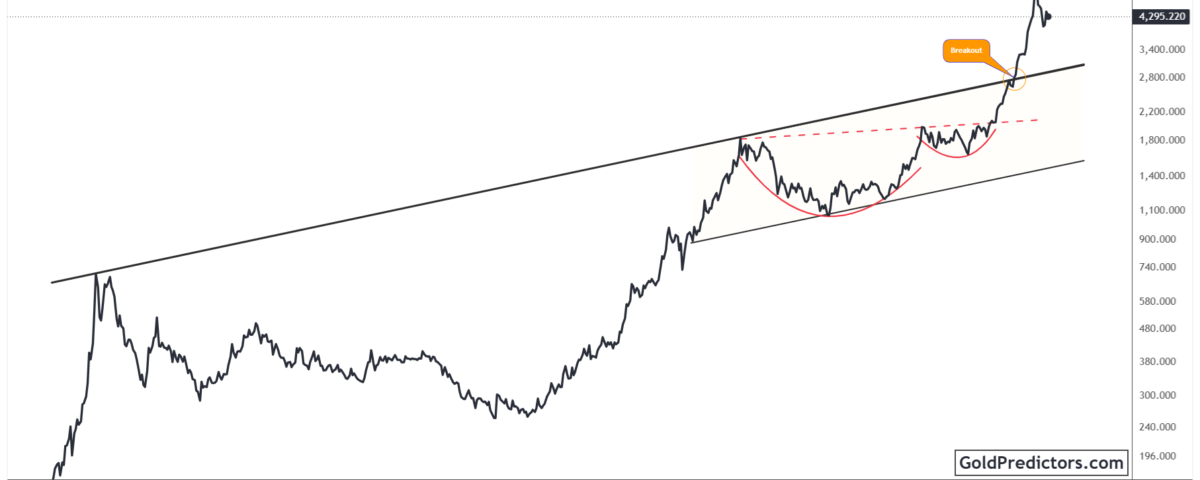
The gold chart below shows a long-term resistance trendline that developed over several decades. This trendline repeatedly stopped major rallies and remained a key barrier. Gold later formed a large ascending channel beneath the resistance trendline, with several rounded bottoms developing inside the channel. These formations created a strong technical foundation for the next major price expansion. Gold eventually broke above the long-term resistance trendline near the $2,800 region. This breakout marked an important shift in the long-term price structure.
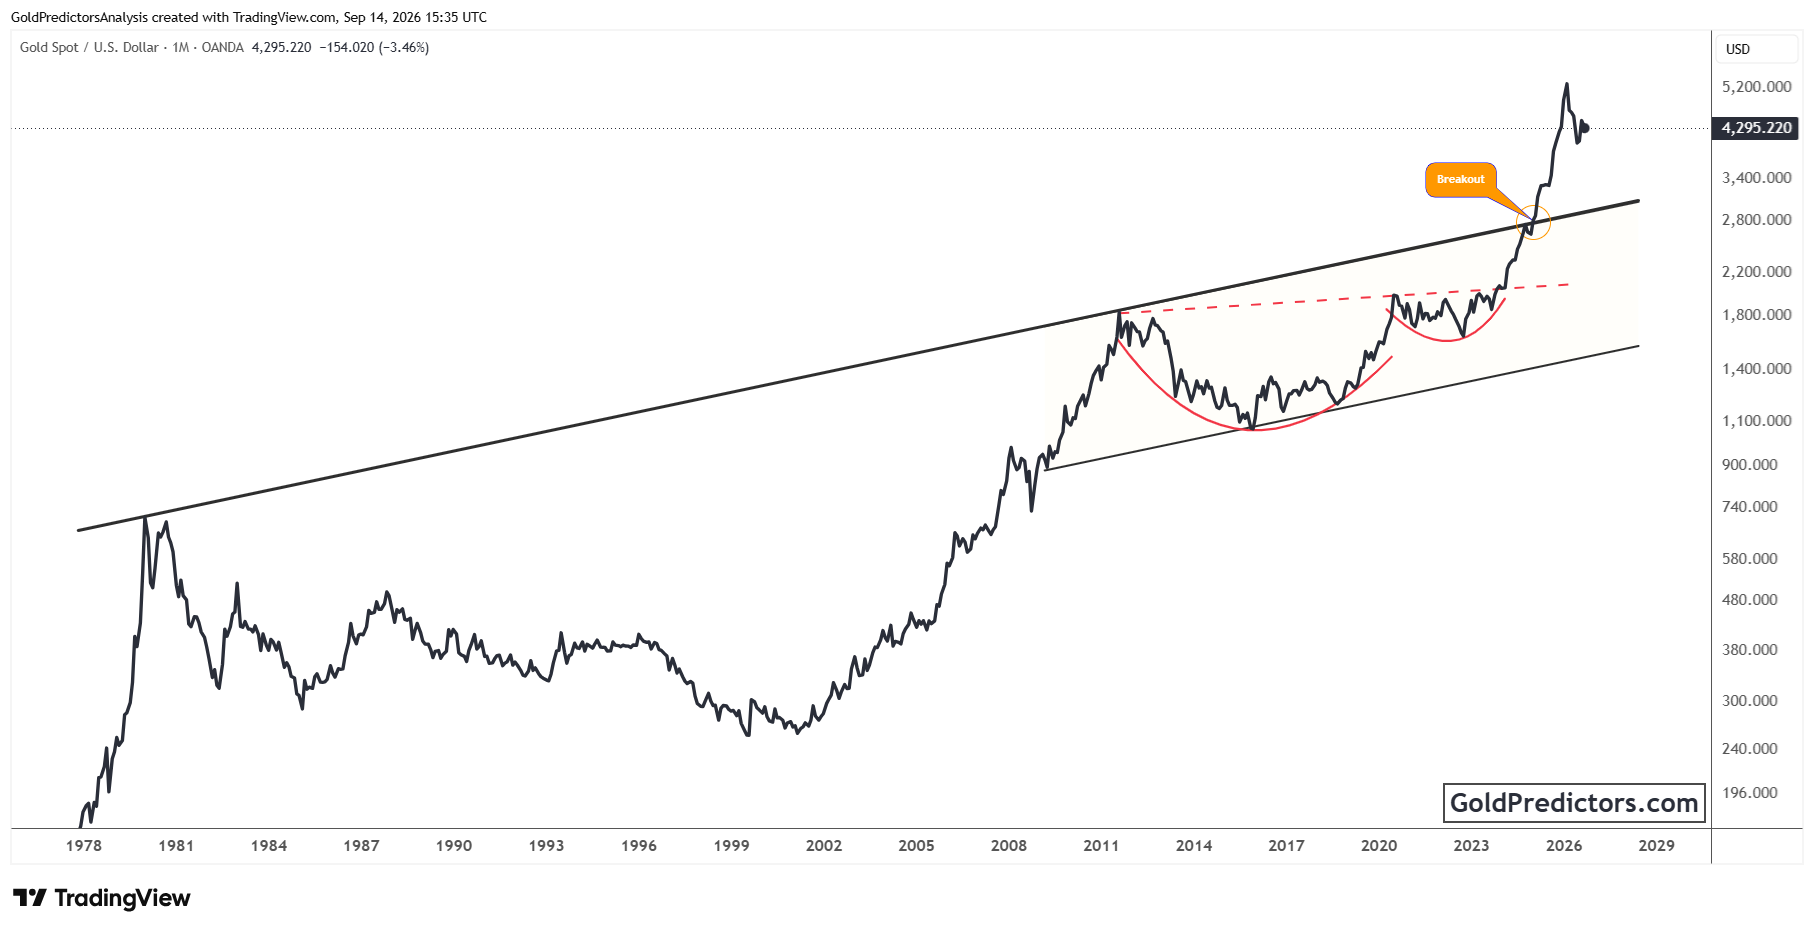
After the breakout, gold accelerated and moved well above the former resistance trendline. Price climbed above $5,000 before pulling back from higher levels. Gold is now trading below $4,300 but remains well above the broken long-term resistance trendline. The broken resistance trendline may now provide support if price declines further. As long as gold remains above this trendline, the major breakout structure remains intact.
The latest decline follows a significant rise and appears to be part of a normal correction after the breakout. Despite the pullback, the overall technical structure remains intact. The long-term trendline now remains the key level to watch. Holding above this trendline would preserve the breakout structure and leave room for another upward phase.
Gold vs Google Ratio Holds Support within a Long-Term Descending Channel
The chart below shows the Gold versus Google ratio trading within a large descending channel that has developed over many years. The ratio measures the relative performance of gold against Google shares. A rising ratio means gold is outperforming Google, while a falling ratio means Google is performing better than gold. The overall decline reflects Google’s stronger relative performance. The ratio has repeatedly moved between the descending support and resistance trendlines and currently remains within this established structure.
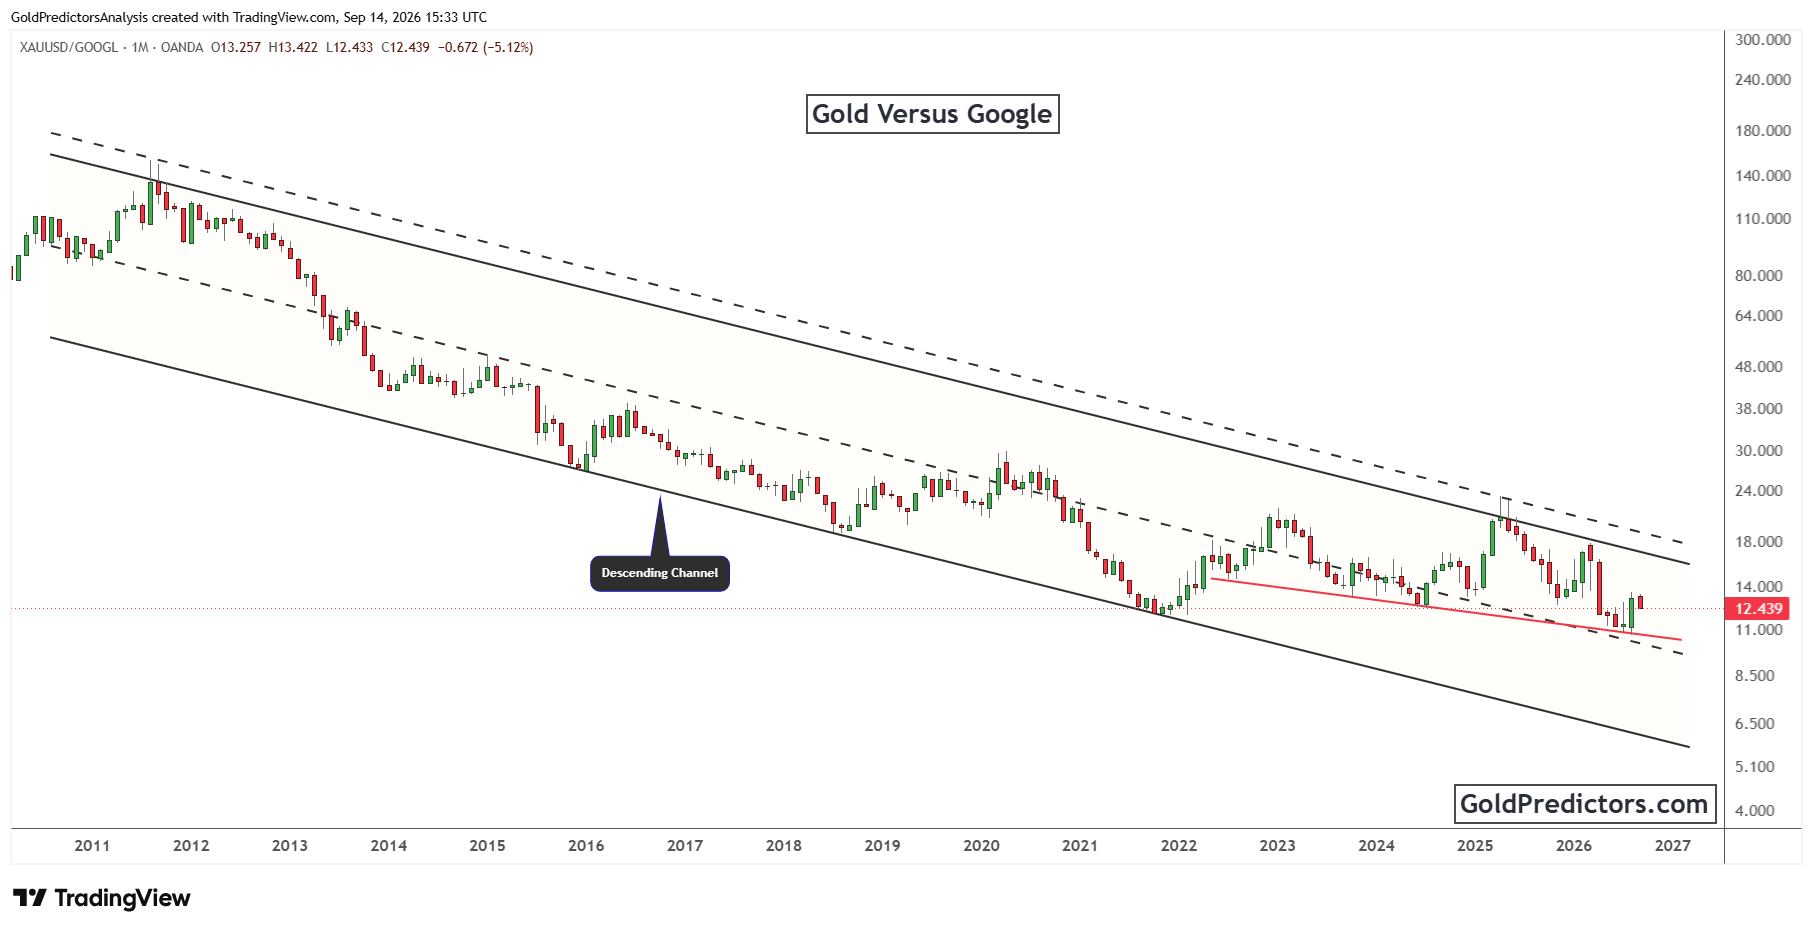
Recently, the Gold versus Google ratio declined toward the middle of the descending channel before finding support. A shorter downward-sloping trendline has also formed within the channel. The ratio is now trading around 12.4 and remains below the main descending resistance trendline. A break above this resistance would be needed to indicate a meaningful change in the long-standing relative structure.
The next direction of the ratio could provide an important signal for the relative performance of gold and Google. If the ratio gains strength from current levels, it could move toward the descending resistance trendline. A break above this resistance would indicate stronger relative performance in gold compared with Google. In contrast, another rejection from resistance could keep the ratio within the descending channel. A break below the support trendline would weaken the ratio further and indicate continued relative strength in Google compared with gold.
Gold Price Outlook: XAU/USD Holds above Breakout Trendline as the Ratio Stays Above Support
Gold remains above its major long-term breakout trendline despite the latest decline. Price still holds well above the former resistance that previously limited major gains. This keeps the larger breakout structure intact. The long-term trendline remains important if the correction extends further.
At the same time, the Gold versus Google ratio remains within its long-term descending channel. The ratio has found support but still trades below the descending resistance trendline. A break above this resistance would signal stronger relative performance for gold against Google.
These technical structures remain important for the next direction in gold. Holding above the long-term breakout trendline would keep the positive gold structure intact. Meanwhile, the Gold versus Google ratio needs to clear descending resistance to shift its long-standing trend.
Gold Predictors Premium Membership
Get exclusive short-term and swing trade ideas with precise entry levels, stop-loss, and target prices, including justification and analysis — all delivered directly via WhatsApp.
Our premium service includes deep technical analysis on gold and silver markets. We cover cycle analysis, price forecasting, and key timing levels.
Members also receive a weekly market letter with detailed analysis, commentary from our Chief Analyst, including actionable insights, trade timing, and direction forecasts for gold and silver.
Stay ahead of the market — join our premium community today.