


Silver Price Forecast: XAGUSD Corrects as Silver-to-Dow Ratio Nears Key Support
Silver (XAGUSD) has entered a corrective phase after reaching a major long-term resistance area. Price recently reversed lower after a strong advance toward the upper boundary of a multi-decade ascending channel. At the same time, the Silver versus Dow Jones ratio has pulled back after breaking above a long-term triangle pattern. These developments highlight an important period for silver as both price and relative performance approach key technical levels.
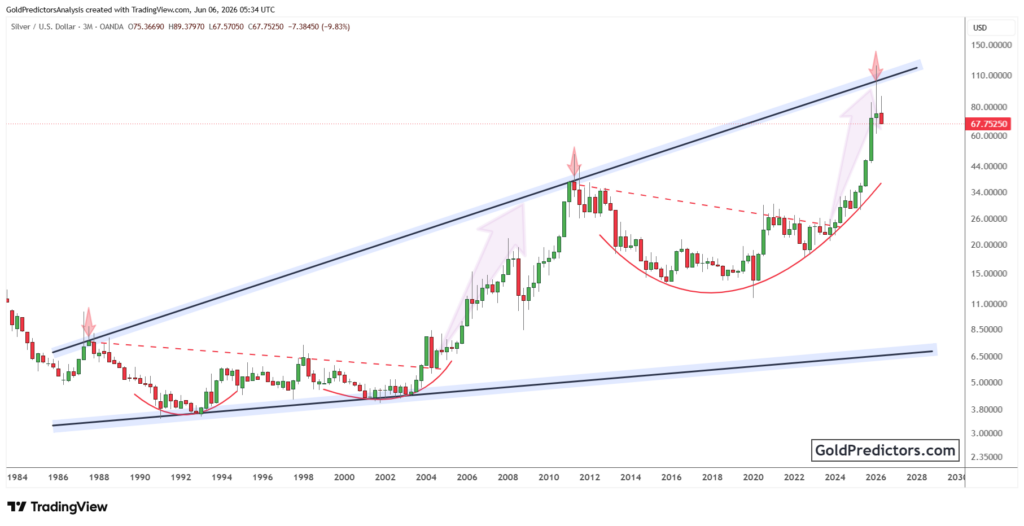
XAGUSD Technical Analysis: Silver Enters Correction After Strong Rally
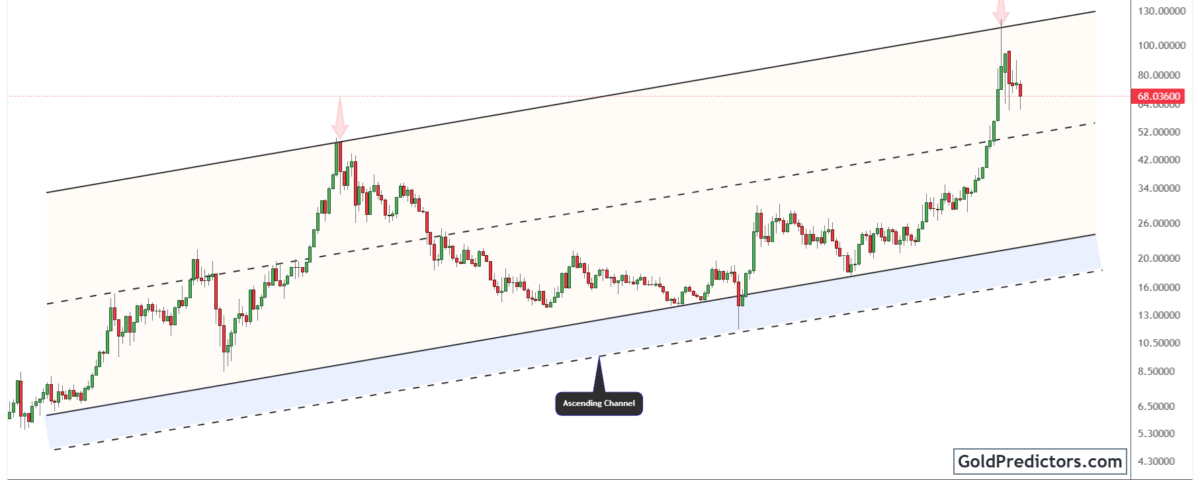
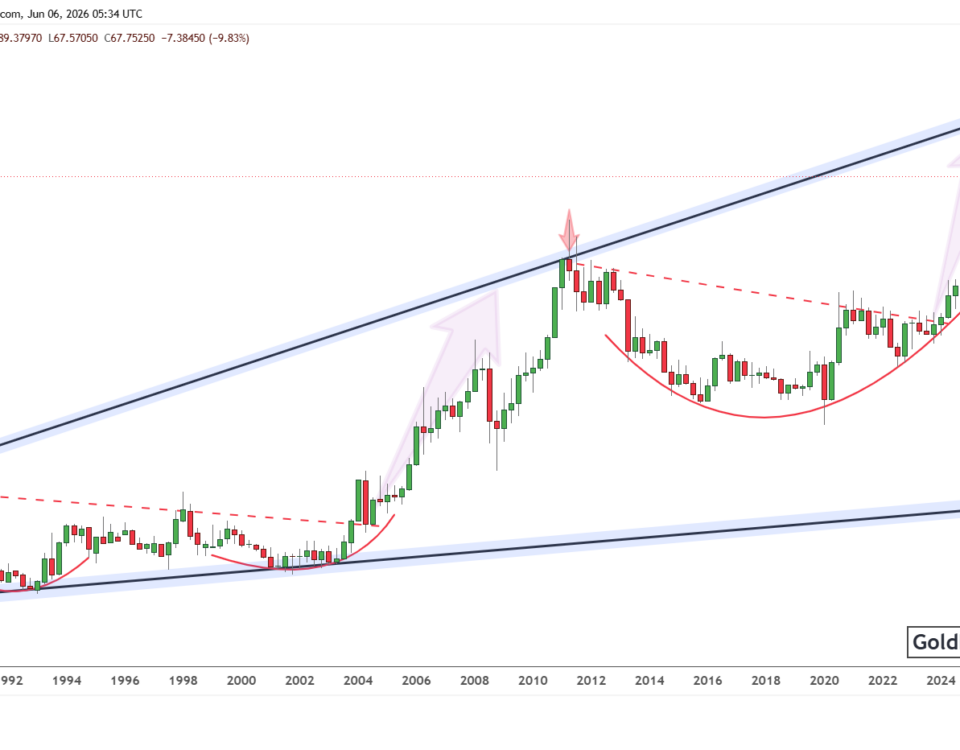
The silver chart below shows price trading within a large ascending channel that has guided market behavior for more than two decades. The channel has contained several major bull and bear cycles. Price repeatedly reacted to both the upper and lower boundaries of this structure. Previous advances toward the upper trendline often marked important turning points and were followed by lengthy consolidation or correction phases.
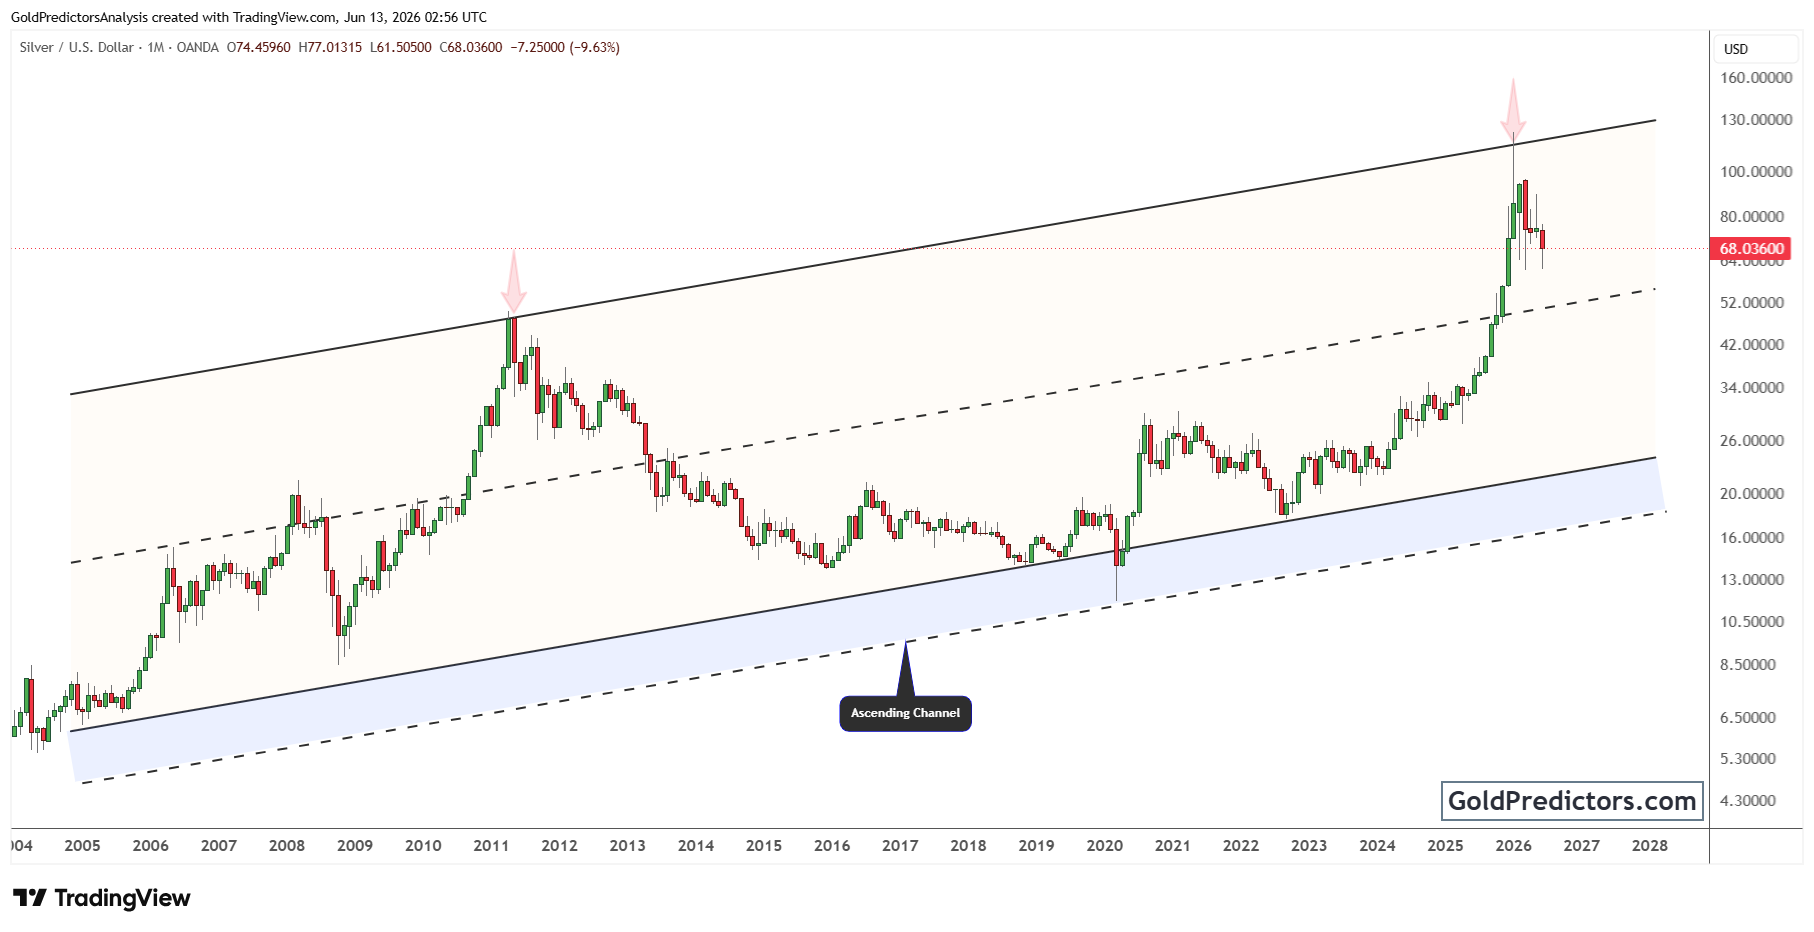
In 2011, silver staged a powerful rally and reached a major peak near the upper boundary of the ascending channel. After reaching this long-term resistance area, price turned lower and entered an extended period of weakness. The decline continued for several years and gradually carried silver toward the lower half of the channel. This price action highlighted the importance of the channel, as both its upper and lower boundaries continued to influence the long-term direction of the market.
More recently, silver staged another powerful advance and climbed rapidly toward the upper boundary of the ascending channel. Price accelerated sharply during the final phase of the rally and reached a level similar to previous major peaks. However, the latest move into channel resistance encountered strong resistance and triggered a pullback. Silver has since entered a correction and moved lower from recent highs. Despite the decline, the long-term structure remains constructive as the market undergoes a period of adjustment.
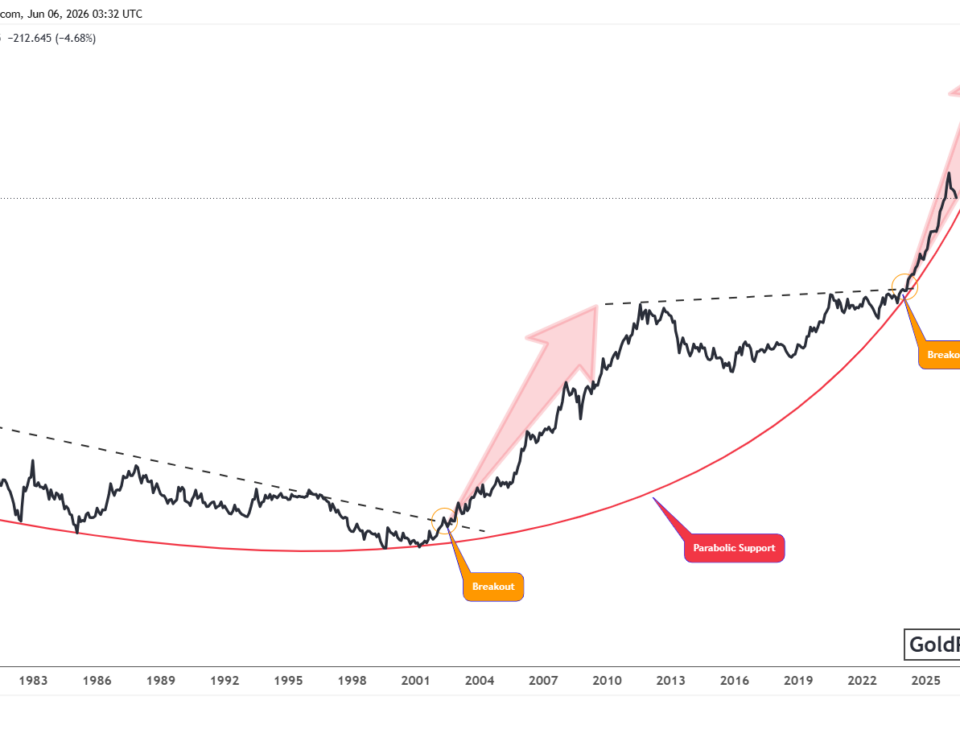
Silver vs Dow Jones Ratio Pulls Back After Major Long-Term Breakout
The chart below shows the Silver versus Dow Jones ratio trading within a large triangle pattern that has guided relative performance for several decades. This ratio helps measure silver’s strength compared to equities and provides important insight into long-term market trends. The pattern developed after the major peak in 1980 and has continued to shape relative performance ever since. Repeated reactions at the descending resistance trendline and the rising support trendline have shaped the ratio’s long-term direction, highlighting the significance of these boundaries over time.
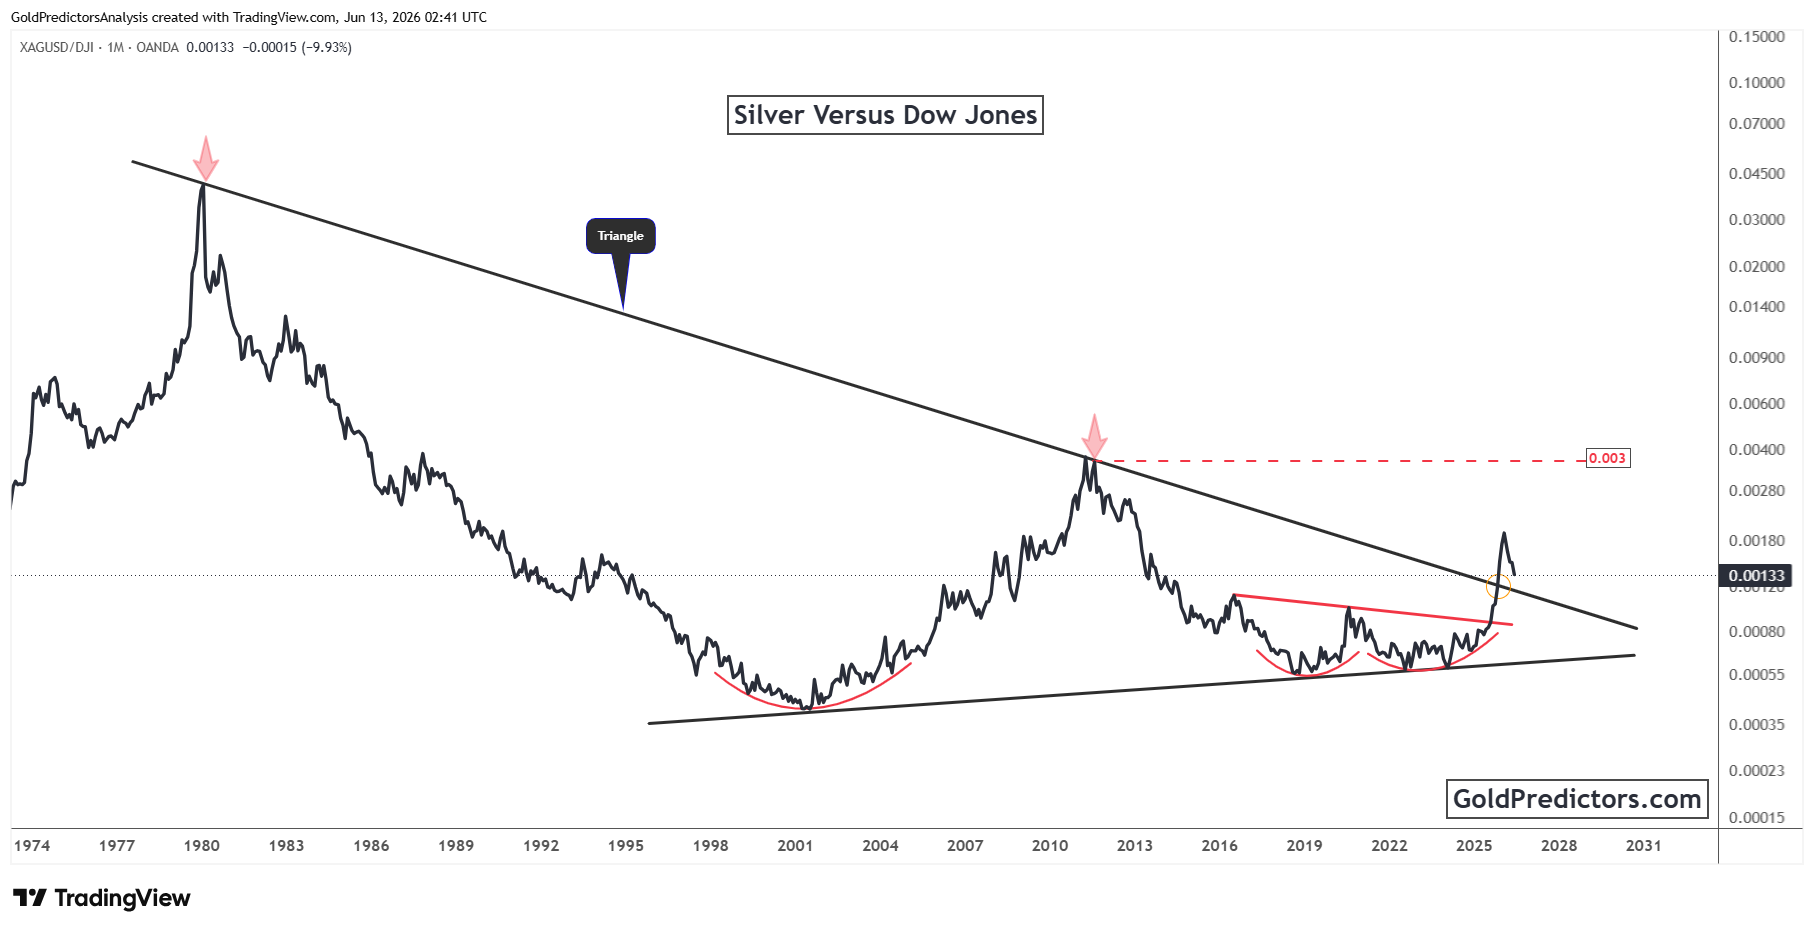
The chart also highlights several rounded bottom formations that developed near the rising support trendline. These formations appeared after extended declines and marked important turning points in relative performance. Each rounded base was followed by a recovery phase that pushed the ratio higher. The repeated appearance of these formations shows that the lower boundary of the triangle has remained an important area of support over time.
More recently, the ratio rallied from the rising support trendline and broke above the descending resistance line of the triangle. The breakout marked a notable shift in momentum and improved silver’s relative performance versus equities. Following the advance, the ratio entered a pullback and moved back toward the former triangle resistance trendline. This area now acts as an important support level and may play a key role in shaping the next move in the ratio.
Conclusion: Silver Corrects as Relative Performance Approaches Key Support
Silver has entered a correction after reaching the upper boundary of its long-term ascending channel. Similar moves in the past often led to extended periods of consolidation before the next major trend developed. The recent pullback highlights the importance of channel resistance and confirms that this area continues to influence long-term price action.
At the same time, the Silver versus Dow Jones ratio has pulled back after breaking above a multi-decade triangle pattern. The ratio remains near the former resistance trendline, which now acts as an important support area. Price behavior around this level may provide valuable insight into silver’s relative performance versus equities in the months ahead.
These developments keep attention focused on these long-term technical structures. Silver continues to consolidate following its reversal from long-term channel resistance. Meanwhile, the Silver versus Dow Jones ratio remains above its long-term breakout zone. Price behavior around these key levels will likely play an important role in determining the next phase of the broader trend.
Gold Predictors Premium Membership
Get exclusive short-term and swing trade ideas with precise entry levels, stop-loss, and target prices, including justification and analysis — all delivered directly via WhatsApp.
Our premium service includes deep technical analysis on gold and silver markets. We cover cycle analysis, price forecasting, and key timing levels.
Members also receive a weekly market letter with detailed analysis, commentary from our Chief Analyst, including actionable insights, trade timing, and direction forecasts for gold and silver.
Stay ahead of the market — join our premium community today.
