


Gold Clears Decades-Long Resistance as Dollar-to-Gold Ratio Breaks Support
Gold (XAUUSD) has broken above a long-standing trendline that capped advances for decades. This move signals a clear shift in price structure and confirms acceptance of higher ranges. The breakout follows years of compression within a long-term structure that absorbed repeated corrections without breaking down. At the same time, the U.S. Dollar versus gold ratio has broken below long-term support and remains under pressure. These developments point to a meaningful change in long-term conditions, with the broader setup continuing to favor higher prices over time.
Gold Breaks Decades-Long Trendline as Long-Term Structure Turns Higher
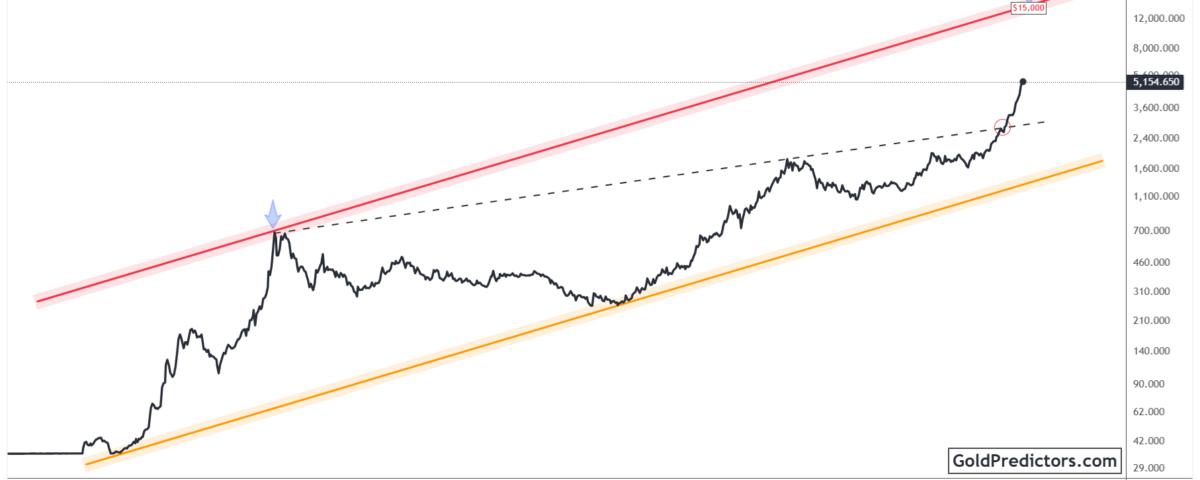
The gold chart below shows a long-term technical structure, with parallel support and resistance consistently guiding price action across five decades. The lower boundary of this structure has repeatedly provided support during major corrections. Each test of this area was followed by price stabilization and renewed accumulation. The repeated defense of this zone points to sustained demand across multiple market cycles.
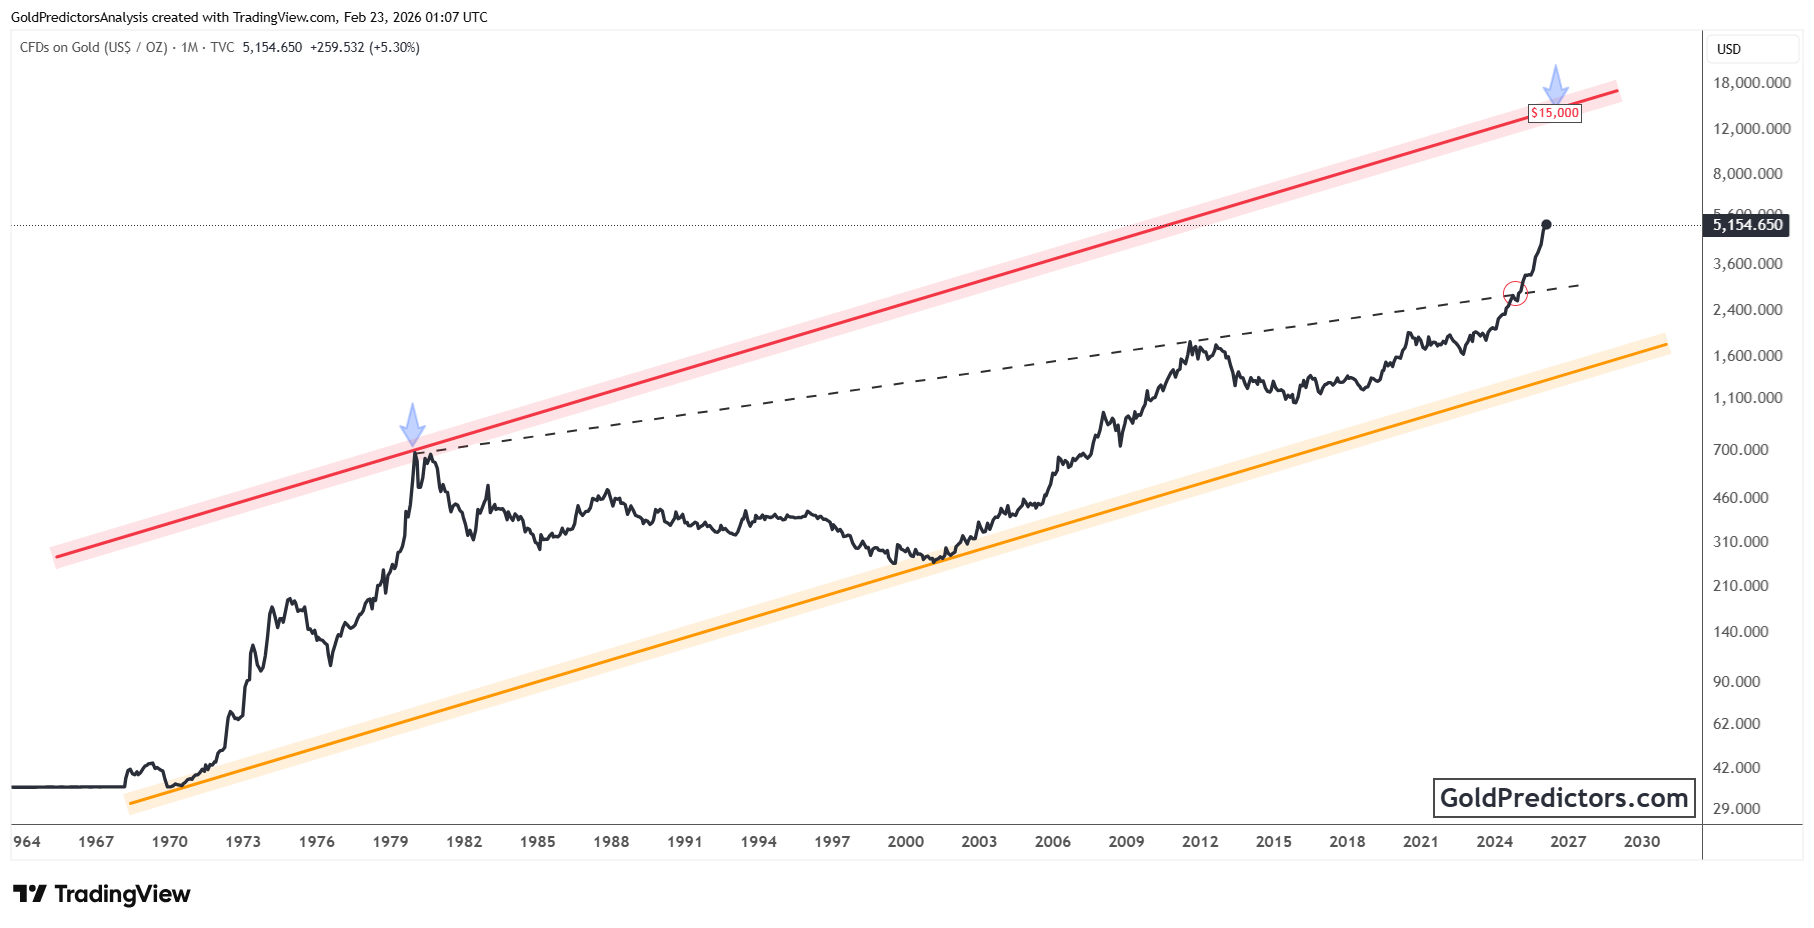
This long-term structure also captures how gold behaved during earlier peak phases, offering important context for the current setup. In the late 1970s, the price advanced toward the upper boundary of the structure before forming a sharp peak. A lengthy consolidation followed, yet gold never broke the rising lower trendline. Instead, the price moved sideways for many years and worked through prior gains. This phase reflected stabilization and base development rather than a structural breakdown.
Recent price action points to a meaningful change in gold’s long-term structure. Price moved above a long-standing trendline that had capped advances for decades and rotated into a higher range. Since then, gold has held above former resistance, indicating acceptance of higher levels. As long as the price remains above this key trendline, the broader structure continues to favor higher prices over time.
Gold Strength Persists as U.S. Dollar Ratio Breaks Key Structural Support
The chart below shows a prolonged downtrend in the U.S. Dollar versus gold ratio. The ratio has declined for decades within a broad descending wedge, with rallies repeatedly capped by falling resistance. Breakdowns from this structure have consistently aligned with periods of gold outperformance, pointing to a sustained shift in relative strength.
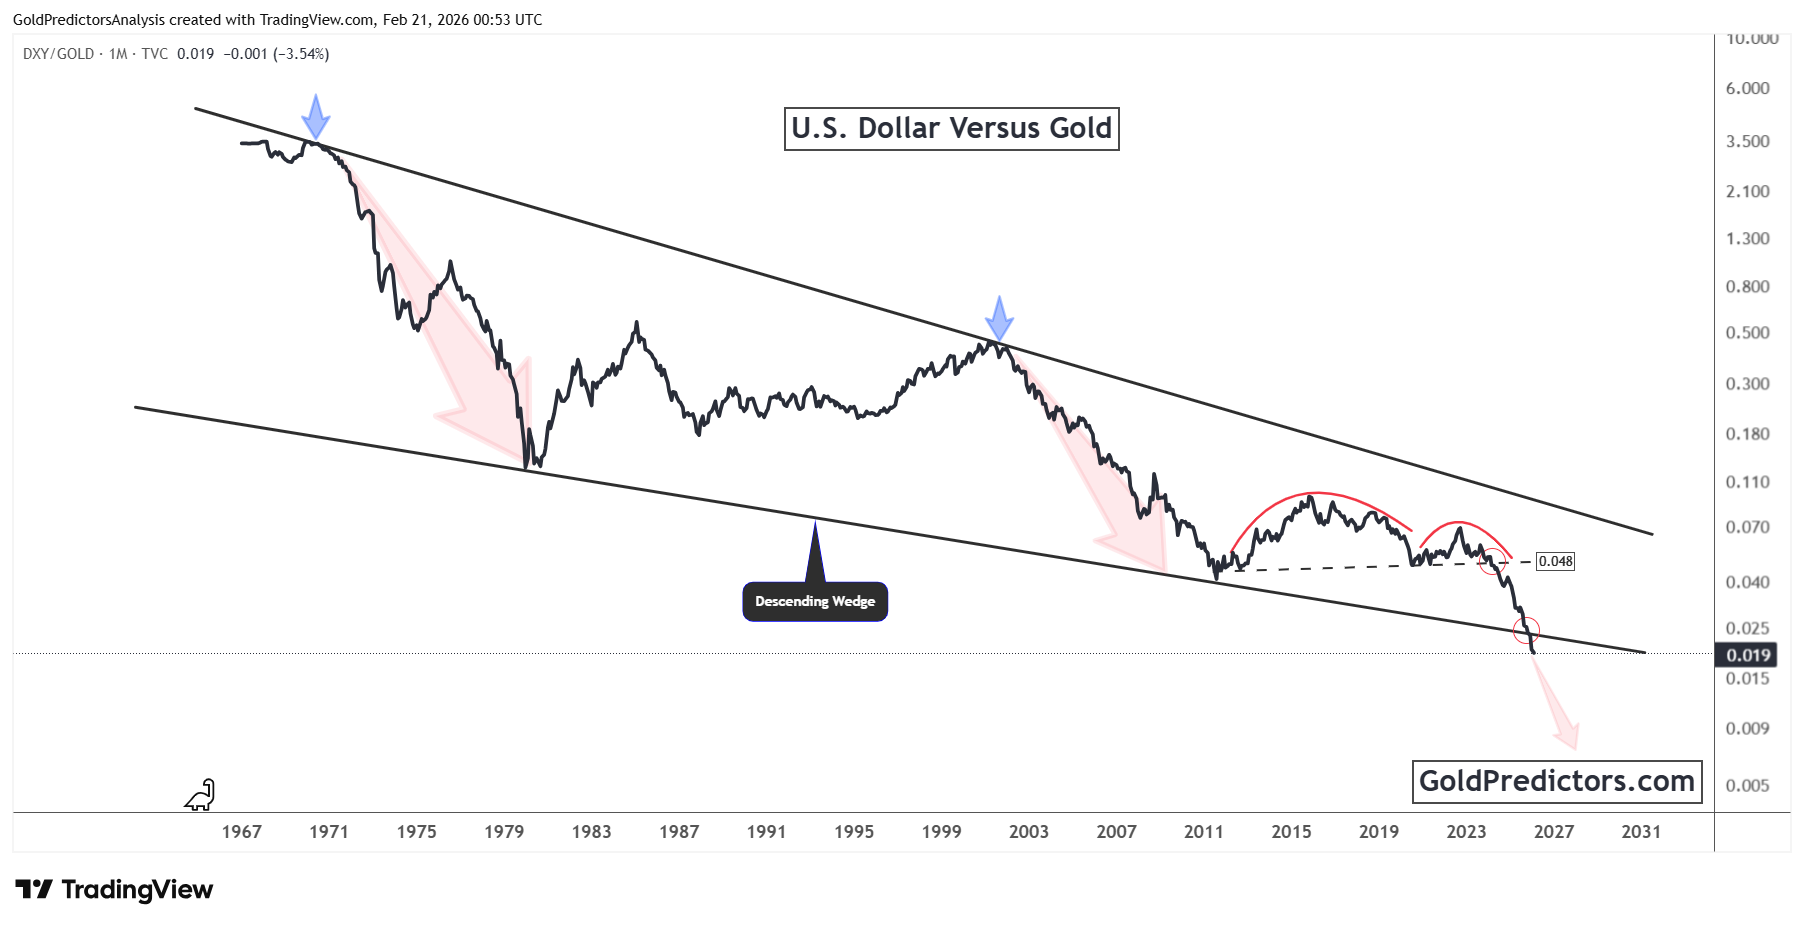
Several major turning points stand out across past cycles. In each instance, the ratio peaked near the upper boundary of the wedge before rolling over sharply. These reversals coincided with strong advances in gold. The current setup follows a similar pattern, as the ratio failed to sustain a recent breakout attempt and has since resumed its broader decline.
Recent developments point to renewed weakness in the U.S. Dollar versus gold ratio. Price has broken below horizontal support that previously acted as a floor, signaling increased pressure on the Dollar relative to gold. The move also pushed the ratio beneath the lower boundary of the long-term descending wedge. With stabilization not yet evident, the setup continues to favor gold unless the ratio can reclaim former support.
Gold Outlook: Structural Shifts and Dollar Ratio Favor Higher Prices
Gold has moved beyond a decades-long constraint, confirming a shift in its long-term trend. The decisive break above the long-standing trendline signals acceptance of higher price ranges. Price has held above former resistance, indicating a change in structure rather than short-term momentum. As long as gold remains above this trendline, the broader technical framework stays constructive.
At the same time, the Dollar versus gold ratio continues to weaken after breaking below key structural support. Similar breakdowns in past cycles aligned with extended periods of gold outperformance. The failure to recover former support continues to favor gold. This behavior suggests a broader preference for monetary assets as relative trends continue to shift.
These developments point to a sustained change in long-term conditions. Gold has exited a prolonged phase of compression and established itself in a higher structural range. Short-term pauses remain possible, yet the alignment between price structure and intermarket trends continues to support higher levels. As long as gold holds above its former trendline and the Dollar ratio remains under pressure, the broader structure continues to favor higher prices.
Gold Predictors Premium Membership
Get exclusive short-term and swing trade ideas with precise entry levels, stop-loss, and target prices, including justification and analysis — all delivered directly via WhatsApp.
Our premium service includes deep technical analysis on gold and silver markets. We cover cycle analysis, price forecasting, and key timing levels.
Members also receive a weekly market letter with detailed analysis, commentary from our Chief Analyst, including actionable insights, trade timing, and direction forecasts for gold and silver.
Stay ahead of the market — join our premium community today.


